dam it!

This project is inspired by the tensions between dams, the environment, and people displaced or otherwise affected by dams.

In this animation, you become the dam builder. By pressing the mouse anywhere on the canvas, a dam emerges in the river, affecting the water level, marine life (fish and plants), and nearby communities (houses). Moving the mouse from left to right raises the dam and increases its impact, killing fish and making houses disappear. Pressing the space bar replenishes the fish population. Clicking the mouse advances to different facts about dams, stored in an array. These facts are adapted from research summarized by Earth Law Center and HuffPost.

sketch
/* jaden luscher
jluscher
section a
dammit(!): an educational animation */

var waterlevel1; // water level left of dam (upstream)
var waterlevel2; // water level right of dam (downstream)
var damX = 100;	// x location of dam

var fish = [];
var numFish = 40;

var house = []; // original array of houses
var newhouseProbability = 0.03; // likelihood of a new house popping up

var plants = [];
var plantNum = 100;

var sceneNum = 0;   // main reference for changing objects
var factNum = 0;    // determines index of damFacts array
var damFacts = ['what a beautiful ecosystem... click to screw it up!',
    'great. you built a dam. the river’s flow is restricted. click to learn more.',
    'the united states has over 9,000 dams...',
    '...many are not equipped to handle the amount of water that could result from climate change.',
    'pennsylvania has 145 high hazard dams in poor or unsatisfactory condition.',
    'dams have fragmented two thirds of the worlds large rivers...',
    '...and have flooded a land area the size of california.',
    'their reservoirs contain three times as much water as all the world’s rivers, and speed up evaporation.',
    'dams disrupt fish and bird migration, both physically and chemically...',
    '...and habitat loss is the leading cause of extinction.',
    'upstream: nutrients trapped in reservoirs can cause toxic algae blooms.',
    'downstream: ecosystems suffer from a lack of sedimentation and nutrients.',
    'less nutrients = less vegetation = more erosion',
    'river deltas are deprived of the silt they need to defend against damage from the ocean.',
    'removing damaged and aging dams protects the surrounding population from disaster...',
    '...and allows the rivers to restore their natural and biological integrity.',
    'but often what happens instead is...'
    ];

function setup() {
    createCanvas(480, 360);
	noStroke();
	frameRate(20);
    angleMode(DEGREES);
    textFont("monospace");
    textSize(12);
    if (sceneNum == 0) {
        waterlevel1 = 240;
        waterlevel2 = 240;
    }
    for(var i = 0; i < numFish; i++) {
        var newFish = makeFish();
        fish.push(newFish);
    }
    // first house
    for(var i = 0; i < 10; i++) {
        var firstHouses = makehouse(random(width), 180);
        house.push(firstHouses);
    }
    for (var i = 0; i < plantNum; i++) {
        var newPlant = makePlant();
        plants.push(newPlant);
    }
}

function draw() {
    drawSky();
    if (sceneNum > 0) {     // only occurs once mouse has been pressed
        sceneNum = constrain(floor(map(mouseX, width/2, width, 1, 12)), 1, 12);
        waterlevel1 = 240 - sceneNum * 6;
        waterlevel2 = 240 + sceneNum * 9;
    }
    drawMountain(0, 0.02, 0.00004, 50, 220);   // background mountains    
    drawMountain(1, 0.01, 0.00007, 50, 220);   // midground mountains
    drawMountainAndHouses(0.005, 0.0001, 40, 220); // foreground mountains and houses

    for (var i = 0; i < house.length; i++) {
        house[i].move();
        house[i].show();  
    }
    var keepHouses = []; // stores houses in range
    // keep houses still in range 
    if (house.length > 0) {
        for (var i = 0; i < house.length; i++) {
            if (house[i].houseExists & house[i].x + house[i].w > 0) {
                keepHouses.push(house[i]);
            }
        }
    }
    house = keepHouses; // thank you Chuong!
    water();
    push();
    for (var i = 0; i < plantNum; i++) {
        if (plants[i].plantExists) {
            plants[i].show();
            translate(width / plantNum, 0);
        }
    }
    pop();
    // draw fish
    for (var i = 0; i < numFish; i++) {
        if (fish[i].fishExists) {
            fish[i].move();                
            fish[i].show();
        }
    }
    makeDam();
    spitfacts(factNum);
    if(factNum > damFacts.length - 1) {
        gameOver();
    }
}

function mousePressed() {
    sceneNum = 1;
    factNum ++;
}

function keyPressed() {
    if(key == ' ') {
        sceneNum = 0;
        waterlevel1 = 240;
        waterlevel2 = 240;
        fish = [];  // clear fish array
        for(var i = 0; i < numFish; i++) {
            var newFish = makeFish();
            fish.push(newFish);
        }
    }
}

function gameOver() {
    background("orange");
    fill(255);
    textSize(32);
    text('DAMMIT!', 170, 180);
    textSize(14);
    textAlign(CENTER);
    text('(YOU KILLED ALL THE FISH AND HAVE CAUSED SEVERE DAMAGE TO THE ECOSYSTEM)',
            40, 250, 400)
    noLoop();
}

function drawSky() {
    background("orange");
    push();
    fill("yellow");
    translate(400, 80);
    scale(map(mouseY, 0, height, 0.5, 1));
    ellipse(0, 0, 50, 50);
    pop();
}

function spitfacts(f) {
    push();
    fill(255);
    text(damFacts[f], 30, 30, 220, 80);
    pop();
}

function drawMountain(mc, a, speed, high, low) {
    noStroke();
    if(mc == 0) fill(240, 150, 120);    // background mountain color
    if(mc == 1) fill(220, 130, 100);    // midground mountain color
    if(mc == 2) fill(20, 50, 180);      // water color
    beginShape();
    vertex(width, height);
    vertex(0, height);
    for(var i = 0; i < width + 1; i ++){
        var x = (i * a) + (millis() * speed);
        var y = map(noise(x + mc*1000), 0, 1, high, low); 
        // x + mx*100 ensures mountains look different
        vertex(i, y);
    }
    endShape();
}

function drawMountainAndHouses(a, speed, high, low) {
    noStroke();
    fill(200, 100, 60);     // foreground mountain color
    beginShape();
    vertex(width, height);
    vertex(0, height);
    for(var i = 0; i < width + 1; i ++){
        var x = (i * a) + (millis() * speed);
        var y = map(noise(x), 0, 1, high, low); 
        vertex(i, y);
    }
    endShape();

    if (newhouseProbability > random(1.0)) {  
        // make new house randomly
        var newhouse = makehouse(width + 1, y);
        house.push(newhouse);
    }
}

function makehouse(px, py) {
    var newhouse = {x : px,
                y : random(220, py),
                w : random(10, 30),
                h : random(10, 30),
                rh : random(3, 15),
                c : color(random(100, 255), random(100), 0),
                dx : -1,
                houseExists: true,
                move : movehouse,
                show : showhouse}
    return newhouse;
}

function showhouse() {  // house x, y, width, height, roof height
    push();
    fill(this.c);
    rect(this.x, this.y, this.w, this.h);
    beginShape();
    vertex(this.x - 2, this.y);
    vertex(this.x + (this.w/2), this.y - this.rh); // roof peak
    vertex(this.x + this.w + 2, this.y);
    endShape();
    fill(230, 180, 120);
    rect(this.x + this.w / 2 - 4, this.y + this.h, this.w / 4, -this.h / 2); // door
    pop();
}

function movehouse() {
    this.x += this.dx;
    if(this.y + this.h > waterlevel1) {
        this.houseExists = false;
    }
}

function makePlant() {
    var plant = {x: 0,
                y: 0,
                c: color(random(50), random(100, 200), random(100)),
                n: floor(random(3, 6)),
                len: random(-5, -40),
                plantExists: true,
                show: showPlant,
    }
    return plant;
}

function showPlant() {
    push();
    translate(0, height + 10 + sceneNum * 3);
    rotate(15 / this.n)
    stroke(this.c);
    strokeWeight(6/this.n);
    for (var i = 0; i < this.n; i++) {
        line(0, 0, 0, this.len + random(-1, 1));
        rotate(-30 / this.n);
    }
    pop();
}

function makeFish() {
        var newFish = {x: random(0, width), 
                y: random(waterlevel1 + 10, height-20),
                w: int(random(10, 25)), h: int(random(5, 10)),
                dx: random(-3, 3), 
                c: color(random(100, 255), random(100), random(100)),
                fishExists: true,
                fishDead: false,
                show: showFish,
                move: moveFish,
                }
        return newFish;
}

function moveFish() {
    this.x += this.dx;
    if (sceneNum == 0) {
        // with no dam, fish change directions (off canvas)
        if(this.x > width + 20 || this.x < -20) {
            this.dx = -this.dx;
        }
    } else {
        // if fish is to the left of dam, disappears
        if(this.x < damX + 30) {
            this.fishExists = false;
        } // if fish is above water, dies
        else if(this.y < waterlevel2 + 5) {
            this.fishDead = true;
        }
        // if fish hits dam or goes off screen, change direction
        if(this.x > width + 20 || this.x <= damX + 33) {
            this.dx = -this.dx;
        }
    }
}

function showFish() {
    fill(this.c);
    ellipse(this.x, this.y, this.w, this.h);
    if(this.dx < 0) {  // facing left
        if(this.fishDead) {
            // if fish is dead, eyes make it appear belly-up
            fishEye(this.x - 3, this.y + 3, this.w / 4);
        } else {
            fishEye(this.x - 3, this.y - 3, this.w / 4, true);
        }
        triangle(this.x + this.w/3, this.y, 
                    this.x+this.w, this.y-5, 
                    this.x+this.w, this.y+5);
    } else {  // facing right
        if(this.fishDead) {
            // if fish is dead, eyes make it appear belly-up
            fishEye(this.x + 3, this.y + 3, this.w / 4);
        } else {
            fishEye(this.x + 3, this.y - 3, this.w / 4, true);           
        }
        triangle(this.x - this.w/3,this.y, 
                this.x-this.w, this.y-5, 
                this.x-this.w, this.y+5);
    }
    // if fish is dead, stay floating at water level
    if(this.fishDead) {
        this.y = waterlevel2;
        this.dx = 0;
    }
}

function fishEye(x, y, sz, alive) {
    push();
    fill(255);
    ellipse(x, y, sz, sz);
    if (alive) {
        fill(0);
        ellipse(x, y, 2, 2);
    }
    pop();
}

function water() {
    if(sceneNum == 0) { // initial river ripples using mountain function
        drawMountain(2, 0.005, 0.0005, waterlevel1+10, waterlevel1-10);
    }
    push();
    // water line shows gradient of water loss
    for(var i = 0; i < sceneNum; i++) {
        var alph = 10;     // alpha
        fill(0, alph);    // waterline
        rect(0, 240, width, height -240);
        alph += 3;
        translate(0, 10);
    }
    pop();
	fill(20, 50 + sceneNum * 6, 180 - sceneNum * 6);     // blue water
	if (sceneNum == 0) {
		rect(0, waterlevel1, width, height - waterlevel1);
	} else {
        if (factNum > 9) {   // fact 10 is about algae blooms
            fill(20, 100, 50);
        }
		// water left of dam
		rect(0, waterlevel1, damX, height - waterlevel1);
		// water right of dam
		rect(damX, waterlevel2, width - damX, height - waterlevel2);
	} 
}

function makeDam() {
	fill(180, 180, 150);
	if (sceneNum > 0) {
		beginShape();
		vertex(damX - 10, waterlevel1 - 20);
		vertex(damX + 5, waterlevel1 - 20);
		vertex(damX + 30, height);
		vertex(damX - 10, height);
		endShape();
	}
}

Mimi Ọnụọha – privacy and data

Us, Aggregated (2017)

Mimi Ọnụọha is a visual artist whose work critiques how tech companies’ unprecedented access to data has shaped the information we often blindly accept as complete and holistic. In Us, Aggregated, Ọnụọha takes her own family photos and reverse image-searches them, then compiles the resulting photos into a gallery. While we see image searches so commonly when even just looking through similar google images, Ọnụọha brings attention to the differences between the images and the diversity of people lumped together by an AI algorithm. She explores the power imbalances perpetuated by technology and seeks to de-normalize the “projected realities” we have been conditioned to perceive as natural. 

The Library of Missing Datasets (2016)

The Library of Missing Datasets is a physical repository (both in a file cabinet and on GitHub) that calls attention to the things we do not have quantified, but perhaps should in a world where so much is collected. Ọnụọha calls our attention to issues of the privacy of our information as well as the privacy of data that has either been not collected or intentionally hidden from the public.

gondola moment

sketch
// jaden luscher
// jluscher@andrew.cmu.edu
// section a
// project 11

// this program draws a gondola ascending a mountain
// populated by random cabins on a snowy slope

var hillheight = [];
var noiseParam = 0;
var noiseStep = 0.01;
var gondola;
var house = [];   // array of houses
var newhouseProbability = 0.01; // likelihood of a new house popping up per frame

function preload() {
    gondola = loadImage("https://i.imgur.com/H4WC448.png");
    // gondola drawn in illustrator
}

function setup() {
    createCanvas(400, 400);
    frameRate(20);
    noStroke();

    // set up hill data
    for (i = 0; i <= width; i++) {
        var n = noise(noiseParam);
        var value = map(n, 0, 1, 50, 250);
        hillheight.push(value);
        noiseParam += noiseStep;
    }

    // first house
    var onehouse = makehouse();
    house.push(onehouse);
}


function draw() {
    background("orange");
    drawMoon();

    movehill();
    drawhill();
    drawslope();

    for (var i = 0; i < house.length; i++) {
        movehouse(house[i]);
        showhouse(house[i]);
    }
    if (house.length > 0 & house[0].y - house[0].rh > height) {
        // delete off-screen houses
        house.shift();
    }
    if (newhouseProbability > random(1.0)) {  // make new house randomly
        var newhouse = makehouse();
        house.push(newhouse);
    }

    push();
    stroke(100);
    strokeWeight(2);
    line(0, 260, width, 40);
    image(gondola, 170, 130, 100, 150);
    pop();
}


function showhouse(h) {  // house x, y, width, height, roof height
    push();
    fill(200, 150, 100);
    rect(h.x, h.y, h.w, h.h);
    beginShape();
    vertex(h.x - 2, h.y);
    vertex(h.x + (h.w/2), h.y - h.rh); // roof peak
    vertex(h.x + h.w + 2, h.y);
    endShape();
    fill(230, 180, 120);
    rect(h.x + h.w / 2 - 4, h.y + h.h, 8, -15); // door
    pop();
}

function movehouse(h) {
    h.x += h.dx;
    h.y += h.dy;
}


function makehouse() {
    var house = {x : width + 1,
                y : random(120, 300),
                w : random(15, 50),
                h : random(15, 50),
                rh : random(5, 20),
                dx : -1,
                dy : 0.55,
                show : showhouse}
    return house;
}


function movehill() {
    hillheight.shift();   // creates scrolling effect
    var n = noise(noiseParam);
    var value = map(n, 0, 1, 50, 250);
    hillheight.push(value);
    noiseParam += noiseStep;
}

// background hills
function drawhill() {
    push();
    fill("lightblue")
    beginShape();
    for (var i = 0; i < width +1; i++) {
        var x = i;
        vertex(x, hillheight[i]);
    }
    vertex(width, height);
    vertex(0, height);
    endShape(CLOSE);
    pop();
}

// foreground white slope
function drawslope() {
    push();
    fill(250);
    beginShape();
    vertex(width, height);
    vertex(0, height);
    vertex(0, 370);
    vertex(width, 150);
    endShape();
    pop();
}

function drawMoon() {
    fill(250);
    ellipse(100, 80, 50, 50);
    fill("orange");
    ellipse(105, 80, 45, 45);
}

momol kuo – drink up fountain

Molmol Kuo is an artist and educator whose interests range from experimental film and AR to storytelling and collective memory. The Drink Up Fountain, created in partnership with creative agencies, is my favorite project she’s worked on. This is a public water fountain that spouts out entertaining prerecorded greetings and compliments when a water drinker sips from it (creating a circuit that is broken when the drinker pulls away). This goofy fountain brings so much joy to unsuspecting people in an otherwise fairly typical urban setting and creates collective memories shared by all that engage with the public fountain.

the drink up fountain – a compilation of people’s first reactions

This appreciation of joy, discovery, and sharing is found across Molmol’s work. During lockdown, she created “The Care Package”, a recipe of sorts that gave people a daily photography project that she would compile, overlay, and gift as a single print. One of her neon works combines the physical neon rods with an animated projection that seems to react to the physical rods like cars piling up on a road.

a still from Kuo’s neon work, 2021
student work from a workshop Kuo led at ITP/NYU

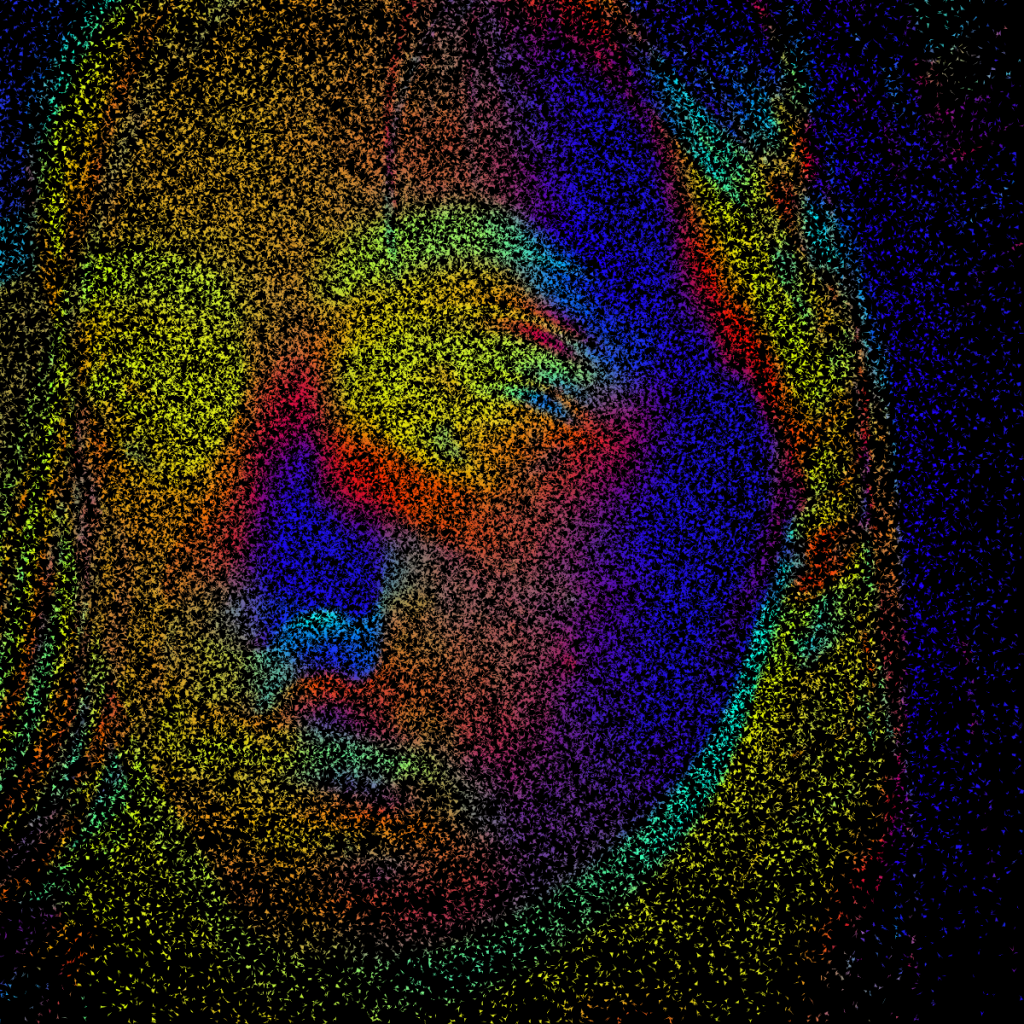
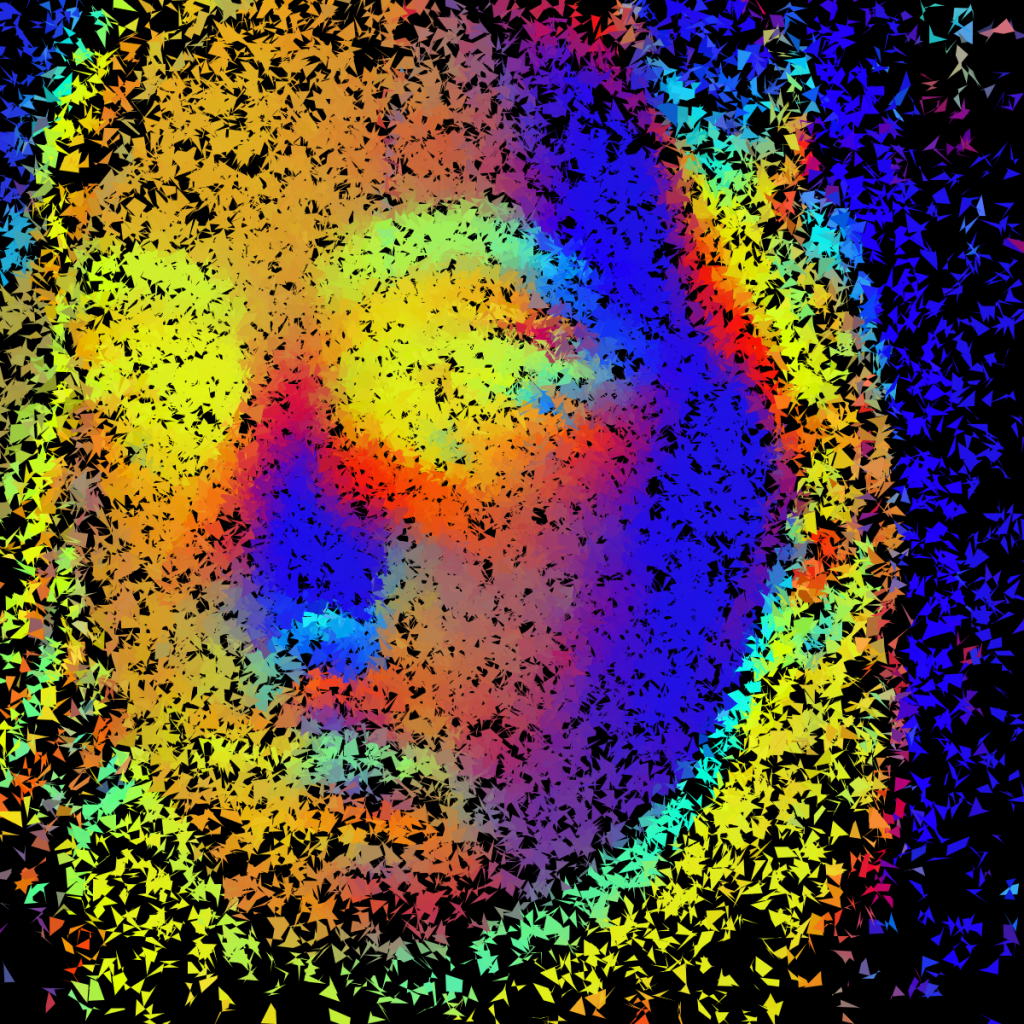
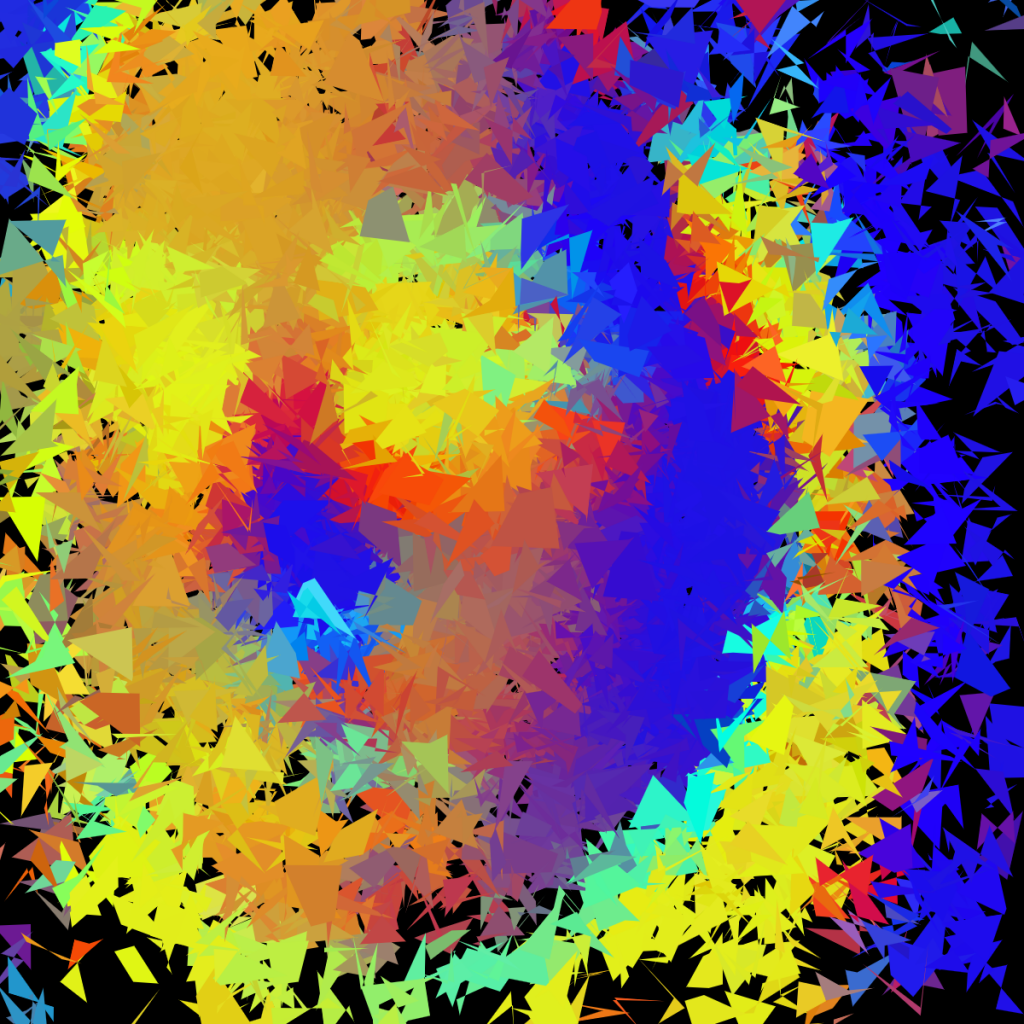
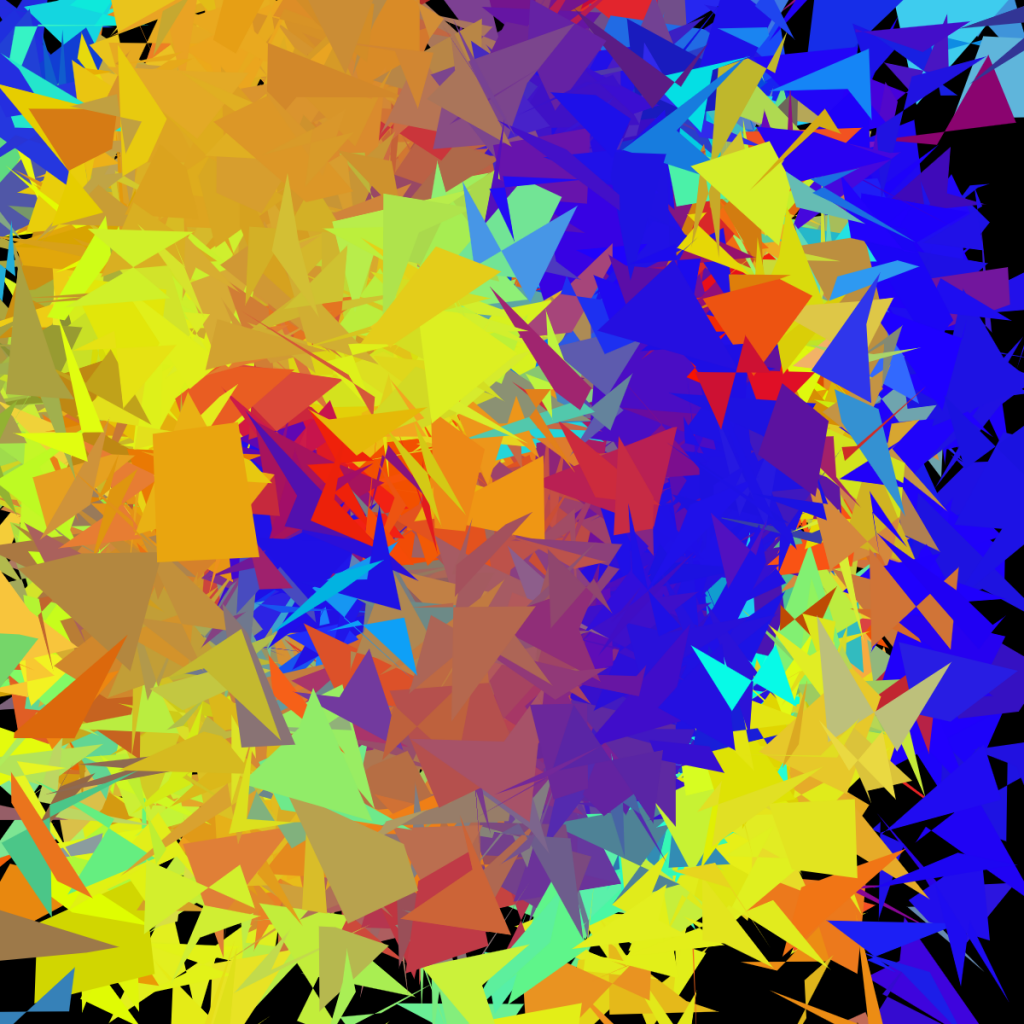
random quad portrait

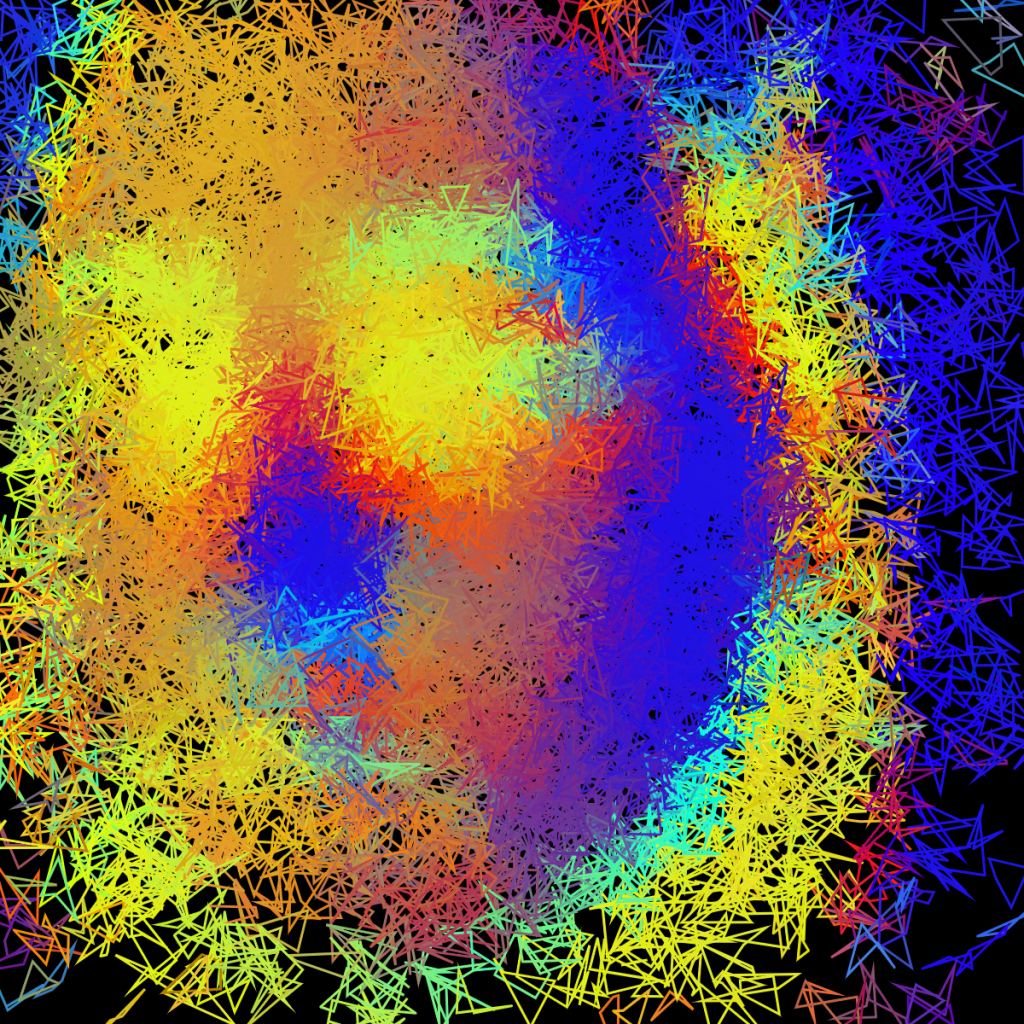
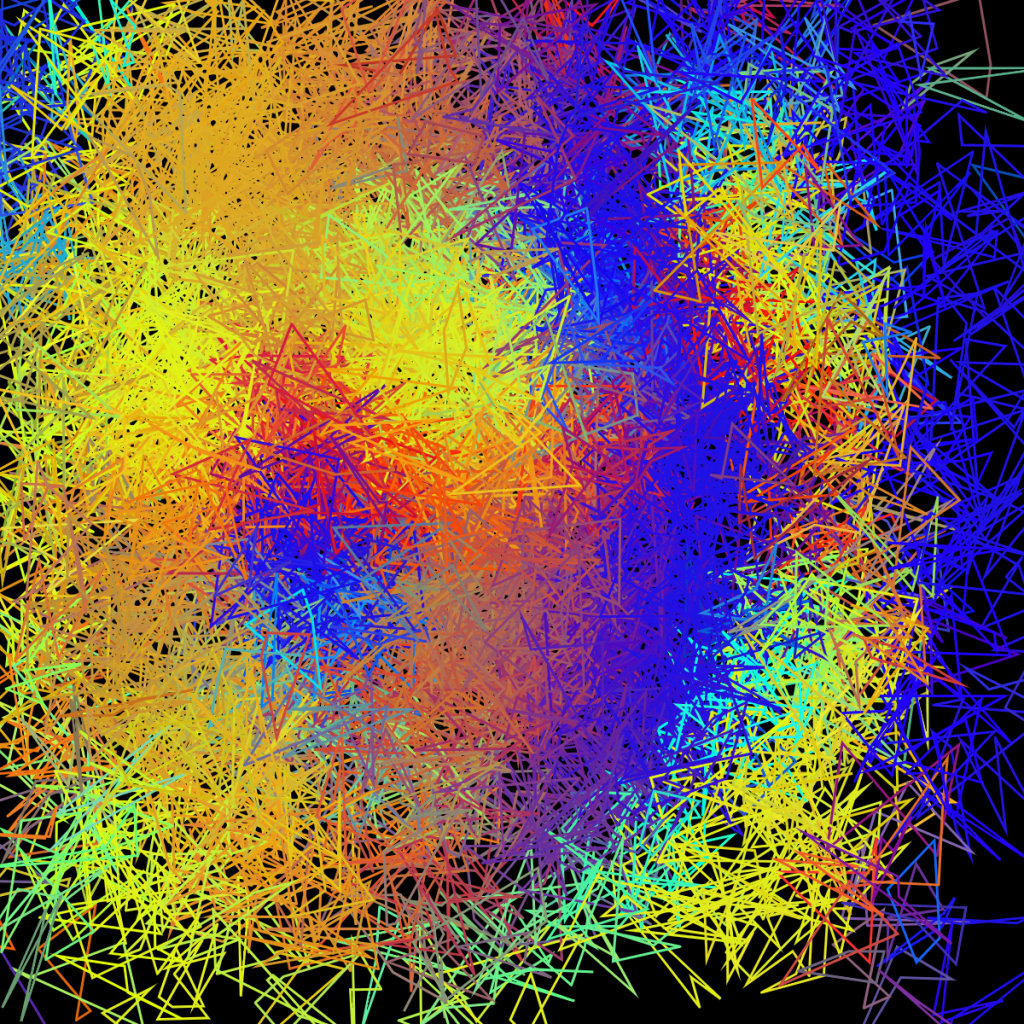
this sketch samples pixel colors and draws random quadrilaterals where the pixel was sampled from. mouseX controls the size of the shapes, while pressing the mouse will fill the shapes, rather than using the color as a stroke. press a key to erase the canvas.

below are some earlier variations in which I manually changed the size and fill/stroke boolean, and tested out density using a loop. (this version was not interactive).

sketch
// jaden luscher
// jluscher@andrew.cmu.edu
// section a
// project 09

// initially i had tried making a chuck close-style portrait with a pixel matrix,
// then i shifted to funky shapes instead. the ineraction was added at the end
// when i kept wanting to tweak the size and fill/stroke modes.

var jaden;    // original image
var x1;
var y1;
var dx = 0;   // noise step
var dy = 0;
var size;    // bounds of shape
var yesFill = false;

function preload() {
    jaden = loadImage("https://i.imgur.com/BRUtdb2.png")  // original portrait
}

function setup() {
    createCanvas(400, 400);
    background(0);
    frameRate(60);
    jaden.loadPixels();
}

function draw() {
    size = int(map(constrain(mouseX, 0, width), 0, width, 5, 50));
    if (mouseIsPressed) {   // toggle fill mode
        yesFill = true;
    } else {    // reset to line drawing mode
        yesFill = false;
    }
    if (keyIsPressed) {   // erase drawing
        background(0);
    }
    drawShape();
    print(yesFill);
}

function drawShape() {
    x1 = int(map(noise(dx), 0, 1, -150, width + 150));
    y1 = int(map(noise(dy), 0, 1, -150, height + 150));
    dx += random(0.1, 1.0);
    dy += random(0.1, 1.0);

    if (yesFill == true) {
        noStroke();
        fill(jaden.get(x1, y1));    // returns pixel from canvas
    } else if (yesFill == false) {
        strokeWeight(1);
        stroke(jaden.get(x1, y1));    // returns pixel from canvas
        noFill();
    }
    beginShape(QUADS);   // generate random polygons
    vertex(random(-1 * size, size) + x1, random(-1 * size, size) + y1);
    vertex(random(-1 * size, size) + x1, random(-1 * size, size) + y1);
    vertex(random(-1 * size, size) + x1, random(-1 * size, size) + y1);
    vertex(random(-1 * size, size) + x1, random(-1 * size, size) + y1);
    endShape();
}

Jake Barton – Local Projects

Jake Barton is the founder of Local Projects, a media and physical design firm which specializes in creating interactive experiences. He is interested in the process of learning and memory: namely, escaping from the typical classroom method of lecture and memorization. Instead, he argues that we learn with our hands. The tools we use don’t just aid us, they inform our learning and actions. How can we engage in storytelling? Can we travel through time? Who tells the story? For example, in the 9-11 museum (designed in part by Local Projects), visitors hear oral histories from a vast array of different people. Visitors can participate by recording their own stories and memories, which are added to the museum archive, then shared and synthesized, thus making the memories more powerful.

Jake Barton presents at Eyeo 2015

In presenting the projects, Jake Barton reviews the core intents of the experience, then demonstrates these in practice by showing clips of people interacting with and reacting to the installation. This solidifies the otherwise lofty goals as educational aims that are truly attainable through great interdisciplinary design and storytelling.

As a student of architecture, learning design, and history, the engaging work of Local Projects fascinates me. Individuals can be active participants both in history and in their own learning process, rather than being silent receptacles of segmented facts.

Local Projects’ work at Cooper Hewitt encourages visitors to become designers. I was lucky enough to visit and design my own “wallpapers” and play with the various interactive interfaces.

cabspotting SF

animation of realtime GPS data from taxis in San Francisco

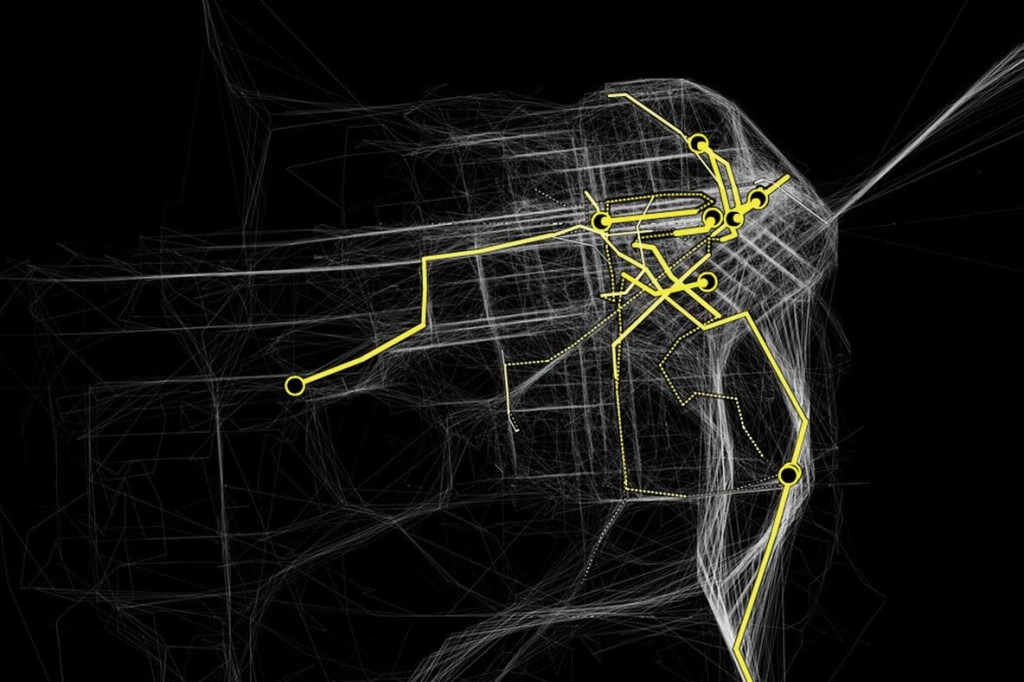
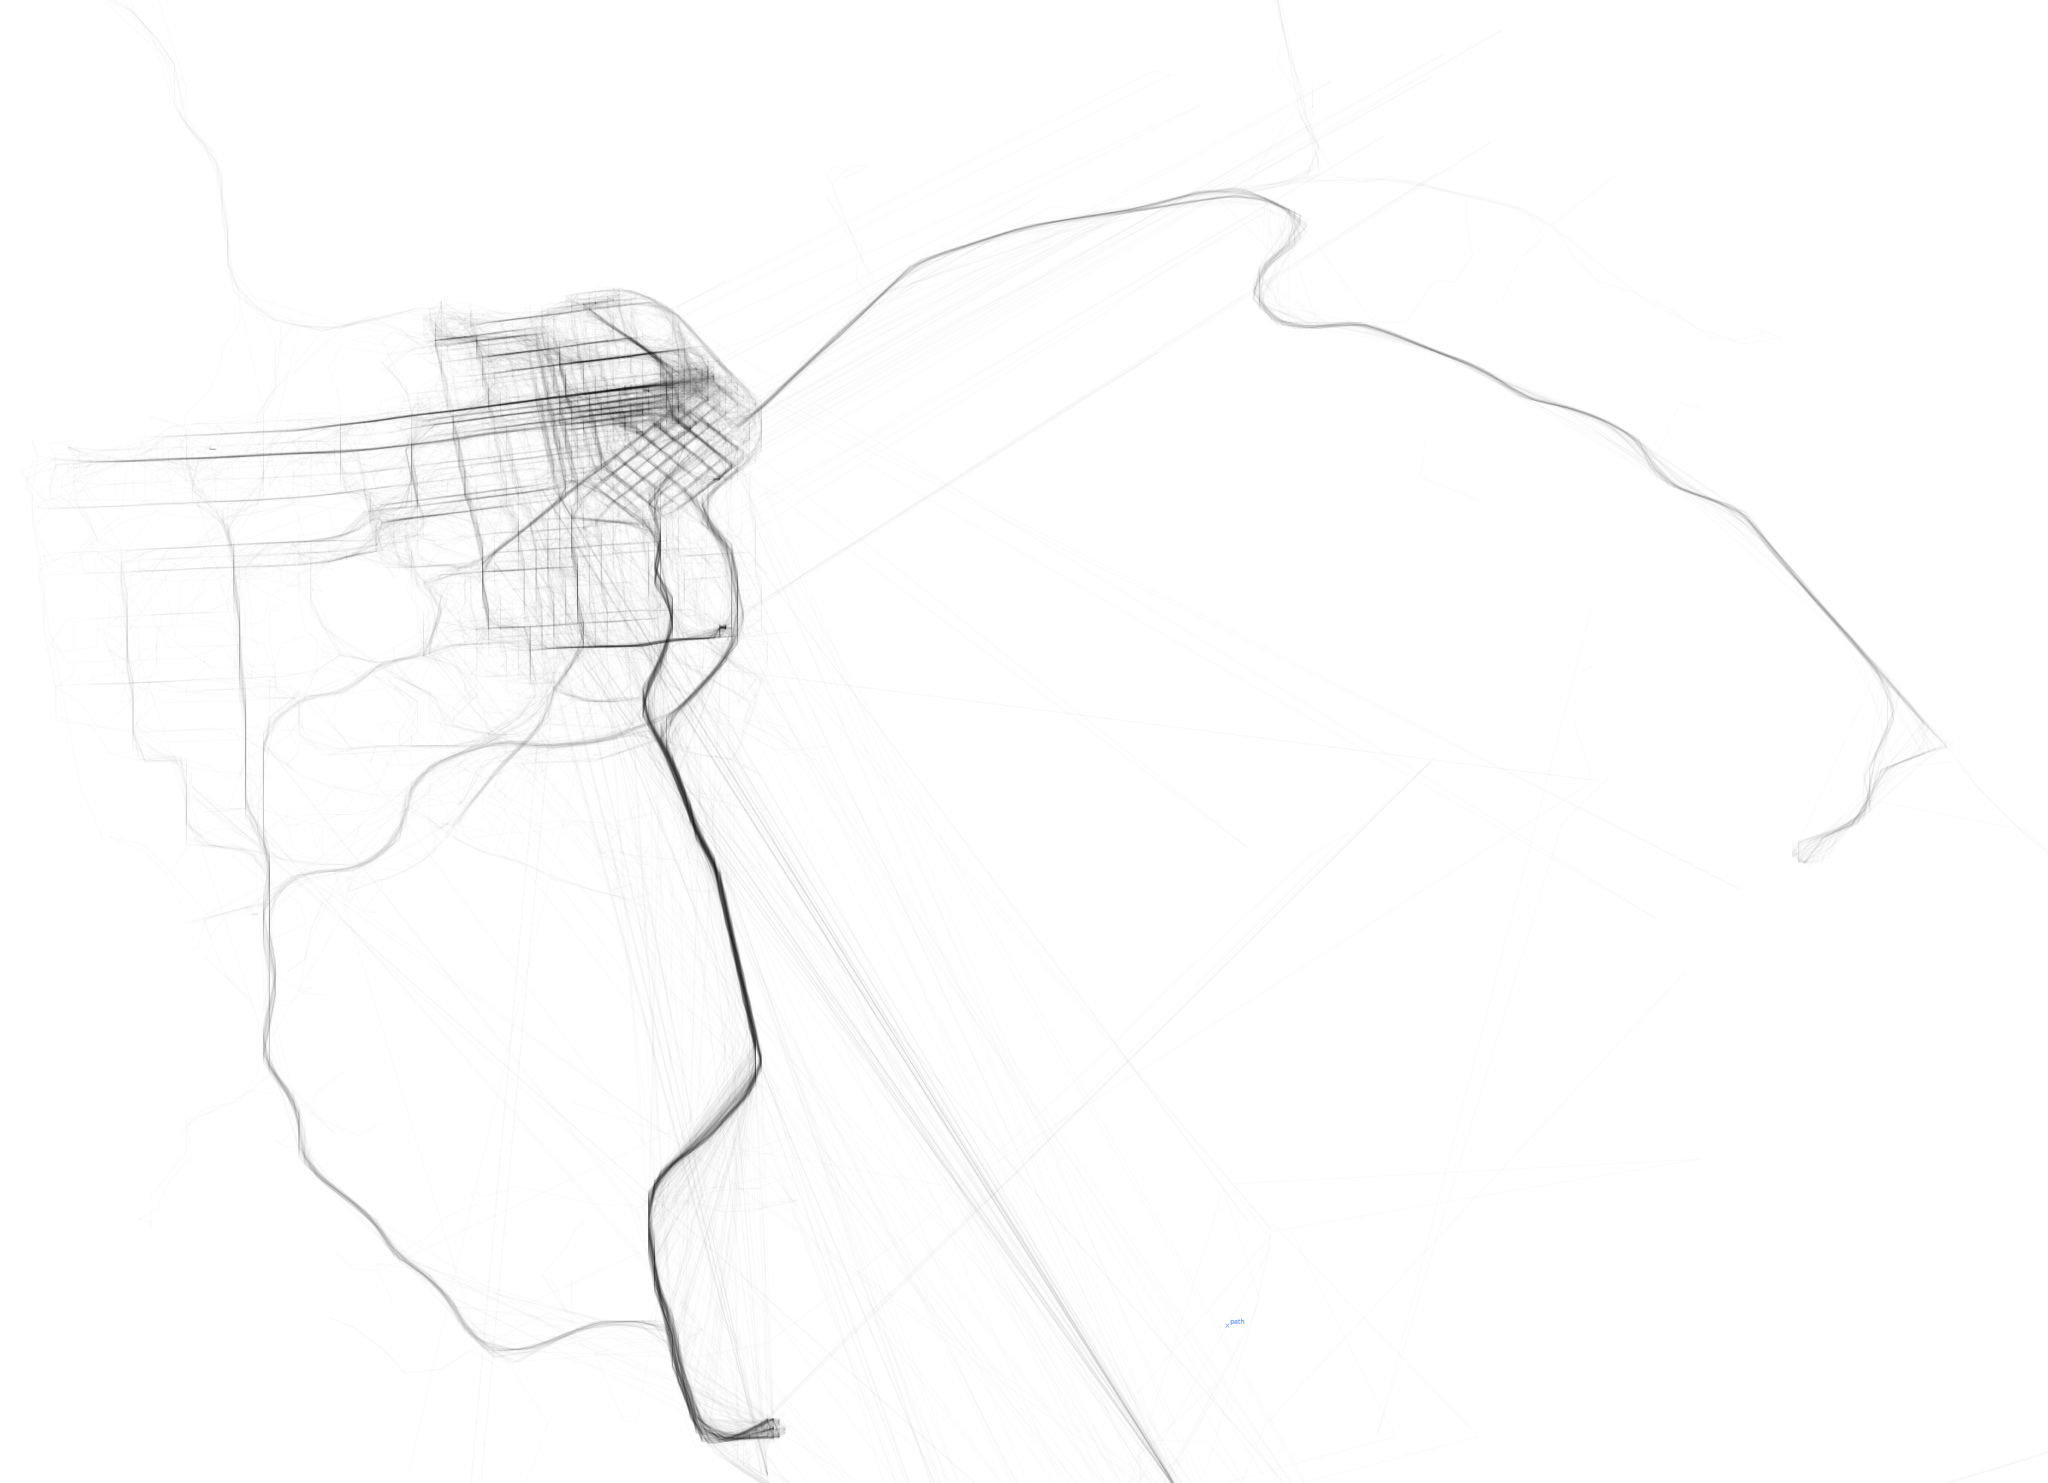
Cabspotting SF was created by Stamen Design for NYMoMA, originally as part of a research project called Invisible Dynamics (sponsored by the SF Exploratorium). This project was one of the first uses of realtime GPS data in data visualization. The movement of taxis is represented frame by frame as an array of semi-translucent yellow dots, which we can see intersect and densify in higher traffic areas. The concept is relatively simple, but the visualization is quite encapsulating (especially given that this project was done in 2008). The route of a single taxi can be singled out or compiled with the movement of all the other taxis at a given time and overlaid on a map that seems to glow. Stamen Design does many projects with a local focus, specializing in data visualization and cartography. They value aesthetics as well as thorough research, which is quite apparent in Cabspotting SF.

static map of taxi routes in San Francisco (2008)
compiled taxi movement

rose curve + augmented hypocycloid

mouseX rotates and changes the size of the hypocycloid (thicker lines, filled shape). mouseY corresponds with n, which essentially determines the complexity of the curves. it took me a while to finish this because I was having too much fun spacing out while playing with it…

sketch
// jaden luscher
// jluscher@andrew.cmu.edu
// section a
// project 07: composition with curves
// HYPOCYCLOID PEDAL CURVE + ROSE CURVE

// INITIALIZING VARIABLES
var nPoints = 250;
var n;
var a;
var q;

function setup() {
  createCanvas(400, 400);
  background(200);

  frameRate(30);

}

function draw() {
  background("orange");
  noFill();

  q = constrain((mouseX / width), 0.1, 1.0);
  p = constrain((mouseY / height), 0.1, 1.0);
  n = int(p * 100);   // n corresponds to the curves' complexity
  a = int(width * p * 10);    // "radius" of rose curve increades with mouseY
  var c = 155 + (q * 100);  // fill color for hypocycloid

  translate (width/2, height/2);
  strokeWeight(q *20);    // stroke of hypocycloid corresponds to mouseX
  stroke("white");
  fill(c, 0, c, 5);
  for (i = 0; i < nPoints/10; i++) {
    drawHypocycloid();
    a = a *sqrt(q) - width*q;   // sqaure root causes many curve sizes to "cross"
  }
  a = int(width * p * 10);    // "radius" of rose curve increades with mouseY
  stroke("white");
  strokeWeight(0.5);
  rotate(PI * q);   // rose curve spins with mouseX
  drawRoseCurve();
}


function drawHypocycloid() {
  // hypocycloid pedal curve:
  // https://mathworld.wolfram.com/HypocycloidPedalCurve.html
  push();

  var x;
  var y;
  var r;

  beginShape();
  for (var i = 0; i < nPoints; i++) {
    var t = map(i, 0, nPoints, 0, TWO_PI);// sweep theta from 0 to two pi

    // hypocycloid:
    r = q * (n-2) * ((sin * (n / (n-2))) * (t + PI/2));

    x = a * (((n-1) * cos(t) + cos((n-1) * t)) / n);
    y = a * (((n-1) * sin(t) + sin((n-1) * t)) / n);
    vertex(x, y);
  }
  endShape(CLOSE);
  pop();
}


function drawRoseCurve() {
  // rose curve
  // https://mathworld.wolfram.com/RoseCurve.html

  push();
  var x;
  var y;
  var r;

  beginShape();
  for (var i = 0; i < nPoints; i++) {
    var t = map(i, 0, nPoints, 0, TWO_PI);// sweep theta from 0 to two pi
    r = a * p  * cos(n * t);

// pasted from hypercycloid
    x = r * cos(t);
    y = r * sin(t);
    vertex(x, y);
  }
  endShape(CLOSE);
  pop();

}

anders hoff’s recursion

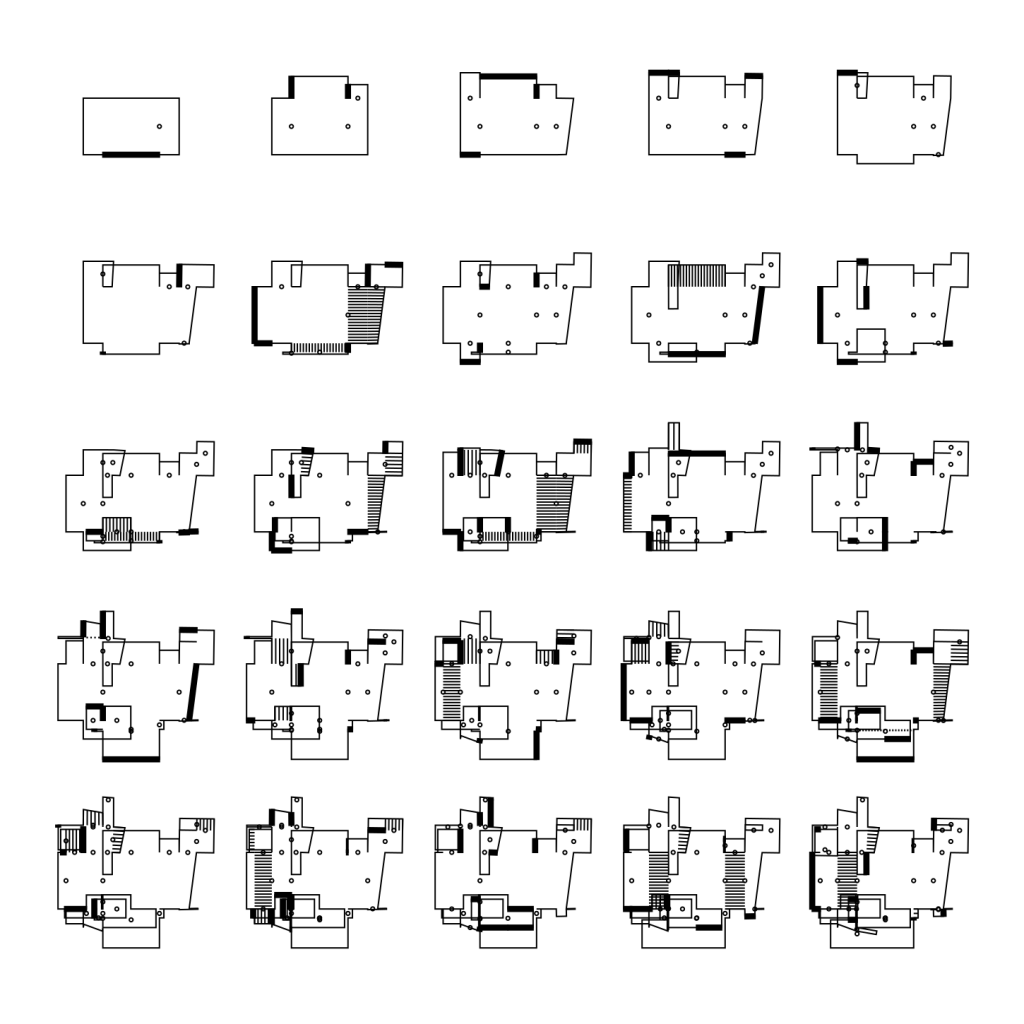
Anders Hoff’s “Impossible Architecture” (2018) is an experiment in morphing a 2D, outline of a rectangle to create a completely random “floor plan”. These insane-looking pseudo-floor plans are mostly impossible to construct, but as we look at them we attempt to make sense of them. They look convincing, with the addition of more randomly generated elements – circles, line arrays, and thick lines that we perceive as columns, stairs, and thickened walls, respectively. 

He explains this recursive process on his website: a randomly selected segment of a line is extruded to a random distance, which essentially adds 3 line segments to the outline. The selected line segment is then deleted, and the process repeats. This recursion speaks for Hoff’s principles of creating “interesting and complex behavior” from systems with simple rules. He takes inspiration from nature, geometry, writing systems, and – as is obvious from this experiment – architecture.

egg time(r)

hours = yolks in the pan. minutes = rotation of pan. month = eggs in carton. this one hurt my brain the most so far!

sketch

// jaden luscher
// jluscher@andrew.cmu.edu
// section a
// project-06: abstract clock
// EGG CLOCK
// the egg clock counts hours as eggs cracked in the pan,
// months as eggs in the carton, and minutes as the rotation of the pan.

// INITIATING VARIABLES
var xYolk = 0;    // first yolk starts north-facing
var yYolk = 40;   // distance between yolk and center of pan
var hr;
var mo;

function setup() {
  createCanvas(400, 300);
  noStroke();
  angleMode(DEGREES);
  frameRate(10);
}

function draw() {
  background(240);
  translate(150, 150);  // center of pan

  hr = hour() % 12; // convert 24 hour clock to 12
  mo = month();

  stovetop();

  // EGG WHITE
  fill(255);
  ellipse(0, 0, randomGaussian(110,1));

  // EGG YOLK
  push();
  for (var i = 0; i <= hr; i++) {
    eggYolk(xYolk, yYolk);
    rotate(360 / hr);
  }
  pop();

  // EGG CARTON
  eggcarton();
  monthcounter();
}

function stovetop() {
  // SHADOWS
  push();
  fill(220);
  rect(90, 90, -15, -240);
  rect(-90, 90, -15, -240);
  rect(90, 90, -240, -15);
  // GRATES
  noFill();
  strokeWeight(4);
  stroke(120);
  line(-150, 90, 90, 90);
  line(-150, 0, 90, 0);
  line(-150, -90, 90, -90);
  line(90, 90, 90, -150);
  line(0, 90, 0, -150);
  line(-90, 90, -90, -150);
  pop();
  // PAN
  push();
  fill(150);    // grey for pan
  rotate(minute()*6);
  minutecounter();
  ellipse(0, 0, 140);   // pan outer circle
  fill(120);
  ellipse(0, 0, 130);    // pan inner circle
  pop();
}

function eggYolk(xYolk, yYolk) {
  fill(255, 180, 0);
  ellipse(xYolk + noise(-1, 1), yYolk + noise(-1, 1), random (18, 20));
}

// PAN HANDLE ROTATES 360 DEGREES BY THE HOUR
function minutecounter() {
  push();
  fill(220, 20, 20);
  rect(-8, -80, 16, -50);
  ellipse(0, -130, 16);
  pop();
  rect(-6, 0, 12, -80);
}

function eggcarton() {
  push();
  fill(240, 230, 210);  // light grey
  rect(145, -95, 70, 190);
  fill(220, 220, 210);  // darker grey
  rect(215, -95, 35, 190);
  translate(165, -75);
  var x = 0;
  var y = 0;

  // EMPTY EGG CARTON (GREY DOTS)
  for (var j = 0; j < 2; j++) {
    for (var i = 0; i < 6; i++) {
      ellipse(x, y, 28);
      y += 30;
    }
    y = 0;
    x += 30;
  }
  pop();
}

function monthcounter() {
  push();
  translate(165, -75);
  fill(255);
  var x = 0;
  var y = 0;
  // EGGS FOR JANUARY TO JUNE
  for (var j = 0; j < constrain(mo, 0, 6); j++) {
    ellipse(x, y, 22);
    y += 30;
  }
  // EGGS FOR MONTHS JULY TO DECEMBER
  y = 0;
  x += 30;
  for (var j = 6; j < mo; j++) {
    ellipse(x, y, 22);
    y += 30;
  }
  pop();
}