![[OLD SEMESTER] 15-104 • Introduction to Computing for Creative Practice](wp-content/uploads/2023/09/stop-banner.png)
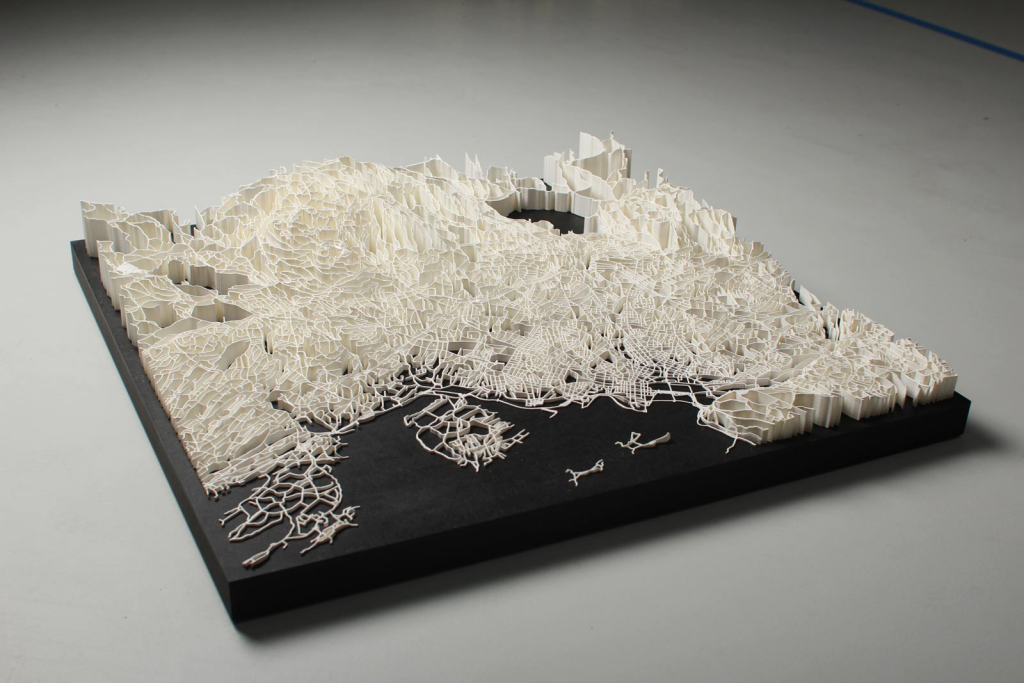
While looking through the provided resources, one project that really caught my eye was Intersections by Even Westvang and Simen Svale Skogsrud. They looked at data of Norway pertaining to how people travel and live throughout the region and turned it into 3D elevation maps. I take great interest in data visualization and I think cross referencing data to make a 3D model is very very interesting, especially when the visual is representative of the data like it is here being the shape of the region surveyed. Since they were just working with raw data I’m sure the computational side wasn’t too hard. They probably just had to clean and aggregate the data to fit their desired outcome! I think the artistry is in the medium choice: 3D printing what could be a graph with 2 axes is a very compelling way to show arial data like the city information they were looking at. The tangibility of it works to emphasize the comparisons they sought out to make.
More information here.