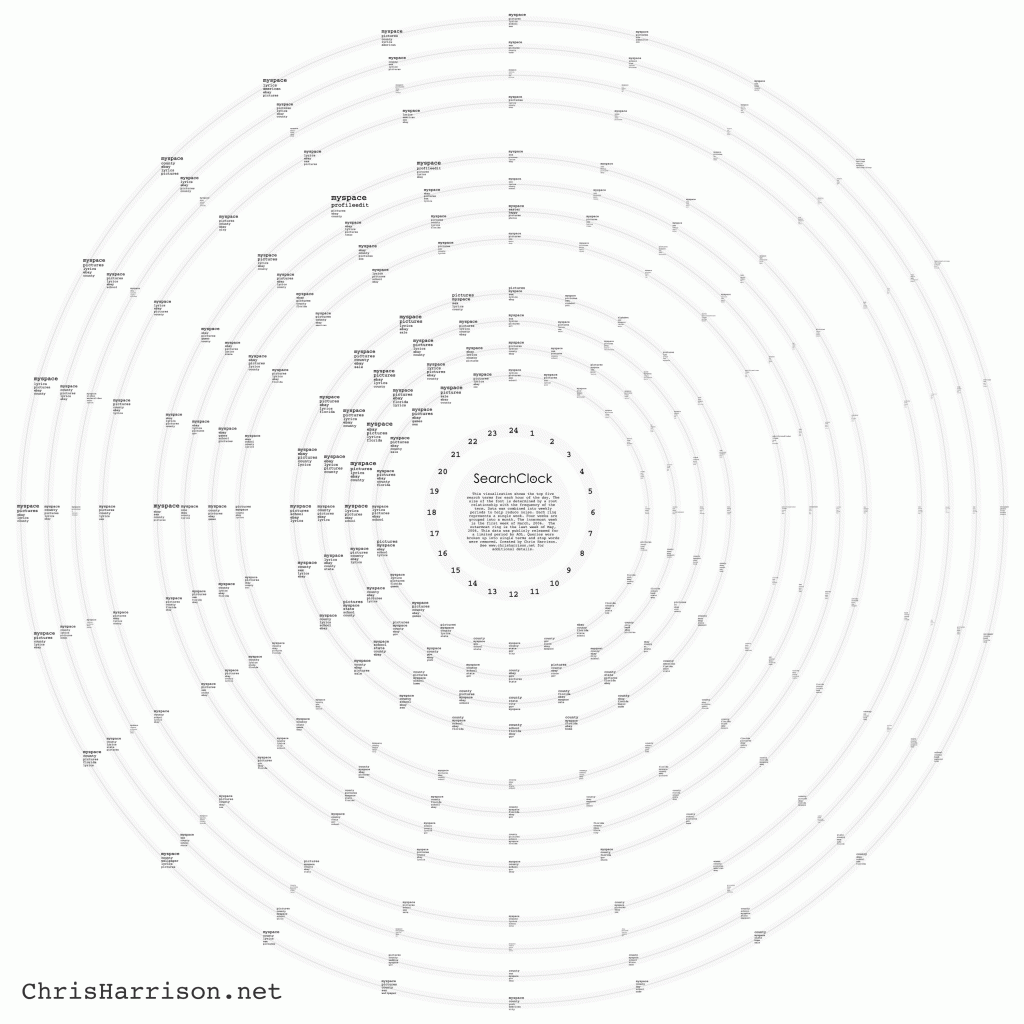
This week I looked at CMU alum Chris Harrison’s project Search Clock. He created an algorithm that mapped what people use the internet for the most during every hour of the day. This stood out to me because we just made clock looking devices with code, this is just way cooler. I also have just spent the semester in an intense mapping class and am impressed by his visual simplification and efficiency in descriving multiple changing factors so consicely. He somehow found hourly data on average time spent on certain websites and generalized them into catagories, and converted the scale to years. I think it’s super visually stunning and am impressed with how innovative this representation of data is.
https://www.chrisharrison.net/index.php/Visualizations/SearchClock
![[OLD SEMESTER] 15-104 • Introduction to Computing for Creative Practice](wp-content/uploads/2023/09/stop-banner.png)