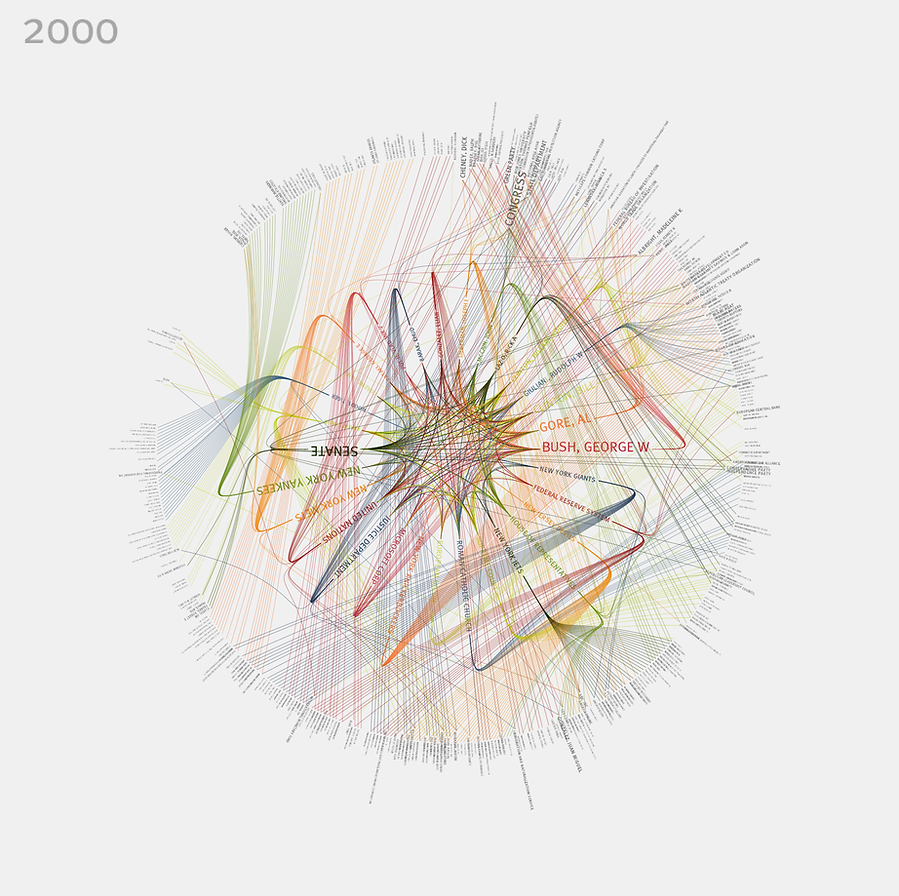
The work I selected is 365/360 by Jer Thorp . The work is a visualization that shows the top organizations and personalities every year from 1985 to 2001. The work was created for the New York Times and links people, organizations and events. I selected this work because I was interested in the way Thorp used color and font size as a form of connection in addition to simply lines of connection. This makes the representation of data feel quite dynamic and life like. The piece of work is also circular which shows just how interconnected seemingly different topics are. The work also gives us a sense of Thorp’s sensibilities when it comes to representation and color and font use.

![[OLD SEMESTER] 15-104 • Introduction to Computing for Creative Practice](wp-content/uploads/2023/09/stop-banner.png)