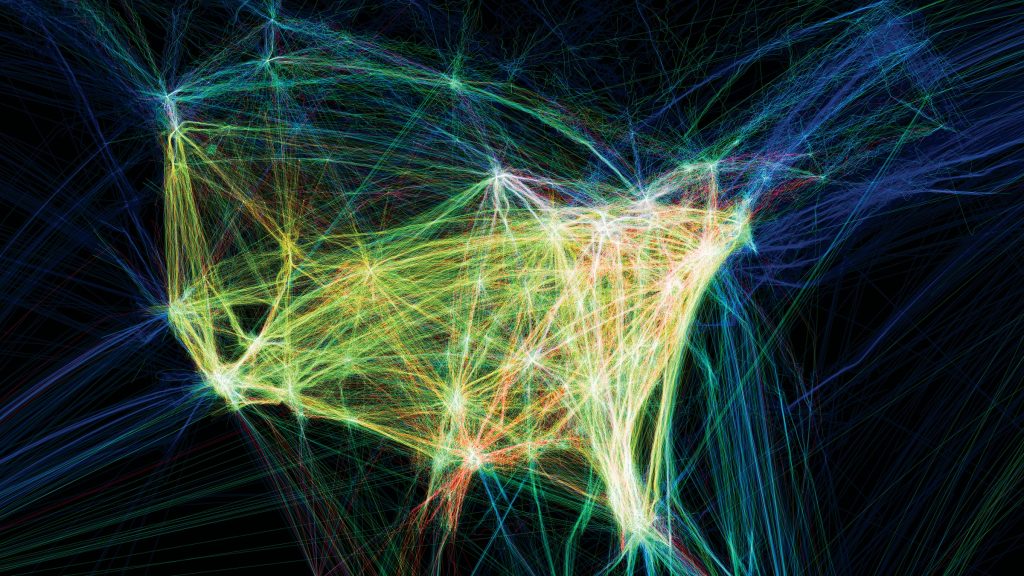
I looked at the project about Flight Patterns that represent visual information. This project plots flight patterns throughout the US visually using colors and lines. It was created as an experimental project for “Celestial Mechanics” by Scott Hessles and Gabriel Dunne at UCLA. I find this visual data intriguing because flight patterns are not something explicitly visual so it’s interesting to see what areas and cities have the most air traffic which is visually represented in this project as varying colors of lines with lighter lines as more trafficked areas. when zooming into a specific city the data is detailed enough to see the specific flight patterns within the city itself. The algorithm was developed with data that is processed through the Processing program which plots out the lines visually.
website link


![[OLD SEMESTER] 15-104 • Introduction to Computing for Creative Practice](wp-content/uploads/2023/09/stop-banner.png)