![[OLD – FALL 2016] 15-104 • COMPUTING for CREATIVE PRACTICE](https://courses.ideate.cmu.edu/15-104/f2016/wp-content/uploads/2020/08/stop-banner.png)
Nicholas Feltron Personal Annual Report
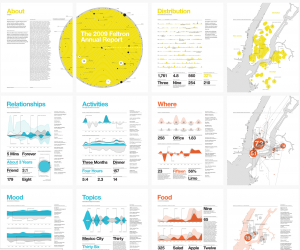
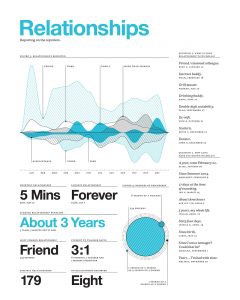
I found Nicholas Feltron’s data visualization brilliant and kind of really funny. He gathers rather random everyday data for an entire year and creates a personal annual data report. The particular one I chose to show was his 2009 annual report about his Relationships with people. From parents to old friends to new acquaintances, everyone who had a “significant” encounter with Nicholas in 2009 received an invitation to contribute to that year’s Annual Report.
I thought the subject of this data visualization was entertaining, and pretty clear enough to read. He chose to graph the data using wave like forms to detail his encounters. He states that used Processing to help his visualize his data and some other programs. I appreciate his adventure out of the standard bar graph to display an entertaining and visually pleasing spread.
Source: feltron.com