![[OLD – FALL 2016] 15-104 • COMPUTING for CREATIVE PRACTICE](https://courses.ideate.cmu.edu/15-104/f2016/wp-content/uploads/2020/08/stop-banner.png)
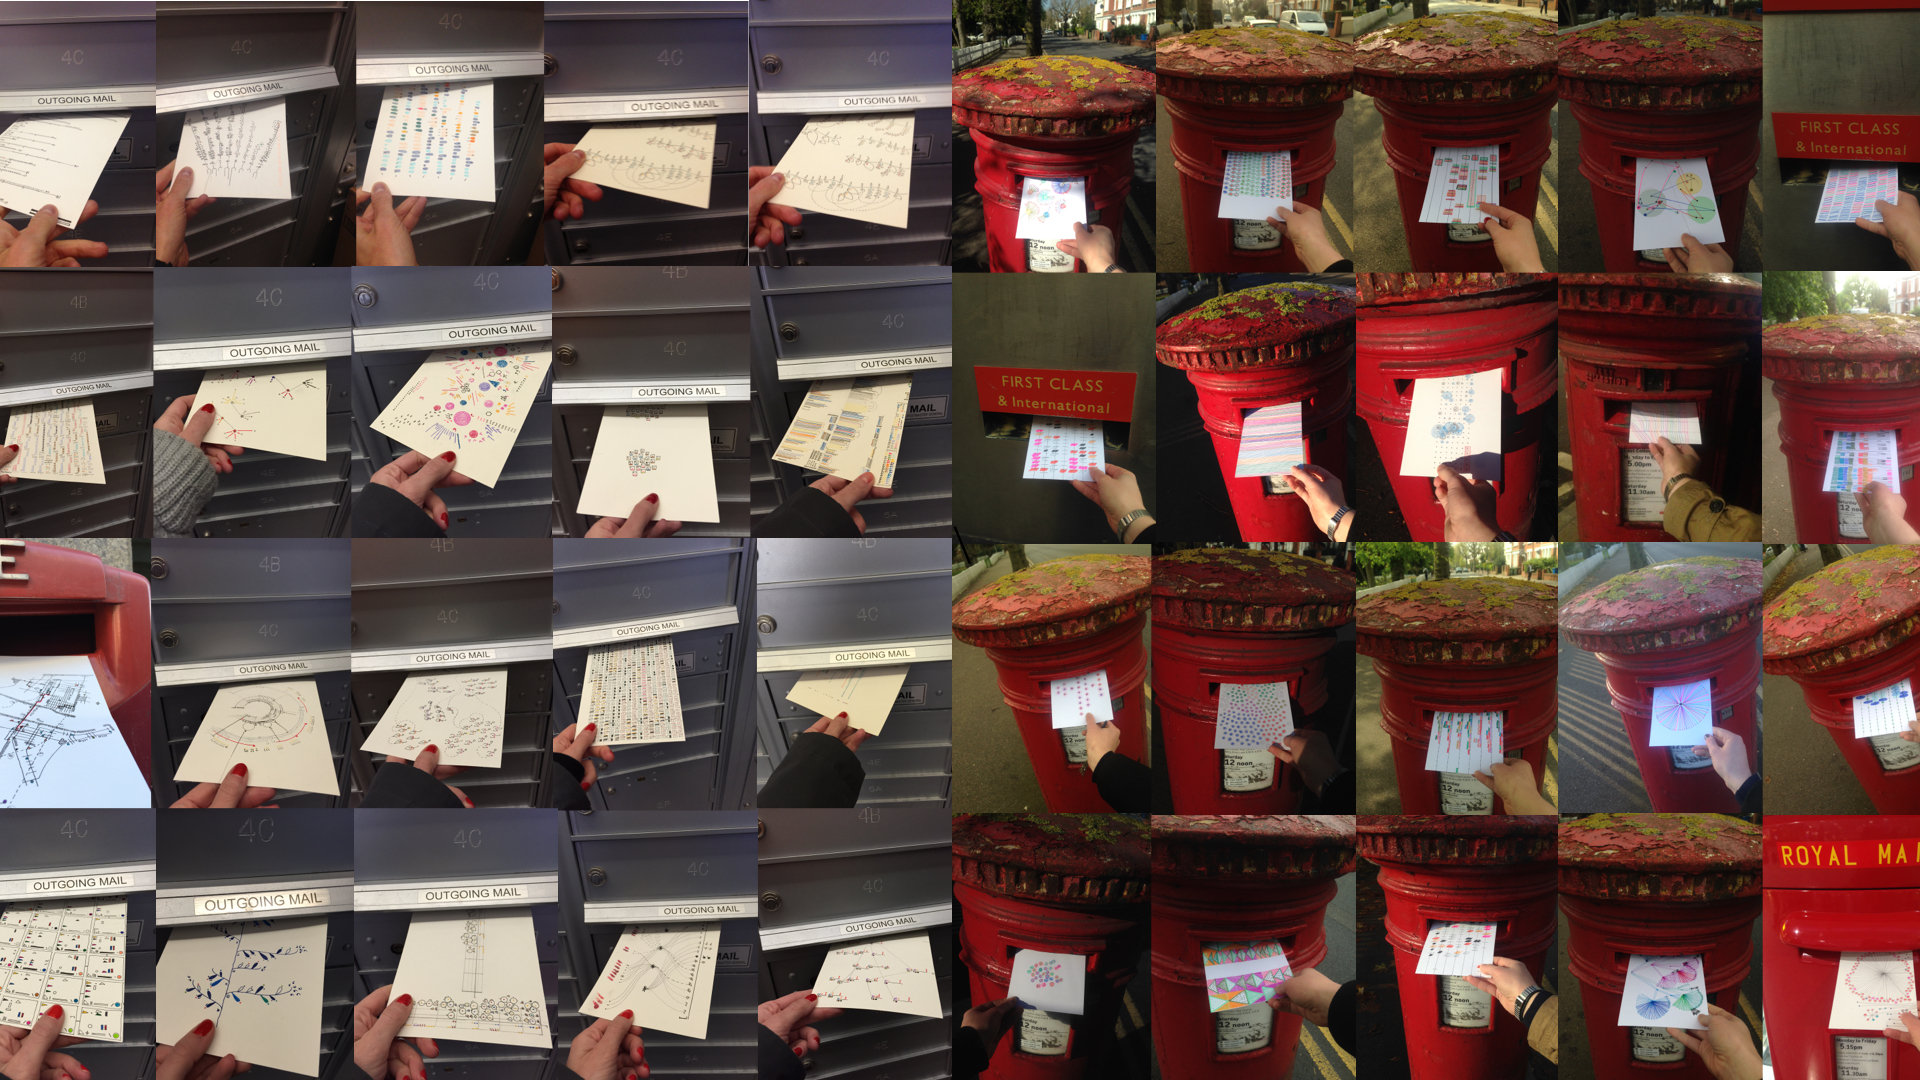
I watch the Dear Data lecture from Giorgia Lupi & Stefanie Posavec. Both Giorgia and Stefanie are information designers but work and live on either side of the Atlantic. After meeting at EYEO, they decided to collaborate on a personalized data visualization project. They decided to take advantage of the distance and every week they chose a data point to track. They would independently choose a way to track that point and how to represent that point, leading in drastically different but sometimes surprisingly similar. All the letters were hand crafted and drawn, consuming much more time, but resulting in a much more personalized data visualization that ultimately lead to the two getting to know each other quite intimately despite only meeting in person on four occasions.
This project is absolutely fantastic. Data visualization is so strong on its own and I wouldn’t expect an analog approach to be beneficial. However, the exchange they had was surprisingly compelling. I admire the amount of effort to track data, compile it, and keep up for a year. The parallel methods they used were fairly interesting, especially when they diverged drastically.
One thing that I am curious about is how they were able to generate data points accurately and how to come up with topics each week. This is mainly because I am just surprised by how they were able to pull off such an impressive project. And the imperfection of this data visualization exchange is really what makes this such a compelling project.