Diana Connolly – Project 7

sketch

var nPoints = 100;
var x;
var y;


function setup() {
    createCanvas(680, 620);
}


function draw() {
    background(106,187,244); //blue background
    peach(60, 190, 100); //top left peach
    peach(80, width-200, 100); //top right peach
    peach(90, 200, height-270); //bottom left peach
    peach(70, width-190, height-240); //bottom right peach
}

//a general function that will draw a peach with given variables
function peach(a, shiftX, shiftY) {
    push();
    translate(shiftX, shiftY);
    rotate(radians(270));
    var a;
    var b = a / 2;
    var h = constrain(mouseY/8, 0, b);
    var ph = mouseX/50; 
    beginShape();
    for (var i = 0; i < nPoints; i++) {
        var t = map(i, 0, nPoints, 0, TWO_PI); 
        x = a * cos(t) * (1-cos(t)) - h * cos(ph + t * a);
        y = a * sin(t) * (1-cos(t)) - h * sin(ph + t * a);
        fill(244,148,106);
        vertex(x, y);
    }
    endShape(CLOSE);
    pop();
}

For this project, I made a bunch of “peaches” that start off looking like normal peaches while your mouse is at the top of the canvas. Once your mouse goes down the canvas, the edges of each of the peaches creates a new shape. Moving your mouse left or right changes the rotation of those edge shapes. The original curve that I found on the MathWorld website was called a “Cardioid”. I rotated it 270˚ in order to look more like a peach. Then while playing around with the values set in my curve equation, I found that I could create different-looking edge shapes, like how the top left curve’s edges seem to make star shapes, and the bottom left curve’s edges create more of a loop shape.

I started off with the peach shape:
screen-shot-2016-10-14-at-7-07-56-pm

I then played around with making edge shapes that grow and rotate based on mouse location:
screen-shot-2016-10-14-at-7-08-16-pm
screen-shot-2016-10-14-at-7-08-02-pm

And then changed the colors and created a grid of varying peaches, with varying edge shapes!
screen-shot-2016-10-14-at-7-11-05-pm

Diana Connolly – Looking Outwards 7

1-art-of-%cf%80

Flow Of Life Flow Of Pi, by Cristian Ilies Vasile

Flow Of Life Flow Of Pi is a digital artwork piece by artist Cristian Ilies Vasile. Vasile created this piece using the software called Circos, a circular visualization software. The piece visualizes a dataset by using an information graphic to represent the first 10,000 digits of pi. Each digit of pi is connected by a string to the following digit of pi. The numbers 0-9 represent all possible numbers that could occur within each digit, and thus are represented around the circumference of the circle and are given their own color in the infographic. When a line goes from one number to another, the fill color of the line goes from from the first number’s assigned color to the second number’s assigned color. I admire this piece because I think it is a beautiful way to visualize the complexity of pi. I am an illustrator myself and often think about ways to best represent an object or idea, and I appreciate the simplicity of the final image and how it represents such a vast number of digits all at once. The algorithm used to generate the work involved the Circos software which took in all of the 10,000 digits of pi and connected the digits with lines. The creator’s artistic sensibilities are manifested in the final form because the artist wanted to represent the vast number of pi’s digits in a simple yet beautiful way. I think that he succeeded in doing that, as the viewer is able to see the visualization of the patterns in pi’s digits as the individual lines between digits constructs its own web of connections.

Below is a link to an article written about this piece, as well as a few others of Vasile’s works:
https://www.visualnews.com/2013/07/09/the-art-of-pi-a-colorful-data-visualization/

Diana Connolly – Project 6

lunar

var x = 0;
var cloudX = 0;

function setup() {
    createCanvas(600, 350);
}

function draw() {
    noStroke();
    if (hour() >= 12) { //makes background go from dark blue to orange every other half cycle
        var colors1 = nigth2day();
        background(colors1[0], colors1[1], colors1[2]);
    } else if (hour() < 12) { //makes background go from orange to dark blue every other half cycle
        var colors2 = day2night();
        background(colors2[0], colors2[1], colors2[2]);
    }
    theSun(); //calls sun function
    theMoon(); //calls moon function
    ground(); //calls ground function
    mountains(); //calls mountain function
    shootingStar();
    cloud();
}


//SHAPES:
function theSun() {
    push();
    translate(width/2, height);
    rotate(radians(hour()*15)); //rotates sun from 180˚ starting point, in a full circle every day
    fill("yellow");
    ellipse(0, height-50, 60,60); //sun rotates in a circle of diam=height-50
    pop();
}

function theMoon() {
    push();
    translate(width/2, height);
    rotate(radians(180+hour()*15)); //rotates moon from 0˚ starting point, in a full circle every day
    fill("lightBlue");
    ellipse(0, height-50, 60,60); //moon rotates in a circle of diam=height-50
    pop();
}

function shootingStar() {
    push();
    frameRate(width);
    if (second() <= 60) { //makes the shooting star go across screen per second
        x = x+10;
    }
    if (x>=width) { //makes shooting star start over again
        x = 0;
    }
    fill(255);
    ellipse(x, 30, 10,10);
    pop();

}

function cloud() {
    push();
    frameRate(width);
    if (minute() <= 60) { //makes cloud go across screen per minute
        cloudX = cloudX+(10/60);
    }
    if (cloudX>=width) { //makes cloud start over again
        cloudX = 0;
    }
    fill(255, 80);
    ellipse(cloudX-15, 110, 50,20);
    ellipse(cloudX, 100, 30,20);
    ellipse(cloudX+25, 107, 40,25);
    ellipse(cloudX+35, 115, 30,20);
    ellipse(cloudX+45, 110, 40,20);
    ellipse(cloudX, 110, 40,20);
    pop();

}

function ground() {
    if (hour() >= 12) { //makes ground go from purple to pink every other half cycle
        var colors3 = purple2pink();
        fill(colors3[0], colors3[1], colors3[2]);
    } else if (hour() < 12) { //makes ground go from pink to purple every other half cycle
        var colors4 = pink2purple();
        fill(colors4[0], colors4[1], colors4[2]);
    }
    rect(0, height/2 + 72, width, height/3);
}

function mountains() {
    //Middle mountain
    beginShape();
    fill(150);
    vertex(50, height/2+100);
    vertex(240, 130);
    vertex(width-60, height/2+100);
    endShape(CLOSE);

    //Right mountain
    beginShape();
    fill(225);
    vertex(width, height/2+35);
    vertex(width-30, height/2+10);
    vertex(width-50, height/2+20);
    vertex(width-88, 130);
    vertex(width-125, 170);
    vertex(width-140, 160);
    vertex(width/2-70, height-65);
    vertex(width, height-65);
    endShape(CLOSE);

    //Left mountain
    beginShape();
    fill(0);
    vertex(0, height/2+70);
    vertex(80, height/2);
    vertex(95, height/2+10);
    vertex(120, height/2-10);
    vertex(width/2+50, height-40);
    vertex(0, height-40);
    endShape(CLOSE);
}


//FILLS:
function nigth2day() { //dark blue to orange color gradient
    var colR1 = map(hour(), 0,12, 243, 44);
    var colG1 = map(hour(), 0,12, 135, 17);
    var colB1 = map(hour(), 0,12, 107,106);
    return [colR1, colG1, colB1];
}

function day2night() { //orange to dark blue color gradient
    var colR2 = map(hour(), 12,24, 44, 243);
    var colG2 = map(hour(), 12,24, 17, 135);
    var colB2 = map(hour(), 12,24, 106, 107);
    return [colR2, colG2, colB2];
}

function purple2pink() { //purple to pink color gradient
    var colR3 = map(hour(), 0,12, 192, 46);
    var colG3 = map(hour(), 0,12, 82, 73);
    var colB3 = map(hour(), 0,12, 105, 104);
    return [colR3, colG3, colB3];
}

function pink2purple() { //pink to purple color gradient
    var colR4 = map(hour(), 12,24, 46, 192);
    var colG4 = map(hour(), 12,24, 73, 82);
    var colB4 = map(hour(), 12,24, 104, 105);
    return [colR4, colG4, colB4];
}

For this week’s project, I wanted to create my abstract clock incorporating the moon and the sun. I wanted to use the time of day to correspond with having either the moon or the sun being in the sky. And with this, I wanted the sky to reflect the position of the sun by changing color. I then decided to add in mountains to make a landscape. This all represents time of day using the hour() function. To represent minutes, I added in a translucent cloud, that takes a minute to cross the screen. To represent seconds, I added in a shooting star, that takes a second to cross the screen. Below is my sketch for my project idea.

14572587_10154539645504330_479536189_o

Diana Connolly – Looking Outwards 6

screen-shot-2016-10-05-at-3-16-24-pm

screen-shot-2016-10-05-at-3-15-28-pm

blòm by Lucas Tswick

blòm is a generative art piece by Lucas Tswick that includes 150 different rose-like iterations. I admire this piece because each pattern is beautiful, and the notion behind the piece admires the beauty and randomness of nature. The creator’s artistic sensibilities were produced in this piece because the artist was inspired by the infinite variations of nature’s patterns — in things like butterfly wings and reptile scales. The artist thus created 150 iterations of rose patterns, incorporating random variables within each iteration in order to replicate nature’s randomness and infinite variation. The algorithm used to create these iterations started with the rose’s center point, and gave random variables to the spiraling outer “petal” parts of each flower. Thus, each iteration looks different in pattern and shape.

More info about the piece and process:
http://lucastswick.com/blom-generative-art-for-thecardsproject/

Diana Connolly – Project 5

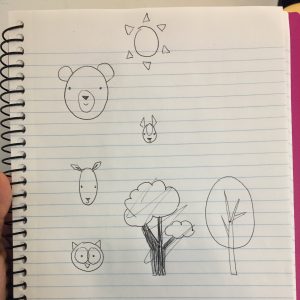
For this project, I wanted to make a wallpaper with a bunch of cute woodland creatures. I added in the sun, tree, and flower to give context to where they might be living. I created for loops for each icon and created the pattern seen below!

Wallpaper

var eyeSize = 5;
var noseUnit = 5;

function setup() { 
    createCanvas(790, 550);
    noLoop(); 
}

function draw() {
    background("LightBlue"); 
    noStroke();
    //Loop sun
    for (var xSun = 135; xSun < width; xSun += 200) {
        for (var ySun = 50; ySun < height; ySun += 800) {
            drawSun(xSun, ySun);}
        }	
    //Loop bear
    for (var xBear = 50; xBear < width; xBear += 200) {
        for (var yBear = 120; yBear < height; yBear += 800) {
            bear(xBear, yBear);}
        }	
    //Loop raccoon
    for (var xRaccoon = 135; xRaccoon < width; xRaccoon += 200) {
        for (var yRaccoon = 190; yRaccoon < height; yRaccoon += 800) {
            raccoon(xRaccoon, yRaccoon);}
        }	
    //Loop tree
    for (var xTree = 50; xTree < width; xTree += 200) {
        for (var yTree = 260; yTree < height; yTree += 800) {
            tree(xTree, yTree);}
        }	
    //Loop deer
    for (var xDeer = 135; xDeer < width; xDeer += 200) {
        for (var yDeer = 360; yDeer < height; yDeer += 800) {
            deer(xDeer, yDeer);}
        }
    //Loop owl
    for (var xOwl = 50; xOwl < width; xOwl += 200) {
        for (var yOwl = 430; yOwl < height; yOwl += 800) {
            owl(xOwl, yOwl);}
        }	
    //Loop flower
    for (var xFlower = 135; xFlower < width; xFlower += 200) {
        for (var yFlower = 500; yFlower < height; yFlower += 800) {
            flower(xFlower, yFlower);}
        }
}


function drawSun(xSun, ySun) {
    fill("yellow");
    var diamSun = 29;
    ellipse(xSun, ySun, diamSun, diamSun); //Center circle
    //Sun rays:
    var rayX = 5;
    var rayY = 20;
    push();
    translate(xSun,ySun);
        triangle(rayX, -rayY, 0, -rayY*1.6, -rayX, -rayY);//Top spike
        triangle(rayX, rayY, 0, rayY*1.6, -rayX, rayY);//Bottom spike
    rotate(radians(45));
        triangle(rayX, -rayY, 0, -rayY*1.6, -rayX, -rayY);//Top spike
        triangle(rayX, rayY, 0, rayY*1.6, -rayX, rayY);//Bottom spike
    rotate(radians(45));
        triangle(rayX, -rayY, 0, -rayY*1.6, -rayX, -rayY);//Top spike
        triangle(rayX, rayY, 0, rayY*1.6, -rayX, rayY);//Bottom spike
    rotate(radians(45));
        triangle(rayX, -rayY, 0, -rayY*1.6, -rayX, -rayY);//Top spike
        triangle(rayX, rayY, 0, rayY*1.6, -rayX, rayY);//Bottom spike
    pop();
}


function bear(xBear, yBear) {
    var bearUnit = 50;
    var bearEar = 15;
    fill(126,85,38);
        ellipse(xBear,yBear,bearUnit,bearUnit); //head
        ellipse(xBear-bearUnit*.4,yBear-bearUnit*.4,bearEar,bearEar); //left ear
        ellipse(xBear+bearUnit*.4,yBear-bearUnit*.4,bearEar,bearEar); //right ear
    fill(158,111,57);
        ellipse(xBear,yBear+7,bearUnit/2.3,bearUnit/2); //snout
    fill(0);
        triangle(xBear-noseUnit,yBear+noseUnit, xBear,yBear+noseUnit*2, xBear+noseUnit,yBear+noseUnit); //nose
        ellipse(xBear-15,yBear-5, eyeSize,eyeSize); //left eye
        ellipse(xBear+15,yBear-5, eyeSize,eyeSize); //right eye
}

function raccoon (xRaccoon, yRaccoon) {
    var wRaccoon = 45;
    var hRaccoon = 40;
    var eye = 10;
    fill(150);
        ellipse(xRaccoon, yRaccoon, wRaccoon, hRaccoon); //head
        triangle(xRaccoon-wRaccoon/4,yRaccoon-wRaccoon/3, xRaccoon-wRaccoon/2,yRaccoon-hRaccoon/2, xRaccoon-wRaccoon/2.1,yRaccoon-5); //left ear
        triangle(xRaccoon+wRaccoon/4,yRaccoon-wRaccoon/3, xRaccoon+wRaccoon/2,yRaccoon-hRaccoon/2, xRaccoon+wRaccoon/2.1,yRaccoon-5); //right ear
    fill(0);
        ellipse(xRaccoon, yRaccoon+8, noseUnit*2,noseUnit); //nose
    fill(100);
        ellipse(xRaccoon-eye, yRaccoon, eye*1.5, eye); //left eye patch
        ellipse(xRaccoon+eye, yRaccoon, eye*1.5, eye); //right eye patch
    fill(0);
        ellipse(xRaccoon-eye, yRaccoon, eyeSize,eyeSize); //left eye
        ellipse(xRaccoon+eye, yRaccoon, eyeSize,eyeSize); //right eye
}

function tree (xTree, yTree) {
    var wLeaves = 70;
    var hLeaves = 90;
    var branch = 20;
    fill(28,118,108);
        ellipse(xTree, yTree, wLeaves, hLeaves); //leaves
    fill(86,58,36);
        triangle(xTree-5,yTree+hLeaves, xTree, yTree-branch, xTree+5,yTree+hLeaves); //trunk
        triangle(xTree-2,yTree+5, xTree,yTree+branch*.75, xTree-branch, yTree-branch); //left branch
        triangle(xTree+2,yTree+branch, xTree,yTree+branch*1.5, xTree+branch, yTree-5); //right branch
}

function deer(xDeer, yDeer) {
    fill(188,140,85);
        ellipse(xDeer, yDeer, 35,50); //head
        quad(xDeer-4,yDeer-18, xDeer-14,yDeer-30, xDeer-24,yDeer-32, xDeer-20, yDeer-23); //left ear
        quad(xDeer+4,yDeer-18, xDeer+14,yDeer-30, xDeer+24,yDeer-32, xDeer+20, yDeer-23); //right ear
    fill(158,111,57);
        ellipse(xDeer,yDeer-15, 12,20); //forehead patch
    fill(0);
        ellipse(xDeer-10,yDeer+2, eyeSize,eyeSize); //left eye
        ellipse(xDeer+10,yDeer+2, eyeSize,eyeSize); //right eye
        triangle(xDeer-noseUnit,yDeer+noseUnit*3, xDeer,yDeer+noseUnit*4, xDeer+noseUnit,yDeer+noseUnit*3); //nose
}

function owl(xOwl, yOwl) {
    var wOwl = 50;
    var hOwl = 40;
    var ear = 20;
    fill(80,110,132);
        ellipse(xOwl, yOwl, wOwl,hOwl);
        triangle(xOwl-ear*.7,yOwl-ear*.75, xOwl-ear,yOwl-ear, xOwl-22,yOwl-ear*.25); //left ear
        triangle(xOwl+ear*.7,yOwl-ear*.75, xOwl+ear,yOwl-ear, xOwl+22,yOwl-ear*.25); //right ear
    fill(236,236,163);
        ellipse(xOwl-10,yOwl-2, hOwl/2,hOwl/2); //left eye patch
        ellipse(xOwl+10,yOwl-2, hOwl/2,hOwl/2); //left eye patch
    fill(0);
        ellipse(xOwl-10,yOwl-2,eyeSize,eyeSize); //left eye
        ellipse(xOwl+10,yOwl-2,eyeSize,eyeSize); //right eye
    fill("orange");
        triangle(xOwl-noseUnit,yOwl+noseUnit, xOwl,yOwl+noseUnit*3, xOwl+noseUnit,yOwl+noseUnit) //beak
}

function flower(xFlower, yFlower) {
    var wPetal = 10;
    var hPetal = 20;
    var yPetal = 15;
    var rotatn = 45;
    //Petals
    push();
    fill(179,91,134);
    translate(xFlower,yFlower);
        ellipse(0,-yPetal, wPetal,hPetal);
        ellipse(0,yPetal, wPetal,hPetal);
    rotate(radians(rotatn));
        ellipse(0,-yPetal, wPetal,hPetal);
        ellipse(0,yPetal, wPetal,hPetal);
    rotate(radians(rotatn));
        ellipse(0,-yPetal, wPetal,hPetal);
        ellipse(0,yPetal, wPetal,hPetal);
    rotate(radians(rotatn));
        ellipse(0,-yPetal, wPetal,hPetal);
        ellipse(0,yPetal, wPetal,hPetal);
    pop();
    //Center of Flower
    fill("orange");
        ellipse(xFlower,yFlower, yPetal,yPetal);
}

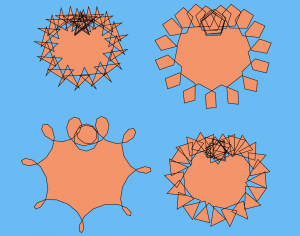
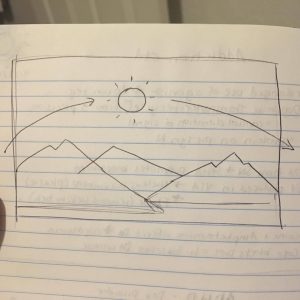
And here’s my initial sketch for the design:
fullsizerender

Diana Connolly – Looking Outwards 5

screen-shot-2016-09-30-at-1-36-39-pm

Zika Virion Scientific Illustration, John Liebler

Link to the article about this illustration:
http://www.artofthecell.com/animation/2587

Scientific illustrator John Liebler was intrigued by the Zika Virus as its name quickly spread due to its severe health implications. Liebler knew that there was a need for somebody to illustrate the Zika virion in its entirety, depicting all of the proteins in it. So, he set out to illustrate it and came up with the above image. His artistic sensibilities are manifested in the final form in that the image is a very clear but detailed depiction of the Zika virus, illustrating for any viewer what the physical make-up of the virus is. His use of varying colors also helps the viewer to parse each of the proteins in the virus. I’m not sure of the algorithms used to create the image, but I am sure that he must have used a program such as Maya to create his 3D representation of the virus, modeled after several scientific images of the physical virus, and then had the final 2D image rendered from this model. I had thought for a while that I might want to become a scientific illustrator, so scientific illustrations have always intrigued me. After searching online for 3D Zika illustrations, I came across Liebler’s and found it truly inspiring. I admire this piece because it not only filled the need for a detailed and clear illustration of the Zika virus, but it also inspired researchers to further study each of the individual proteins in the Zika virus. Now, researchers have published the homology models (3D renderings of each protein for the sake of other scientists to observe when the specific protein make-ups aren’t yet known). Thus, this illustration not only helps to depict the Zika virus in its visual properties, but it also spurred further research of the virus itself!

Diana Connolly – Project 4

Project 4

function setup() {
    createCanvas(640,480); //assigned canvas size
    background(0); //black background
}

function draw() {
    //Letter holes
    fill(150); //fills the letter holes with gray
    noStroke(); //no outline for the letter holes
    var holeHeight = 280;
    var holeWidth = 200;
    var holeX = 95;
    arc(holeX, height/2, holeWidth, holeHeight, -PI/2, PI/2, CHORD); //D hole
    arc(width-holeX, height/2, holeWidth, holeHeight,PI/2, -PI/2, CHORD); //C hole, semi-circle portion
    rect(width-holeX, height/2 - holeHeight/2, holeWidth, holeHeight); //C hole, rectangle portion

    //Lines
    strokeWeight(2);
    for (var i=0; i<(width/2); i+=15) {
    stroke(-225,255,255);
    line(i, 0, width/2, i-height/8); //top left curve
    line(width/2, (height/2)-i, i+width/2+10, 0); //top right curve
    line(i, height, width/2, height-(i-height/8)); //bottom left curve
    line(width/2, (height/2)+i, i+width/2+10, height); //bottom right curve
    }

    for (var i=0; i<(height/2); i+=15) {
    stroke(255,0,0);
    line(0, i, i*1.5, height/2); //left top curve
    line(width, i, width - i*1.5, height/2); //right top curve
    line(0, height-i, i*1.5, height/2); //left bottom curve
    line(width, height - i, width - i*1.5, height/2); //right bottom curve
    }
}
  

For my project, I wanted to play around with curves that met in the middle of the screen. I drew 4 blue curves that all met at the center point. After drawing these I realized that the negative space looked like it was spelling my initials — DC! So I filled in letter holes to make the DC pop out more, and then topped the piece with 4 more red curves on top for added depth.

Diana Connolly – Looking Outwards 4

Please visit this link to interact with the piece: http://www.patatap.com/

Here’s what one user created with Patatap:

Patatap, by Jono Brandel and Lullatone.

Patatap is a “Portable Animation and Sound Kit.” It is accessible to anyone on a web browser, and invites the user to become interactive with sound by creating their own sound combinations. The algorithm works by randomly assigning sounds to keys on the keyboard. The user can hit a key, and a corresponding sound and visual will generate. Once the user hits the space bar, new sounds and visuals are assigned to each of the keys on the keyboard, and a new background color sets the mood. While the algorithm uses randomization to assign the sounds and visuals, it selects these sounds and visuals from a set list. For example, oscillating sin wave symbols repeat in the visuals, as well as varying geometric shapes and colorful polka dots. This algorithm allows for the artists’ artistic sensibilities to be manifested in the piece’s final form because it makes interaction with sound art accessible to any user. It is beautiful, with its simple but varying shapes and pastel colors, and its simple but compelling range of sounds. I really like this piece because it is really fun to play with, it changes every time you hit the space bar (stays interesting), and gives me a new way to interact with sound.

Diana Connolly – Project 3

I wanted my piece to have some sort of story. When I came up with the idea of having eyes opening and closing, I then wanted my piece to be about day vs. night, and sun vs. moon. The 4 elements that change with mouse movement are: 1) the position of the sun vs. the moon, 2) the color of the background, 3) the dilation/size of the pupils, and 4) the shape of the eyes/how open they are, and for a bonus: the eyes blink when you click your mouse!

sketch

var eyeHeight = 90;

function setup() {
    createCanvas(480, 640);
}

function draw() {
	// Background color changes from orange to purple as moving mouse vertical
	  colR = map(mouseY, 0, height, 243, 44);
    colG = map(mouseY, 0, height, 135, 17);
    colB = map(mouseY, 0, height, 107, 106);
    background(colR, colG, colB);

    //Eye Shapes
    eyeHeight = map(mouseY, 0, height, 90, 0); // Maps mouse placement to eye height
    noStroke();
    fill(255);
    ellipse(width/4, height/2, 160, eyeHeight); // Left eye will close (height decrease) as mouse moves down
    ellipse(3*width/4, height/2, 160, eyeHeight); // Right eye will close (height decrease) as mouse moves down
    
    //Left Iris
    fill("LightBlue");
    ellipse(width/4, height/2, 90, eyeHeight);
    
    //Left Pupil
    noStroke();
    fill(0);
    ellipse(width/4, height/2, eyeHeight/2, eyeHeight/2); //Pupil dilates (ellipse size increases) with mouse moving up

    //Right Iris
    fill("LightBlue");
    ellipse(3*width/4, height/2, 90, eyeHeight);
    
    //Right Pupil
    noStroke();
    fill(0);
    ellipse(3*width/4, height/2, eyeHeight/2, eyeHeight/2); //Pupil dilates (ellipse size increases) with mouse moving up

    //Sun - using mouseY will make sun go up as mouse goes up
    fill("yellow");
    ellipse(width/2, mouseY, 42, 42); //Center circle
    //Spikes
    triangle(width/2 + 10, mouseY, width/2, mouseY-35, width/2 - 10, mouseY);//Top spike
    triangle(width/2 + 10, mouseY, width/2, mouseY+35, width/2 - 10, mouseY);//Bottom spike
    triangle(width/2, mouseY + 10, width/2 - 35, mouseY, width/2, mouseY - 10);//Left spike
    triangle(width/2, mouseY + 10, width/2 + 35, mouseY, width/2, mouseY - 10);//Right spike
    triangle(width/2 + 5, mouseY + 15, width/2 + 25, mouseY + 28, width/2 +5, mouseY - 15);//Bottom right spike
    triangle(width/2 + 5, mouseY - 15, width/2 + 25, mouseY - 28, width/2 +5, mouseY + 15);//Top right spike
    triangle(width/2 - 5, mouseY + 15, width/2 - 25, mouseY + 28, width/2 -5, mouseY - 15);//Bottom left spike
    triangle(width/2 - 5, mouseY - 15, width/2 - 25, mouseY - 28, width/2 -5, mouseY + 15);//Top right spike

    //Moon - using height-mouseY will make moon go down as mouse goes up
    fill(112, 120, 195);
    ellipse(width/2, height-mouseY, 50, 50);//Moon circle
    //Craters
    fill(120, 70, 225, 99);
    ellipse(width/2 - 7, height-mouseY + 7, 11, 12);
    ellipse(width/2 + 3, height-mouseY - 2, 6, 7);
    ellipse(width/2 + 11, height-mouseY - 14, 8, 8);
    ellipse(width/2 -13, height-mouseY - 9, 5, 6);
    ellipse(width/2 +2, height-mouseY + 16, 5, 6);
    
    if (mouseIsPressed) {
    fill(colR, colG, colB);
    ellipse(width/4, height/2, 160, 90);//Ellipse covers left eye  
    ellipse(3*width/4, height/2, 160, 90);//Ellipse covers right eye
    stroke(0);
    noFill();
    strokeWeight(3);
    arc(width/4, height/2, 155, eyeHeight, TWO_PI, PI); // Left closed eye
    arc(3*width/4, height/2, 155, eyeHeight, TWO_PI, PI); // Right closed eye
    }
}

Diana Connolly – Looking Outwards 3

Lustre, 2015
My friend Rehan Butt created a clothing line named Lustre for the 2015 Lunar Gala show with two of his friends, using algorithms to help produce their clothes. Their clothing line was termed by the audience as being the “origami line” because thick white paper was laser cut and then folded in geometric shapes to fit the models. The algorithms to do this were as follows: The team scanned each of their models using an ABB robot equipped with a camera to take many photos of each person, to then be compiled on AutoDesk’s 123D Catch for the sake of creating a 3D mesh model. With the 3D model of each person, the team was able to fit their 2D drawings of the clothing designs onto the 3D models, using the program Rhino to create the shapes of the clothes digitally. Taking it from 2D to 3D required an algorithm to determine where the volume of the clothing would be, and thus where to create the folds. These algorithms helped to manifest the team’s artistic sensibilities in the line’s final form because they used software and math to create the geometric shapes of the clothes, which all required high levels of detail, as well as consistency with the other geometric components. Once these geometric paper components were cut and folded, the team added iridescent, multi-chrome fabric accents to each of the clothing pieces. I absolutely loved this juxtaposition between the two polarized components, as the fluidity and colorfulness of the fabric contrasted with the rigidity and stark whiteness of the paper. I thought that the overall look of each piece was very enticing, and effective in highlighting the key features of both the paper elements and the fabric elements. Below are images of a few of the pieces, as well as a video of the models walking from the 2015 show!

Link to Rehan’s website page about the clothing line: http://rehanbutt.com/fashion

untitled-1
5 selected images from Lustre


Video of Lustre being modeled in the 2015 Lunar Gala show