sihand – Project Week 07 – Crystallize

Crystallize

I really enjoyed playing around with the equations and variables. During the course of my experimentation, I discovered a few cool effects combining different curves, but they all looked too chaotic. In the end, I chose this one, which is more simple and resembles an interesting crystallizing effect. It consists of an array of spiky shapes, which are modifications of a deltoid equation, that accumulate as the mouse moves across the canvas.

Sihan – crystallize

//Sihan Dong
//sihand@andrew.cmu.edu
//Section B
//Project Week 07: curves

var nPoints = 30;

function setup() {
    createCanvas(600, 400);
}

function draw() {
	background(255, map(mouseX, 0, width, 0, 200), map(mouseY, 0, height, 0, 200));
	stroke(255);
    noFill();
    drawDA();
}

function drawDA() {
	translate(width/2, height/2);
	var x = [];//array of spiky curves
	var y = [];
	var xa;//variables of circular curve
	var ya;
	
//only draw curves when mouse is within canvas
	if (mouseX < width & mouseY < height) {

    beginShape();
    for (var i = 0; i < nPoints; i++) {
        var t = map(i, 0, nPoints, 0, TWO_PI);
        for(var j = 0; j < min(mouseX/50, width); j++) {
        	var a = map(mouseX, 0, width, 0, 150);
			var d = map(mouseY, 0, width, 5, 8*j);
		//spiky curve
        	x[j] = j*d*cos(t) + j*cos(j*t);
        	y[j] = j*d*sin(t) - j*sin(j*t);
    	//circular curve    
        	xa = a*cos(t);
        	ya = a*sin(t);

        	vertex(xa, ya);
        	vertex(x[j], y[j]);
    	}
    }
    endShape();
    print(d);
    print(mouseY);
	}
}


Sihand – LookingOutwards 07 – Selfiecity

Selfiecity by Manovich

The millennial generation (that’s me!) is notorious for our signature narcissism: selfie-taking. While most people couldn’t bear with them, software researcher Dr. Lev Manovich are particularly interested in the styles of selfies across cities around the world. Dr. Manovich utilized what he calls “imageplots”, which are rich media visualization, to present the patterns he found in selfie-taking. In each imageplot, a distribution pattern is shown on the habits of selfie-takers’ poses, expressions, and more.

To better demonstrate the imageplots Dr. Manovich used, here are two examples of selfie patterns in New York City.

Gender and age profile of selfie-takers in NYC
Smile distribution of selfies in NYC by gender

There isn’t much information on what algorithm is behind these imageplots. My best guess would be a recognition algorithm that gathers data on quantitative selfie-taking habits such as the head tilt angle and the distance from face.

Learn more about Selfiecity

Learn more about Manovich

sihand – Project Week 06 – Contour Clock

sihand – contour clock

//Sihan Dong
//sihand@andrew.cmu.edu
//Section B
//Week 06 project: abstract clock - erosion

var s;
var m;
var h;
var angMinute;
var angSecond;
var arrayS = [];
var arrayM = [];
var arrayH = [];
var gradientH = [];
var colorH1 = [];
var colorH2 = [];
var interval = 40;

function setup() {
    createCanvas(600, 600);
}

function draw() {
	background(0, 0, 50);
	drawHour();
	drawSecond();
	drawMinute();
    drawTime();
}

function drawHour() {
	h = hour();
	noStroke();

	for (ih = 0; ih < 13; ih++) {
	//dimension of the centripetal circles
		arrayH[ih] = width - ih*interval;
	//set up the value of the gradient used to generate green and blue
		gradientH[ih] = 255 - 20*ih;
		
	//the certipedal circles represent the hours, where the 
		//land contour
		if (ih+1 > h%12 || ih+1 < 13) {
			//gradientH.pop();
			colorH1[ih] = color(0, gradientH[ih-h%12], 0);
			fill(colorH1[ih]);	
		}
		//ocean contour
		if (ih < h%12) {
			colorH2[ih] = color(0, 0, gradientH[h%12-ih-1]);
			fill(colorH2[ih]);
		}
		
		ellipse(width/2, height/2, arrayH[ih], arrayH[ih]);
	}
}

function drawMinute() {
	m = minute();
	noStroke();
	//fill()


    for (var im = 0; im < m; im++) {
    	push();
    	
    	translate(width/2, height/2);
    	angMinute = map(m, 0, 60, 0, TWO_PI);
    	angMinute = im*angMinute/m;
    	rotate(angMinute-PI/2);
    	
    	fill(0, 0, 255);
    	rect(0, -3/2, (width - (h%12)*interval)/2, 3);
  		ellipse((width - (h%12)*interval)/2, 0, 10, 7);
    	pop();
	}
}

function drawSecond() {
	s = second();
	noStroke();
	angSecond = map(m, 0, 60, 0, TWO_PI);

	for (is = 0; is < 60; is++) {
		push();
		arrayS[is] = map(is, 0, 60, 65/2+2, width/2);
		
		if (is < s) {
			translate(width/2, height/2);
    		rotate(angSecond-PI/2);
			//fill(255);
			fill(0, 0, map(is, 0, 60, 255, 0));
			ellipse(arrayS[is], 0, 4, 4);
		}
		pop();
	}	
}

function drawTime() {
//the circular background for the text
	noStroke();
	fill(0);
	ellipseMode(CENTER);
    ellipse(width/2, height/2, 65, 65);

//text that shows the real time
	fill(255);
    textAlign(CENTER);
    text(h + " : " + m + " : " + s, width/2, height/2+5);
}

This project was inspired by colored contour maps (shown below). Seconds are represented by a line of dots: “precipitation”; minutes are represented by a serious of “streams”; and hours are represented by the change in the contour. The idea is that every hour passed, the sea level, represented by the blue area, rises to a certain level. In other words, the island, which represented by the green area, relatively sinks by the same level. The changes are illustrated in the updated image via changes in the shades of green and blue, which abides by the common appearance of a contour map.

Contour map example


sihand – LookingOutwards 06 – Bauer

Random Paintings by Andrej Bauer

Sihan by Andrej Bauer
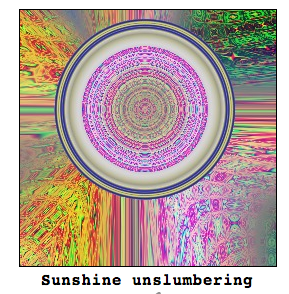
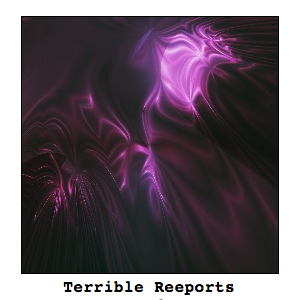
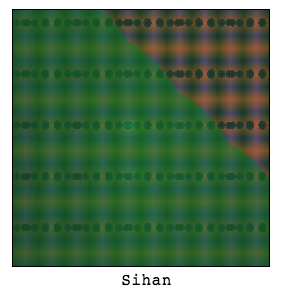
The picture above was made by a computer program developed by the Slovenian computational artist, Andrej Bauer. The program accepts the name of a picture, which in this case is my name, and generates a random picture using the name as a “seed”. The same “seed” consistently yields the same painting.

How? You might ask. As Bauer explains it, upon receiving the “seed”, which is the name of the picture, the program constructs an according mathematical formula. The unique formula determines the color of each pixel in the picture. Although the composition of the painting may appear random, it always follows the same sequence. The online version of the program is converted from the original one in ocaml to javascript with ocamljs.

I really enjoyed playing around with the program because the results are constantly surprising. Most of “my” works aren’t as aesthetic as the popular ones, but I believe that if I keep on experimenting, something would eventually come up. I think Bauer’s work is a real-life manifestation of the Infinite Monkey Theorem (wiki).

Here are some more popular images in his gallery.

Sunshine unslumbering by Andrej BauerTerrible reports by Andrej Bauer

Check out Bauer’s random art gallery here.

Learn more about Andrej Bauer.

sihand – LookingOutwards 05 – Glinting Algorithm

Glinting Algorithm

Researchers used their method to model the glittery shell of this snail.
Credit: Jacobs School of Engineering/UC San Diego

If you like the glittery metal texture as much as I do, you would understand the struggle of recreating the shimmering surface in drawings. A couple of current commercial software are able to recreate the details, but only in stills. However, the game has changed recently. A team of researchers led by UC San Diego professor Ravi Ramamoorthi developed an algorithm that significantly improves how computer software reproduces the glints, which is how light interacts with the smallest details on a metal surface.

The current method, which models details at the pixel level, is sufficient for most production but cannot represent the real world scenario. Professor Ramamoorthi’s team, on the other hand, broke down each pixel into “thousands of light-reflecting points smaller than a pixel, called microfacets”, so the results will be more grainy and noisy, and more realistic (Science Daily). Their solution also features a “position-normal distribution” that approximates the distribution of light at each location. This method is tremendously more efficient than the traditional method, where the light on each microfacet is calculated.

With their new algorithm, rendering will become almost instant. Their work is a manifest of how improvement in technology pushes artistic potential.

Iron Man’s armor

Read the original article at Science Daily

Sihand – Project 05 – Wallpaper

The wallpaper was inspired by a design online (shown below). I used multiple layers of elements to construct the interlocking frame effect.

As a side note, WordPress seems to be interfering with my code. There’s no margin on the left when I ran it.

tessellation

sihand – wallpaper

//Sihan Dong
//sihand@andrew.cmu.edu
//Section B
//Week 05 project: wall paper

//the weight of each frame
var colorWid = 12;
//the width of each set of frames
var unitWid = 7*colorWid;

function setup() {
    createCanvas(480, 480);
    background(230, 236, 244);
  //translate the coordinates so that the pattern
  //fills the entire canvas
    translate(-600, 0);
}

function drawElement () {
	noStroke();
	rect (0, 0, colorWid, colorWid*3);
	rect (0, colorWid*2, colorWid*2, colorWid);
	push();
	translate (colorWid*3, colorWid*3);
	rotate(-PI/2);
	rect (0, 0, colorWid, colorWid*3);
	rect (0, colorWid*2, colorWid*2, colorWid);
	pop();

}

function drawUnit() {
  var c1 = color(200, 220, 153);
  var c2 = color(159, 170, 81);
  var c3 = color(111, 135, 3);
  var c4 = color(50, 69, 1); //green palette

	push();
	for (i = 0; i<4; i++){
	 if(i % 4 == 0) {
		fill(c1);
	 	drawElement();
	 }
	 if(i % 4 == 1){
	 	fill(c2);
	 	translate (0, unitWid);
	 	rotate (-PI/2);
	 	drawElement();
	 }

	 if(i % 4 == 2){
	 	fill(c3);
	 	translate (0, unitWid);
	 	rotate (-PI/2);
	 	drawElement();
	 }

	 if(i % 4 == 3){
	 	fill(c4);
	 	translate (0, unitWid);
	 	rotate (-PI/2);
	 	drawElement();
	 	}
	}
	pop();
}

function drawPattern() {
	for (var j = 0; j<4; j++) {
		push();
		if(j % 2 == 0) {
      translate(j/2*(8*colorWid), j/2*(6*colorWid));
      drawUnit();
		}

		if(j % 2 == 1) {
      //these simple j functions generate the respective coordinates
      //for j = 1 and j = 3
			translate((17-3*j)*colorWid, (2+4*j)*colorWid);
			rotate(j*PI);
			drawUnit();
		}
    pop();
	}
}

function draw() {
	for (var x = 0; x < 10; x++) {
		for (var y = 0; y < 10; y++) {
      var dx = 2*x*unitWid;//2*x*colorWid;
			var dy = 2*y*unitWid;

      push();
  //generate rows and columns of units
      translate(dx, dy);
  //translate the coordinates so that the units fit together
      translate(y*2*colorWid, -x*2*colorWid);
      drawPattern();
      pop();
    }
	}
  noLoop();

}

sihand – project 04 – String Art – Golden Ratio

sketch

//Sihan Dong
//sihand@andrew.cmu.edu
//Section B
//Week 04 Project: string art
//a golden ratio inspired string art

var squareWid = 390;
var gratio = 0.61803398875;
var interm = 10; //the distance between each "pin" for the strings

function setup() {
    createCanvas(480, 640);
    background(255);
}


function draw() {
//draw the picture in the middle of the canvas
	curves(20,0);
}

function curves (x, y) {
	push();
	translate (x, y);

//each pin is 15-30 pixels away from another
	interm = random (15, 30);  

	for (i=0; i<200; i++) {
	//stop generating new squares when the width is too small
		if (squareWid>1) { 
	
	//draw the first square and triangle
		fill(random(0,200), random(0,200), random(0,200));
		rect(0, 0, squareWid, squareWid);
		noStroke();
		fill(random(100,255), random(100,255), random(100,255));
		triangle(squareWid, 0, 0, squareWid, squareWid, squareWid);

	//generating the strings
		for (j=0; j<interm; j++) {
			stroke(255);
			line(squareWid*j/interm, 0, 0, squareWid*(interm-j)/interm);
			line(squareWid*j/interm, squareWid, squareWid, squareWid*(interm-j)/interm)
		}

	//translate and rotate the coordinates for the next square
		translate(0, squareWid+squareWid*gratio+1);
		rotate(-PI/2);

	//set the dimension according to the golden ratio for the next square
		squareWid = squareWid*gratio;
		
		}
	}
	pop();
}

As you can probably tell, this piece of string art is inspired by the Golden Ratio spiral. I tried my best to simply the codes while still representing the concept of Golden Ratio. Every time you refresh the page, the “threadcount” of the strings will change, as well as the color blocks.

nautilus-shell-with-golden-ratio-spiral-overlay-2


Sihand – LookingOutwards – 04 – Tilt Brush

Tilt Brush

Tilt Brush has been around for a while now. It is mostly used to power designs with Google VR in the 3D realm; however, “it is only starting to wow the masses”, according to the Creators Project. Google has just equipped the tool with brushes that respond to audio, which allow users to elevate painting with VR to a whole new level. In this age of VR, designers might not be able to paint with the color of the wind, but they are certainly capable of painting with the very sound of the wind.

The exact algorithm of this mind-blowing drawing tool is preserved from the public. But it is clear that it transforms the beat of the music, any kind of your choice, into the pulses in the strokes of your drawings. The audio reactiveness might seem like a minor addition to the brushes, but the possibility it entails is unmatched. With the audio element, we now have yet another reason to engage in an artistic experience in VR than when it was silent.


Learn more about Tilt Brush here

Sihand – Project 03 – Dynamic Drawing – Snowflakes

sketch

//Sihan Dong
//sihand@andrew.cmu.edu
//Section B
//Project 03 snowflakes: this program is a interactive art

function setup() {
    createCanvas(640, 480);
}

function draw() {
	background(13,33,61);
  noStroke();
  fill(255);

//leftmost snowflake
//the diameter of the center circle is set between 20 and 70
//three layers circulate at the same speed,
//while the second layer is the satellie of the first, and the thrid the second
  var size1 = 50 * noise(0.005*frameCount + 60);
  var circle1 = constrain(size1, 20,70);
//defining the center circle
  ellipse(width/2-150, height/2, circle1, circle1);
//if cursor is placed within the circle snowflake appears
if (dist(mouseX, mouseY, width/2-150, height/2) < circle1/2) {
  var ang1 = TWO_PI * 0.005*frameCount + 20;
  var ang3 = TWO_PI * 0.005*frameCount + 30;
  for (var i = 0; i < 8; i++) {
    push();
    translate(width/2-150, height/2);
  	rotate(ang1 + TWO_PI * i / 8);
  	translate(100, 0);
  	ellipse(0, 0, 20, 20);
  		  if (frameCount >300) {
            push();
  			    rotate(ang1 + TWO_PI * 1 / 6);
  			    ellipse(50, 0, 10, 10);
                if (frameCount > 600) {
                    push();
                    translate(80,0);
                    rotate(ang1 + TWO_PI * 1 / 6);
      			        ellipse(0, 0, 10, 10);
                    rotate(ang3);
                    pop();
                  }
            pop();
            }
  		pop();
    }
}


//middle snowflake
//defining the center circle
var size2 = 80 * noise(0.005*frameCount + 60);
var circle2 = constrain(size2, 30,80);
ellipse(width/2, height/2, circle2, circle2);
//varying distance between layers
var rx = 200 * noise(0.005*frameCount + 40);
var tx = 150 * noise(0.005*frameCount + 50);
var circle3 = constrain (size2, 10, 20);
if (dist(mouseX, mouseY, width/2, height/2) < circle1/2) {
  var ang1 = TWO_PI * 0.005*frameCount + 20;
  var ang2 = TWO_PI * 0.0005*frameCount + 10;
  var ang3 = TWO_PI * 0.005*frameCount + 30;
  for (var i = 0; i < 6; i++) {
    push();
    translate(width/2, height/2);
    rotate(ang1 + TWO_PI * i / 6);
    translate(tx, 0);
    ellipse(0, 0, circle3, circle3);
    rotate(ang3);
        if (frameCount >200) {
            for (var j = 0; j < 3; j++) {
            push();
            rotate(ang2 + TWO_PI * j / 15);
            //three satellites will go around the second layer closely
            incre = 10;
            ellipse(rx, 0, 9, 9);
            pop();
            }
        }
      pop();
    }
}


//rightmost snowflake
var size1 = 100 * noise(0.005*frameCount + 60);
var circle1 = constrain(size1, 30,130);
//the diameter of the center circle is set between 30 and 130
ellipse(width/2+150, height/2, circle1, circle1);
//defining the center circle
var ux = 150 * noise(0.005*frameCount + 30);
if (dist(mouseX, mouseY, width/2+150, height/2) < circle1/2){
  for (var i = 0; i < 8; i++) {
    push();
    translate(width/2+150, height/2);
    rotate(TWO_PI * i / 8);
    //rotate(ang1 + TWO_PI * i / 8);
 	  translate(ux*1.25, 0);
  	ellipse(0, 0, 20, 20);
  		  if (frameCount >200) {
            for (var j = 0; j < 6; j++){
            push();
  			    rotate(TWO_PI * j / 6);
            translate(0.5*ux,0);
  			    ellipse(0, 0, 10, 10);
              if (frameCount > 400) {
                for (var j2 = 0; j2 < 6; j2++){
                  push();
      			      rotate(TWO_PI * j2 / 6);
                  translate(ux*0.25,0);
      			      ellipse(0, 0, 5, 5);
                  rotate(ang3);
                  pop();
              }
            }
          pop();
           }
         }
  		pop();
    }
}

}

This project was inspired by one of the rotation examples this week. During my experimenting, I found some interesting way to arrange the rotating figures. The results remind me of the formation of snowflakes so that’s how it got its name.

As a side note, because the size of the canvas is limited, the snowflakes overlap sometimes, which would influence the visual. Also the display is cropped off because of WordPress.

Sihand – Looking Outwards – 03

The Fahz

Pretty much everyone has seen the famous optical illusion of the Rubin vase, where two face shape matches the contour of a vase. But the “Fahz” brought this intriguing visual effect into the 3D world.

First, the Brooklyn-based computational designer Nick Desbiens generated vector geometry from the profile pictures of the loved ones. Second, he visualized the negative space between the two face outlines that make up the contour. The result was then moved to a 3D working space, where it was morphed into a 3D model with the artist’s algorithm. The stunning final result was created by a 3D printer.

I am very impressed by the simplicity of this idea and how it gives a peek into how 3D modeling and printing have brought endless opportunities, not just to large scale productions, but also to simple acts of love.

Check out their website here

Become a backer of their business on kickstarter here