![[OLD FALL 2019] 15-104 • Introduction to Computing for Creative Practice](../../../../wp-content/uploads/2020/08/stop-banner.png)
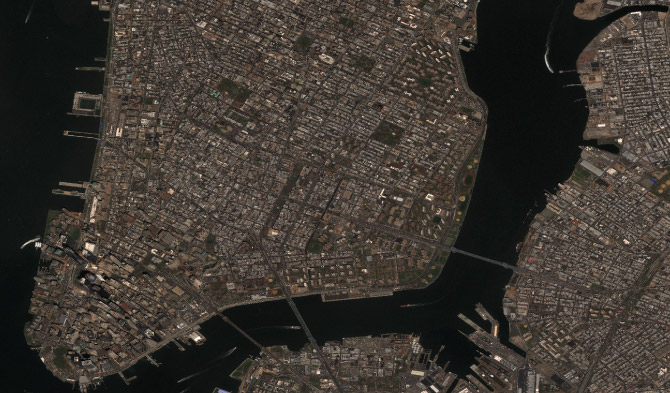
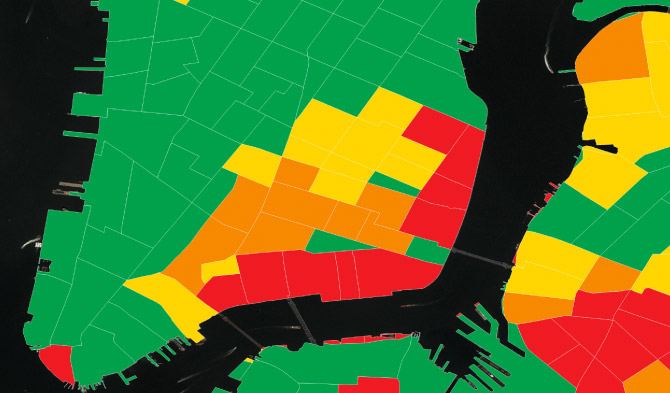
The project I chose was PENNY, an artificial intelligence tool developed by Stamen and researchers at Carnegie Mellon University. Penny is an AI that is built on machine learning using neural networks to understand what kind of infrastructure is found in low income versus high income housing and then guess the neighborhood income based on these patterns. It was built on top of DigitalGlobe’s analytics platform called GBDX, which uses the world’s most advanced commercial imaging satellites to create high resolution imagery that developers could then use. The AI was first given income data from the U.S. Census Bureau, which was then divided into smaller areas to match satellite images from GBDX. Then the Census based color map was overlaid on the satellite map. Then the AI looked for patterns in the satellite imagery and how they correlate to the income map. Through this is started to notice patterns in NEw York City, such as lower income areas tending to have baseball diamonds, parking lots, and large similarly shaped buildings (such as housing projects), middle income areas having more single family homes and apartment buildings, and high income areas having more greener spaces, tall shiny buildings, and single family homes with lush backyards. You could then change the neighborhoods by adding different types of infrastructure to see how the AI would predict the income of the area would change. I found this project interesting because I live in New York City and you could notice differences in low income areas and high income areas, but never seen the visuals of the neighborhood’s infrastructure converted into data to understand their income.