![[OLD FALL 2019] 15-104 • Introduction to Computing for Creative Practice](https://courses.ideate.cmu.edu/15-104/f2019/wp-content/uploads/2020/08/stop-banner.png)
//Zee Salman
//SECTION E
//fawziyas@andrew.cmu.edu
//Project- 07

var nPoints = 100;
var EPITROCHOID = 0; // Cartesian Parametric Form  [x=f(t), y=g(t)]
var curveMode = EPITROCHOID;


function setup() {
    createCanvas(400, 400);
    frameRate(50);
}


function draw() {
    background(180,190,175);

    // draw the frame
    fill(0);
    noStroke();
    noFill();

    // draw the curve
    push();
    translate(width / 2, height / 2);
    switch (curveMode) {
    case EPITROCHOID:
        drawEpitrochoidCurve();
        break;
    }
    pop();
}

//--------------------------------------------------
function drawEpitrochoidCurve() {
    // Epicycloid:
    // http://mathworld.wolfram.com/Epicycloid.html

    var nPoints = 20;
    var radius = 50;
    var separation = 125;

    var x;
    var y;

    var a = mouseX / 10;
    var b = a / 10.0;
    var h = constrain(mouseY / 20.0, 20, b *50);
    var ph = mouseX / 50.0;

    stroke(255, 250, 100);
    strokeWeight(3);
//BIGGER SHAPE
    beginShape();
    for (var i = 0; i < nPoints; i++) {
        var t = map(i, 0, nPoints, 0, TWO_PI);

        x = (a +30 + b) * cos(t) - h * cos(ph + t * (a + b) / b);
        y = (a+30 + b) * sin(t) - h * sin(ph + t * (a + b) / b);
        vertex(x, y);
    }
    endShape(CLOSE);


   //// smaller shape
    stroke(245, 20, 200);
    beginShape();
    for (var i = 0; i < nPoints; i++) {
        var t = map(i, 0, nPoints, 0, TWO_PI);

        x = (a + b) * cos(t) - h * cos(ph + t * (a + b) / b);
        y = (a + b) * sin(t) - h * sin(ph + t * (a + b) / b);
        vertex(x, y);
    }
    endShape(CLOSE);


    push();
    translate(5*separation, height / 2);
    var qx = 0;
    var qy = 0;
    for (var i = 0; i <= nPoints; i++) {
        var theta = map(i, 0, nPoints, 0, TWO_PI);
        var px = radius * cos(theta);
        var py = radius * sin(theta);
        if ((i % 2 == 0) & (i > 1)) {
            line(qx, qy, px, py);
        }
        qx = px;
        qy = py;
    }
    pop();

    //// smallest shape
    //// smaller shape
  	stroke(mouseY,45,mouseX)
    beginShape();
    for (var i = 0; i < nPoints; i++) {
        var t = map(i, 0, nPoints, 0, TWO_PI);

        x = (a/2 + b) * cos(t) - h * cos(ph + t * (a + b) / b);
        y = (a/2 + b) * sin(t) - h * sin(ph + t * (a + b) / b);
        vertex(x, y);
    }
    endShape(CLOSE);

//outer shape
	stroke(mouseY, mouseX, 200);
    push();
	rotate(mouseX*6/ mouseY*6);
    strokeWeight(2);
    beginShape();
    for(var i = 0; i < 200; i +=2) {
        var x =   a * (10 * cos(i) - cos(i));
        var y =   a * (10 * sin(i) -sin(i));
        vertex(x, y);
    }
    endShape();
    pop();


}
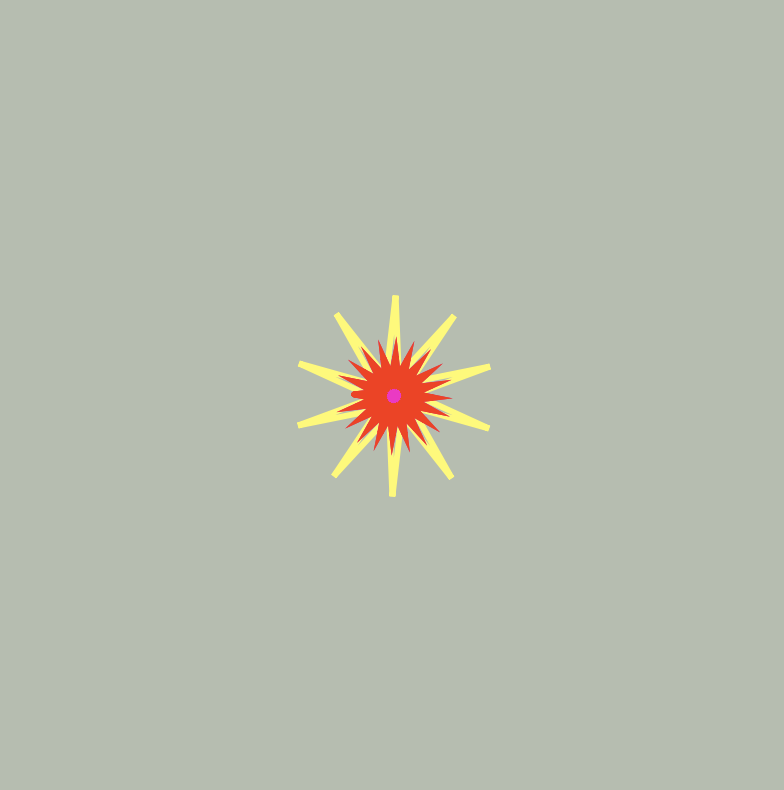
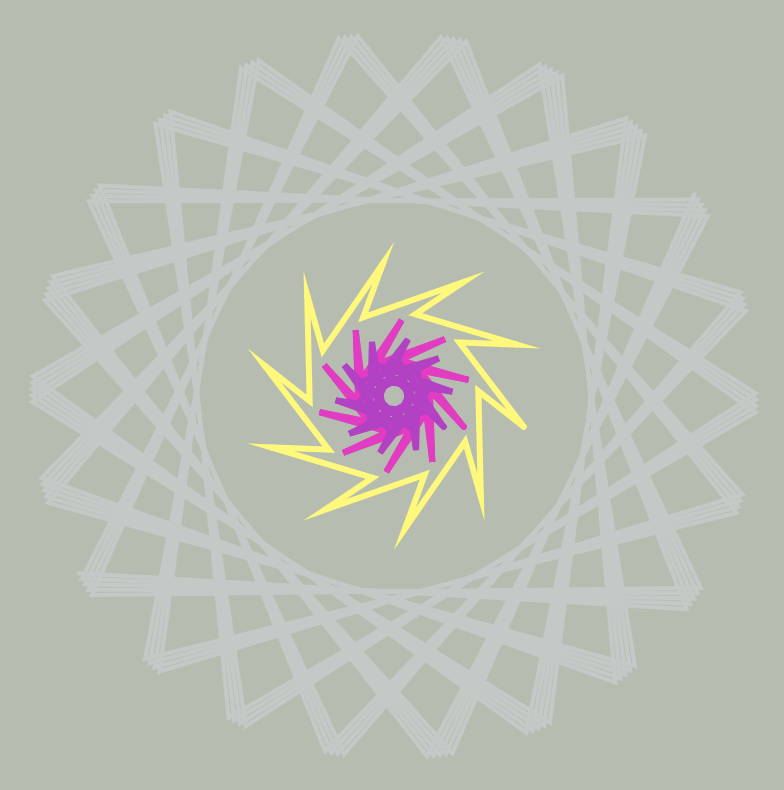
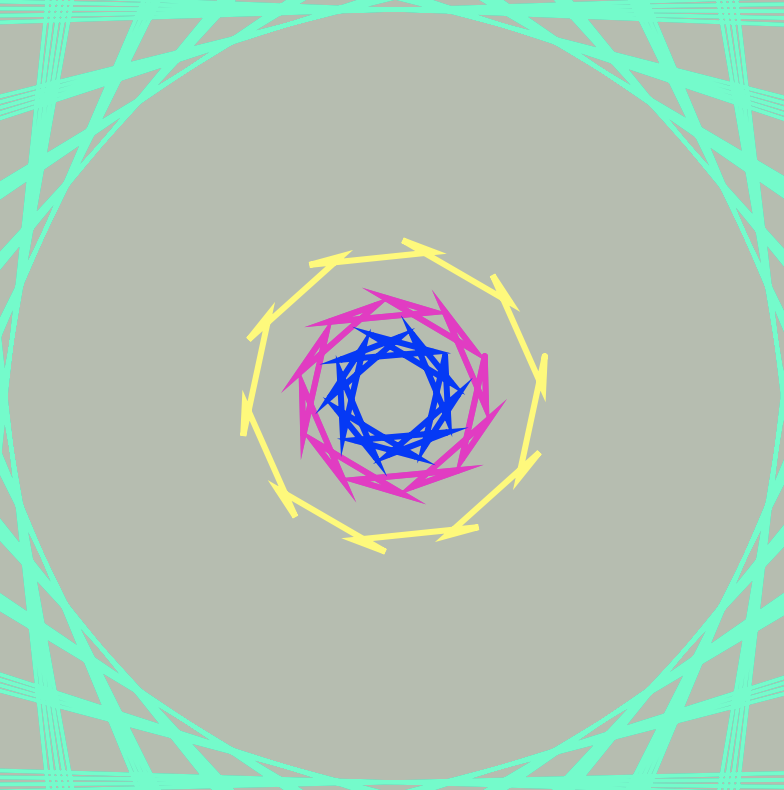
I started out wanting to do something floral or something almost pufferfish like but I started to stray away from those because I started to experiment more with my code. I started looking at the constraints and seeing where I can really try to make the piece interesting without losing sight of the project. Also trying to make each part visible to the user. I also played around with repetition and space which I really liked together in the composition. I would also like to take this project further and see how maby Epitrochoids I can fit onto one canvas and how I can make them more complex while again, making it clear.