![[OLD FALL 2019] 15-104 • Introduction to Computing for Creative Practice](https://courses.ideate.cmu.edu/15-104/f2019/wp-content/uploads/2020/08/stop-banner.png)
Project Interface
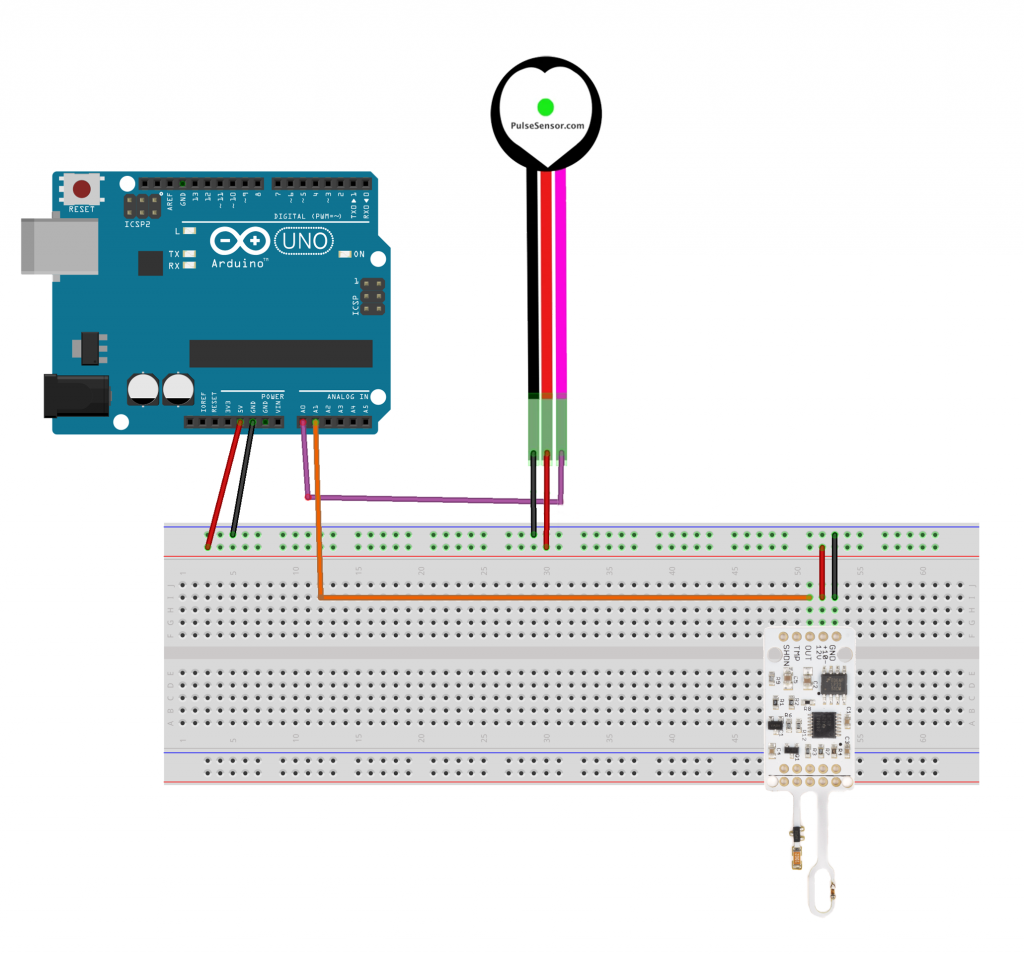
I created a smart watch interface for someone with anxiety and panic disorder. It reads someone’s pulse and breath rate and can detect when someone is having a panic attack. I used real-time biometric data from a pulse sensor and a wind sensor and hooked it up to an ardiuno, then I used serial communication to send the data and trigger & display different calming graphics using p5.js. I will go through the project interface and design first, then I will show you how I went about doing it.
Regular Interface
Interface during a panic attack
Depending on the kind of panic attack you are having, there are 3 modes/techniques. The good thing is that any of these techniques would work during a panic attack. I weighted certain techniques to be triggered based on someone’s sensor data. But for the purpose of the scope of this project, and because this requires more knowledge, time and research, I used keyboard keys to to demonstrate the different interfaces.
- Deep Breathing Technique (for when you’re hyperventilating)
- Counting Technique (for when your heart rate cannot be controlled)
- Distraction Technique (for when you need to be distracted from your overwhelming thoughts)
These techniques and methods were based on my research on medical articles here, here, and here.
Deep Breathing
Counting
“Recently I found that trying to focus on something else such as counting numbers… works, because it requires concentration.”
Melanie Luxenberg
Distraction
Proof of Concept
How to Implement it
I used the step by step guide provided by NYU’s physical computing department here to learn how to use ardiuno and p5.js together. If you follow that guide, you can know how to download and run the project. You will need to download the P5.js complete library, the P5.serialserver, and the ardiuno software.
You can download all the files you need to run the project here:
galsanea_FinalProject_allFiles
WordPress Version
If you just want to see the p5.js interaction, I modified the project to run on WordPress using mouse X location to simulate breathing pattern, and mouse Y location to simulate pulse patterns.
Use the following to replace the sensor data interaction:
keys:
b: breathing blobs interface
c: counting interface
g: game interface
any other key: regular clock interface
mouse:
x: move mouse in x directions to simulate breathing
y: move mouse in y directions to simulate heart beat
/*
Ghalya Alsanea
Section B
galsanea@andrew.cmu.edu
Final Project

normal mode:clock
            date
            sensor data: heart rate with beating heart

panic mode: deep breathing --- moving blob objects reacting to your breathing
            distraction technique --- use pingpong-like game to distract you
            counting technique --- count till a number to calm down
*/
// ----------------------------------------------------------------------------
// overall global variables
var proportion = 500;   //canvas proportion
var MX, MY;             //mouse x and y locations
// ----------------------------------------------------------------------------
//SENSOR global variables
var pulseSensor;        //global variable for pulse sensor data
var breathSensor;       //global variable for breath sensor data
var toggle = false;     //toggle to help sort the incoming sensor data from the serial
var pulseData = [];     //array container for incoming pulse data
// ----------------------------------------------------------------------------
// SERIAL global variables
var serial;                     // variable to hold an instance of the serialport library
var portName = 'COM11';         // fill in your serial port name here
var inData;                     // for incoming serial data. NOTE: it comes a byte at a time
var options = {baudrate: 9600}; // change the data rate to whatever you wish
// ----------------------------------------------------------------------------
// CLOCK global variables
var diameter = proportion * 0.75;   //clock diameter
//configure clock hands based on clock diameter
var secHand = diameter * 0.45;
var minHand = diameter * 0.35;
var hourHand = diameter * 0.2;
// ----------------------------------------------------------------------------
// BLOBS global variables
var blobs = [];     //used to store instances of blob objects
var change = 0;     //stores the rate of rotation and the y coordinate for noise later
var colorsPalette;  //color palette for blob objects
var numBlobs = 120; //number of blobs to make
// ----------------------------------------------------------------------------
// GAME global variables
var ballX;          //ball x position
var ballY;          //ball y position
var ballSize = 40;  //diameter of ball
var xvel;           //horizontal velocity
var yvel;           //vertical velocity
var d;              //distance between mouse and circle center
var dangerX;        //danger zone
var ballColor;      //what to color the ball
var score;          //keep score of hits
var scores = [];    //keep a list of all final scores to get the highest score
// ----------------------------------------------------------------------------
// CLICKER global variables
var gClickCount = 0;    //mouse click counter
var inc = 20;           //x increments
var yInc = 100;         //y increments
var yPos1 = 25          //top y position
var yPos2 = yPos1 + 50; //bottom y position
// ----------------------------------------------------------------------------

function setup() {
    createCanvas(proportion, proportion);
    // setupSerial();   ..comment out to disable serial
    setupBlobs();
    setupGame();
}

// ----------------------------------------------------------------------------

function draw() {
    //constrain mouse x and y to within the canvas
    MX = constrain(mouseX, 0, width);
    MY = constrain(mouseY, 0, height);

    if (key === "b") {
        //draw the blobs
        displayBlobs();
    } else if (key === "g") {
        //draw the game
        drawGame();
    } else if (key === "c") {
        //draw clicker
        displayClicker();
    } else {
        clockDisplay();
    }
}

////////////////////////////////////////////////////////////////////////
//**************************** SERIAL ********************************//
////////////////////////////////////////////////////////////////////////

function setupSerial() {
    serial = new p5.SerialPort();       // make a new instance of the serialport library
    serial.on('data', serialEvent);     // callback for when new data arrives
    serial.open(portName);              // open the serial port
}

function serialEvent() {
    // read a byte from the serial port, convert it to a number
    // NOTE: the inData comes in a byte at a time (so range is 0-255)
    inData = serial.read();
    // sort the data incoming by distributing every other byte to their respective variable
    // serial data comes in 2 at a time, so using a toggle you can store the data correctly
    if (toggle) {
        pulseSensor = inData;
    } else {
        breathSensor = inData;
    }
    toggle = !toggle;
}


////////////////////////////////////////////////////////////////////////
//*********************** base/CLOCK Display *************************//
////////////////////////////////////////////////////////////////////////

function clockDisplay() {
    background(255, 228, 225);    //mistyRose
    noStroke();

    //show the date
    dateDisplay();

    //for testing: using mouse data instead of sensor data
    var size = map(MY, 0, height, 20, 40);
    var BPM = 88;

    // // for serial: map heart size to pulse sensor data
    // var size = map(pulseSensor, 0, 255, 20, 40);
    //
    // //calculate beats per min (BPM) based on average pulse data
    // pulseData.push(pulseSensor);
    // //total pulse values read
    // var total = 0;
    // //find the total of all the readings
    // for(var i = 0; i < pulseData.length; i++) {
    //     total += pulseData[i];
    // }
    // //divide by the length of the data to get the average
    // var avg = total / pulseData.length;
    // //map the average number onto a range of BPM hear rates
    // var BPM = map(avg, 0, 255, 70, 130);
    //
    // //only read the last 100 readings
    // if (pulseData.length > 100) {
    //     pulseData.shift();
    // }

    //show the heart rate data
    heartDisplay(size, BPM);

    //draw from the center of the canvas
    push();
    translate(width / 2, height / 2);

    //draw clock base
    fill(255);
    circle(0, 0, diameter);

    //convert time to angles
    //subtract half a circle so the clock starts at the top, rather than 6 o'clock
    var s = map(second(), 0, 60, 0, TWO_PI) - PI;
    var m = map(minute(), 0, 60, 0, TWO_PI) - PI;
    //the % takes the remainder of the hours/12, which makes the dif between AM/PM
    var h = map((hour() % 12), 0, 12, 0, TWO_PI) - PI;

    //draw the hands
    drawClockHands(s, secHand, 1);  //seconds hand
    drawClockHands(m, minHand, 3);  //minutes hand
    drawClockHands(h, hourHand, 5); //hour hand

    //draw the ticks every 6 degrees (6 * 60 = 360)
    for (i = 0; i < 360; i += 6) {
        //make every 5th tick thicker
        if(i % 30 == 0) {
            strokeWeight(2);
        } else {
            strokeWeight(1);
        }
        push();
        rotate(radians(i));
        line(0, diameter / 2, 0, secHand + 5);
        pop();
    }
    pop()
}

//draw the clock hands
function drawClockHands(angle, hand, weight) {
    stroke("PaleVioletRed");
    push();
    rotate(angle);
    strokeWeight(weight);
    line(0, 0, 0, hand);
    pop();
}

//display today's date
function dateDisplay() {
    var d = day();
    var m = month();
    var y = year();
    fill("PaleVioletRed");
    textAlign(LEFT);
    textSize(18);
    text(m + "." + d + "." + y, 10, height - 15);
}

//display heart rate with heart graphic
function heartDisplay(size, BPM) {
    textSize(12);
    textAlign(CENTER);
    text(floor(BPM), width - 50, height - 60);
    drawHeart(width - 50, height - 50, size);
}

function drawHeart(x, y, size) {
    beginShape();
    vertex(x, y);
    bezierVertex(x - size / 2, y - size / 2, x - size, y + size / 3, x, y + size);
    bezierVertex(x + size, y + size / 3, x + size / 2, y - size / 2, x, y);
    endShape(CLOSE);
}

////////////////////////////////////////////////////////////////////////
//******************** breathing BLOB Display ************************//
////////////////////////////////////////////////////////////////////////

function setupBlobs() {
    //create color paletter for the blob objects
    colorsPalette = [color(146, 167, 202,30),
                    color(186, 196, 219,30),
                    color(118, 135, 172,30),
                    color(76, 41, 81,30),
                    color(144, 62, 92,30),
                    color(178, 93, 119,30),
                    color(215, 118, 136,30),
                    color(246, 156, 164,30)];

    // create new blob object for every num of blobs
    for (var i = 0; i < numBlobs; i++){
        var temp = makeBlob(i + 0.1, i, i * random(90),
            colorsPalette[floor(random(colorsPalette.length))]);
        blobs.push(temp);
    }
}

function displayBlobs() {
    background(240, 200, 240, 30);
    //for testing: using mouse data instead of sensor data
    var addToRadius = map(MX, 0, width, 0, 100);

    // //for serial: map the breathing sensor data to blob radius
    // //it's inversely mapped because when you breath out it decreases and vice versa
    // var addToRadius = map(breathSensor, 255, 0, 0, 100);

    for(var i = 0; i < blobs.length; i++){
        blobs[i].r = i + addToRadius;
        blobs[i].draw(change);
    }
    //create rotation change and noise change
    change+=0.01;
}

function makeBlob(radius, roughness, angle, color){
    var blob = {r: radius,      // radius of blob
                x: width / 2,   // x position of blob
                y: height / 2,  // y position of blob
                rough: roughness, // magnitude of how much the circle is distorted
                ang: angle,     // how much to rotate the circle by
                c: color,       // color of the blob
                draw: drawBlob, //draw the blobs
    }
    return blob;
}

function drawBlob(change) {
    noStroke();
    fill(this.c);   //color to fill the blob

    push();
    translate(this.x, this.y);  //move to xpos, ypos
    rotate(this.ang + change);  //rotate by this.angle+change

    beginShape();   //begin a shape based on the vertex points below

    //create vertex points
    var off = 0;
    for (var i = 0; i < TWO_PI; i += 0.1) {
        var offset = map(noise(off, change), 0, 1, -this.rough, this.rough);
        var R = this.r + offset;
        var x = R * cos(i);
        var y = R * sin(i);
        vertex(x, y);
        off += 0.1;
    }
    endShape();
    pop();
}

////////////////////////////////////////////////////////////////////////
//************************ GAME display ******************************//
////////////////////////////////////////////////////////////////////////

function setupGame() {
    noStroke();
    //ball starts at the center of the canvas
    ballX = width / 2;
    ballY = height / 2;
    //define danger zone
    dangerX = width / 4;
    //set x and y velocity
    xvel = 5;
    yvel = 0;
    //set score
    score = 0;
}

function drawGame() {
    background (100);

    //draw the hitting paddle
    strokeWeight(5);
    stroke(255);
    line(mouseX, mouseY + 10, mouseX, mouseY - 10);

    //instructions
    noStroke();
    fill(255);
    textAlign(LEFT);
    writeText(20, "Let's play a game!", 20, 25);
    writeText(12, "Don't let the ball go left of the screen", 20, 50);

    //define the playing area
    fill(0);
    rect(width / 2, 0, width / 2, height);

    //warn if ball is too close to edge
    if(ballX - ballSize / 2 <= dangerX & xvel < 0){
        ballColor = "yellow";
    } else {
        ballColor = "white";
    }

    //draw the circle
    fill (ballColor);
    circle(ballX, ballY, ballSize);

    //makes the ball move in x and y directions
    ballX = ballX + xvel;
    ballY = ballY + yvel;

    //When it hits the right edge of the canvas,
    //it reverses horizontal velocity
    if (ballX >= width - ballSize / 2) {
        xvel = -1 * xvel;
    }

    //when it hits the bottom or top edge of the canvas,
    //it reverses vertical velocity
    if (ballY <= ballSize / 2) {
        yvel = -1 * yvel;
    } else if (ballY >= height - ballSize / 2) {
        yvel = -1 * yvel;
    }

    //find the distance between ball center and mouse
    d = dist(mouseX, mouseY, ballX, ballY);

    //if  (1) the mouse hits the edge of the ball
    //and (2) the mouse is on the left half of the canvas
    //and (3) the x velocity is negative
    //then switch directions and get a random yvel.
    if (d <= ballSize / 2 & mouseX <= width / 2 && xvel < 0){
        yvel = random(-3, 3);
        xvel = -1 * xvel;
        yvel = -1 * yvel;
        score = score + 1;
    }

    //keep current score
    fill("white");
    writeText(30, score, width - 50, height - 50);

    //reset game if th eball went to far out the canvas
    if (ballX < -150) {
        resetGame();
    }
}

//reset game
function resetGame() {
    scores.push(score)          //push final score to scores
    background (0, 51, 102);
    fill(255);
    textAlign(LEFT);
    writeText(80, "IT'S OK!", 10, height / 4);
    writeText(30, "click to try again", 20, height / 2);
    //cureent score
    writeText(20, "score: " + score, 20, height / 2 + 50);
    //highest score
    writeText(20, "best score: " + max(scores), 20, height / 2 + 100);

    if (mouseIsPressed){
        setupGame();
    }
}

function writeText(size, words, x, y) {
    textSize(size);
    text(words, x, y);
}

////////////////////////////////////////////////////////////////////////
//*********************** COUNT display ******************************//
////////////////////////////////////////////////////////////////////////

function displayClicker() {
    background("pink");

    if (gClickCount === 0) {
        noStroke();
        fill(0);
        textAlign(LEFT);
        textSize(20);
        text("tap me and count to fives...", 20, 50);
    }

    stroke (0);
    strokeWeight(3);

    //everytime you click, draw a line
    for(var i = 0; i < gClickCount; i++){
        //variable to show which line the tickmarks are on
        var a = floor((i * inc + inc - 1) / width);

        //x and y locations depending on which line
        var x = i * inc + inc - width * a;
        var y1 = yPos1 + a * yInc;
        var y2 = yPos2 + a * yInc;

        if ( (i + 1) % 5 === 0) {
            //draw diagonal line every fifth tick
            line(x, y1, x - 5 * inc, y2);
        } else {
            //otherwise draw a straight line
            line(x, y1, x, y2);
        }
    }
}


function mousePressed() {
    //everytime you click, you increase the amount of times the loop runs
    gClickCount++;
}

function keyPressed() {
    //reset gClickCount to zero whenever a keyboard key is pressed
    gClickCount = 0;
}