Joseph Zhang – Project 07 – E

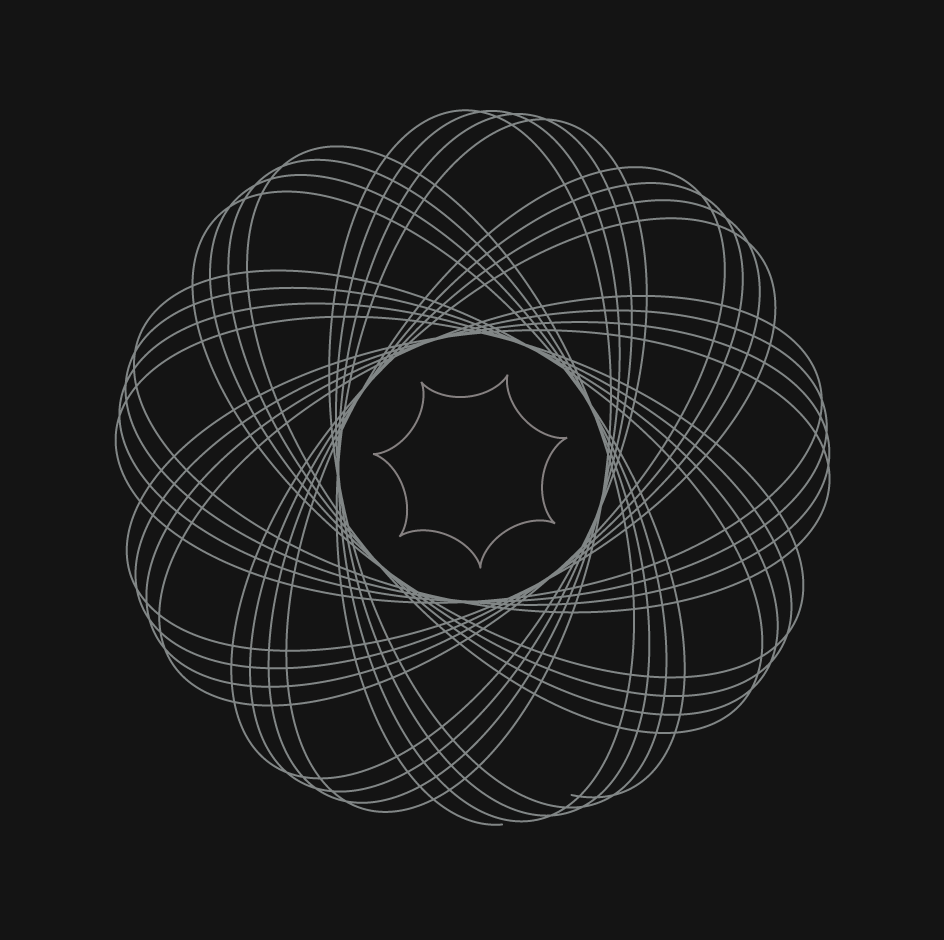
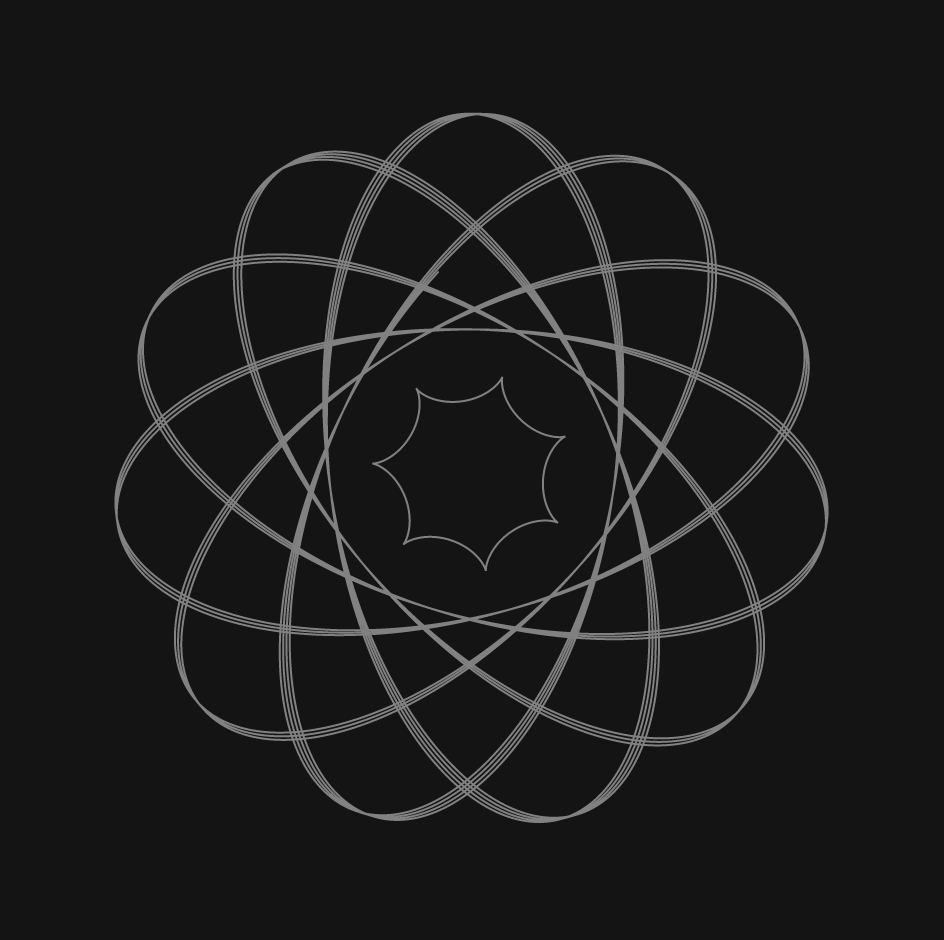
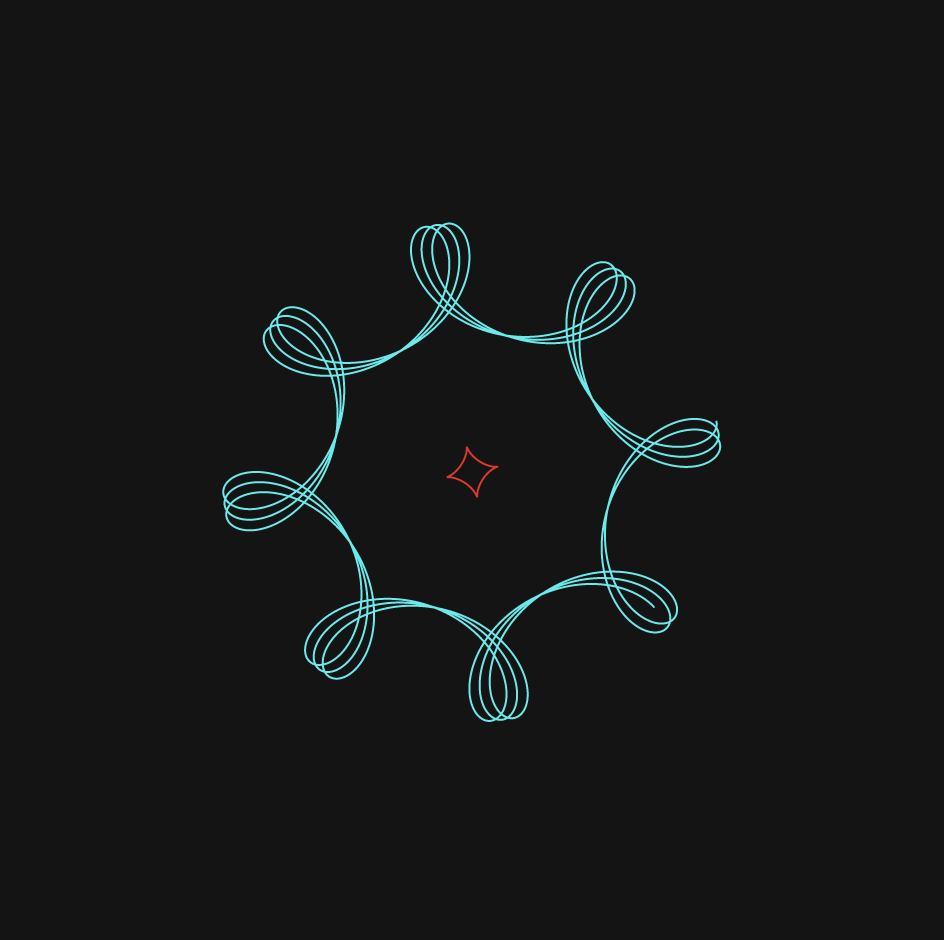
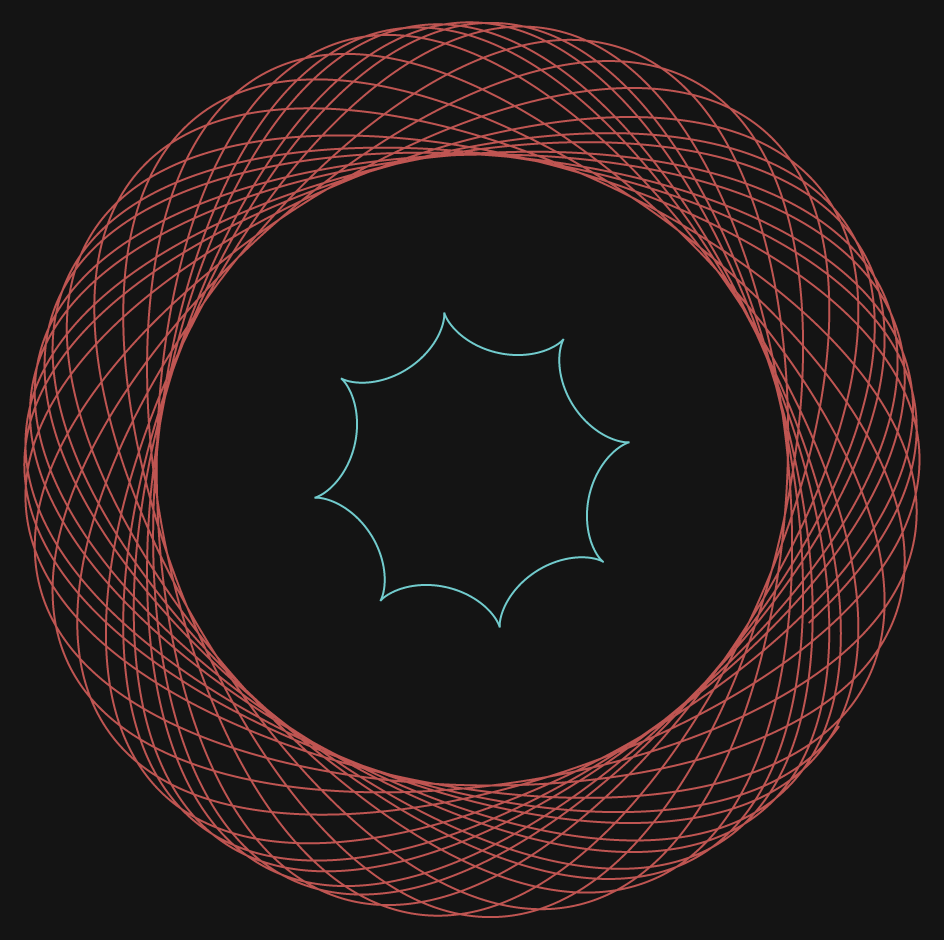
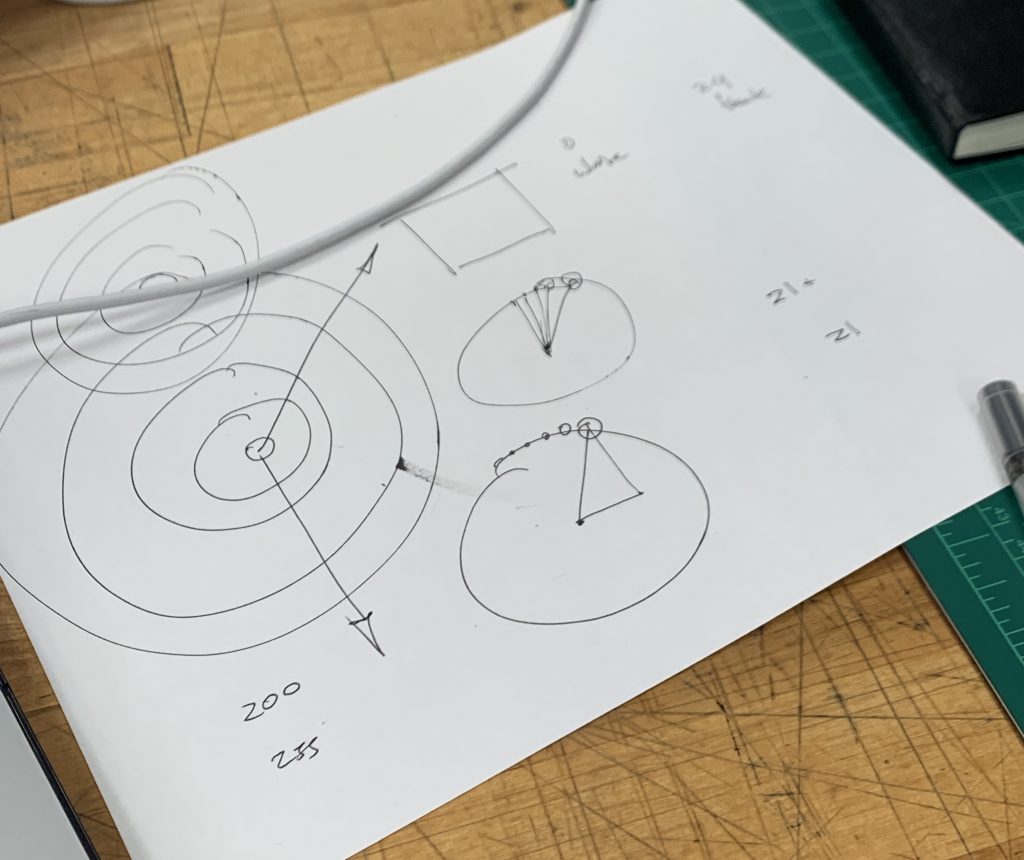
For this project, I wanted to play with hypotrochoid forms and astroids in hopes of making something pretty dynamic. I had really brief understanding of roulettes from high school mathematics so a lot of my learning came from going through the Wolfram Alpha website and learning about each form. At the end, these were the two that I wanted to continue playing with.

Quiet honestly, I had no idea how it would come out at the end and much of the process just came from experimenting with mouse positions, mapping, and tweaking with equations. Below are some screenshots of its different forms.

sketch

// Joseph Zhang
// Section E
// haozhez@andrew.cmu.edu
// Project-07: Composition with Curves

var points = 2000;
var rotateCount = 0;

function setup() {
    createCanvas(480, 480);

}

// calls each shape and continuously rotates the form
function draw() {
    background(20);
    push();
        translate(width / 2, height / 2);
        rotate(rotateCount);
        rotateCount++;
        drawAstroid();
        drawHypo();
    pop();
}

// draws the Astroid form (inside shape)
function drawAstroid() {
    // colors is dependent on mouse position
    colorR = map(mouseY, 0, width, 0, 255);
    colorG = map(mouseX , 0, width, 0, 255);
    colorB = map(mouseX , 0, width, 0, 255);
    stroke(colorR , colorG, colorB);
    noFill();
    strokeWeight(1);

    // for loop to draw astorid form
    beginShape();
    petal = int(map(mouseX, 0, width, 4, 10));
    size = int(map(mouseX, 0, width, 0, 100));
    for (var i = 0; i < points; i++){
        t = map(i, 0, points, 0, TWO_PI);
        x = (size / petal) * ((petal - 1) * cos(t) + cos((petal - 1) * t));
        y = (size / petal) * ((petal - 1) * sin(t) - sin((petal - 1) * t));
        vertex(x,y);
    }
    endShape();
}

// draws the hypotrochoid form (outside shape)
function drawHypo() {
    // colors is dependent on mouse position
    colorR = map(mouseX, 0, width, 0, 255);
    colorG = map(mouseY , 0, width, 0, 255);
    colorB = map(mouseY , 0, width, 0, 255);
    stroke(colorR , colorG, colorB);
    strokeWeight(1);
    
    //for loop to draw astroid form
    a =  map(mouseX, 0 , width, 200, 350);
    b =  map(mouseY, 0 , width, 100, 200); 
    h =  map(mouseY, 0 , width, 2, 105); 
    
    beginShape();
    for (var i = 0; i < 10000; i++){

        t = map(i, 0, 500, 0, TWO_PI);
        x = (a - b) * cos(t) + h * cos((a - b) * (t / b));
        y = (a - b) * sin(t) - h * sin((a - b) * (t / b));
        vertex(x, y);
    }
    endShape();
}

Form 1
Form 2
Form 3
Form 4

Joseph Zhang – Looking Outwards – 07

Installation in San Jose Airport

As I scoured the internet for computational data visualization projects, I happed to find this installation, a physical project that I’ve walked by countless times on my way to various cities across the United States. This project is called eCloud, a data-driven project located in San Jose Airport that changes according to live weather patterns across the world. eCloud is a sculpture inspired by the formation and properties of an actual cloud, hence the clor and positioning in space. The design takes into account the sky weather, temperature, wind speed, wind direction, relative humidity, and visibility. With this information the polycarbonate tiles transition from full transparency to opaqueness, creating an elegant array of floating components. Some of the cities include Prague, Berlin, Los Angeles, and Rio De Janeiro

Complimentary digital interface

To accompany the installation, there’s a digital interface that shows all of the data currently used. This project really fascinated me because it takes a form in nature and abstracts it into something so artistic, yet still computational. This project is a good example of a design system—that is alone, each tile means nothing. However, when together, you get a beautiful cluster of data titles.

Joseph Zhang – Project 06 – Abstract Clock

sketch

// Joseph Zhang
// Section E
// haozhez@andrew.cmu.edu
// Assignment-06C: Simple Clock

function setup() {
    createCanvas(480, 480);
}


//translates everything
function draw() {
    // to make sure hour() never goes past 13
    var hr = hour();
    if(hour() > 12) {
        hr = hour() - 12;
    }

    // push and eventual pop so that I can position the clock
    push();
    translate(228 + mouseX / 20, 228 + mouseY / 20);
    drawClock();     
    pop();

    // shows the time
    noStroke();
    fill(map(mouseX, 0, width, 150, 255)); 
    
    text(nf(hr, 2, 0) + ":" + nf(minute(), 2, 0) + ":" + nf(second(), 2, 0), width - 70, height - 30, 100, 30);
}

//draws everything 
function drawClock(){
    threeSixty = 2 * PI;    
    background(30);
    strokeWeight(0);
    
    // radial grid
    for ( i = 1; i < 13; i++) {
        stroke(68);
        strokeWeight(1);
        line(0, 0, 600 * cos(threeSixty * i / 12), 600 * sin(threeSixty * i / 12));
        stroke(0);
    }

    //background circles
    stroke(0);
    fill(0, 0, 0, 80);
    ellipse(0, 0, 300, 300);
    ellipse(0, 0, 140, 140);


    //displays millisecond (smaller circle)
    // stroke(255,255,255, 50);
    strokeWeight(2);
    ellipse(200 * cos(threeSixty * millis() / 60000 - (PI / 2)), 200 * sin(threeSixty * millis() / 60000 - (PI / 2)), 30, 30);
    ellipse(-200 * cos(threeSixty * millis() / 60000 - (PI / 2)), -200 * sin(threeSixty * millis() / 60000 - (PI / 2)), 30, 30);

    // displays minutes (bigger circle)
    strokeWeight(2);
    stroke(255,255,255, 190);
    line(70 * cos(threeSixty * minute() / 60 - (PI / 2)), 
        70 * sin(threeSixty * minute() / 60 - (PI / 2)),
        700 * cos(threeSixty * minute() / 60 - (PI / 2)),
        700 * sin(threeSixty * minute() / 60 - (PI / 2)));
    line(-70 * cos(threeSixty * minute() / 60 - (PI / 2)), 
        -70 * sin(threeSixty * minute() / 60 - (PI / 2)),
        -700 * cos(threeSixty * minute() / 60 - (PI / 2)),
        -700 * sin(threeSixty * minute() / 60 - (PI / 2)));
    fill(0,0,0,255);
    ellipse(70 * cos(threeSixty * minute() / 60 - (PI / 2)), 70 * sin(threeSixty * minute() / 60 - (PI / 2)), 50, 50);
    ellipse(-70 * cos(threeSixty * minute() / 60 - (PI / 2)), -70 * sin(threeSixty * minute() / 60 - (PI / 2)), 50 , 50);
    strokeWeight(1);

    //displays seconds (smaller circle)
    stroke(255, 255, 255, 100);
    strokeWeight(2);
    line(150 * cos(threeSixty * second() / 60 - (PI / 2)),
        150 * sin(threeSixty * second() / 60 - (PI / 2)),
        500 * cos(threeSixty * second() / 60 - (PI / 2)),
        500 * sin(threeSixty * second() / 60 - (PI / 2)));
    line(-150 * cos(threeSixty * second() / 60 - (PI / 2)),
        -150 * sin(threeSixty * second() / 60 - (PI / 2)),
        -500 * cos(threeSixty * second() / 60 - (PI / 2)),
        -500 * sin(threeSixty * second() / 60 - (PI / 2)));
    ellipse(150 * cos(threeSixty * second() / 60 - (PI / 2)), 150 * sin(threeSixty * second() / 60 - (PI / 2)), 30, 30);
    ellipse(-150 * cos(threeSixty * second() / 60 - (PI / 2)), -150 * sin(threeSixty * second() / 60 - (PI / 2)), 30, 30);

    //displays hour
    strokeWeight(2);
    stroke(255, 255, 255, 230);
    line(0, 0, 
    30 * cos(threeSixty * (hour() / 12 + minute() / 720) - (PI / 2)),
    30 * sin(threeSixty * (hour() / 12 + minute() / 720)  - (PI / 2)));
    ellipse(0,0,10,10);
}

For this abstract clock, I really wanted to do something that grow out radially and moves in proportion to its time sequencing. I wanted to build something that gives the resemblance of a clock but doesn’t necessarily function entirely as one. This prompted me to utilize ellipses and to move them around the screen depending on their associated time measurement.

The wider you move out the ring, the more micro the time gets. The innermost ring represents hour while the black circle on the outside represents milliseconds. As you move from innermost ring to outermost ring, the opacity getter lighter and lighter until it becomes black (millisecond).

Joseph Zhang – Looking Outwards – 06

Brute hero

A few weeks ago, I was looking into the practice of computational design and found Brute Wine, a wine company in Hamburg that uses the wind patterns in the city to craft the brand’s designs. The brand concept was developed by an international creative studio called Landor. In their case study of this project, they state “The weather shapes the wine, we used it to shape the brand.”

In the image above, one can see the live weather statistics pulled from Hamburg. Because weather is constantly changing on a daily basis, every daily visit to the site yields a completely new visualization.


Brute Wine manifests the data-driven designs in various ways, such as mobile/desktop interfaces, posters, and of course, on their physically branded products.

One can see the designer’s artistic choices come to life from 1) the beautiful forms themselves and 2) the beautiful color palette as seen here. Brute Wine’s uniqueness comes from the fact the wine is grown in rough weather conditions. This is very beautifully demonstrated in the color dimmed whites and dark blues.

/www.brute-wine.com/

Joseph Zhang – Project 05 – Wallpaper

sketch

// Joseph Zhang
// Section E
// haozhez@andrew.cmue.edu
// Project-05: Wallpaper

function setup() {
    createCanvas(600,600);
    background('green');
}

// ellipse diam
var diam = 70;
  
function draw() {
    noStroke();
    // creates grid system
    for (x = 0; x < width/30; x+=1) {
        for ( y = 0; y < height/30; y += 1) {
                bigCircle(30 +  60 * x, 30 + 60 * y);
                smallCircleRect(30 +  60 * x, 30 + 60 * y);
        }
    }
    noLoop();
}

// creates the black portion
function bigCircle(xPos,yPos) {
    fill('black');
    ellipse(xPos, yPos, diam , diam)
}

// creates the white portion
function smallCircleRect(xPos,yPos) {
    fill('white');
    rectMode(CENTER);
    rect(xPos, yPos, diam / 1.3, diam / 1.3);
    ellipse(xPos, yPos, diam - 7, diam - 7);
}

For this project, I pulled a lot of inspiration from the Tartan plaid pattern that’s often associated with Carnegie Mellon. That’s why I went with the grid-like pattern and the black green color scheme.

Joseph Zhang – Looking Outwards – 05

https://maikool.com/transit/

This week, I looked at 3D graphic artist Michael Kim and his project “Transit.” At first glance, the image looks like an ordinary photo, until you realize the rendering and texturing process that went behind building up this reality. Kim began the process by collecting references from his rides in NYC subway trains. From there, he began clay modeling the interior structure of the subway train, in Autodesk Fusion and Cinema 4D. After contacting him, he said the modeling process took 5 days, 4 hours a day.

From there he hand drew all the graphics he wanted on paper and used them as a graphite textures on the surfaces.

Much of his process was dedicated to UV mapping, which is projecting 2D visuals onto a 3d surface. If you look closely at the details, Kim created every individual surface imperfection, which includes, fingerprints, smudges, dust particles, and wear on curvatures.

Besides Cinema 4D and Autodesk Fusion, Kim also used programs such as Substance Painter, Marvelous Painter, and Adobe Photoshop.

I think what really compelled me to this piece was the process and procedure that Michael underwent. From a surface level glance, the final product is incredible but, ultimately it was talking to him and understanding the process he went through that really attracted me to “Transit”. His artistic sensitivity is very evidently seen in his attention to detail, and the subtle references, such as the “Mailkook Express”, his logo, and just all the texturing.

Joseph Zhang – Project 04 – E

sketch

// Joseph Zhang
// Section E
// haozhez@andrew.cmue.edu
// Project-04: String Art

function setup() {
    createCanvas(400, 300);
    background(0,0,0);
}

function draw(){

    // formation 1 (center)
    push();
    translate(50,0);
    lineArt();
    pop();

    // formation 2 (right)
    push();
    translate(350,0);
    lineArt();
    pop();

    // formation 3 (left)
    push();
    translate(-250,0);
    lineArt();
    pop();
}

//creates one 300x300 square formation
function lineArt(){
    blue = 0;
    green = 20;
    red = 170;
    strokeWeight(.3);

    // create top right and bottom left lines
    for(i = 0; i < 300; i = i + 10){
        stroke(red, green, blue);
        line( 0, i, i, 300);
        line( 300, i, i, 0);

            // randomize colors
        red = random(0,100);
        green = random(0,255);
    }
    
    // create top left and bottom right lines
    oppCount = 0;
    for(i = 300; i > 0; i = i - 10){
        stroke(red, green, blue);   
        line( i, 0, 0, oppCount);
        line( 300, i, oppCount, 300);
        oppCount += 10;
        blue +=10;
    }
}

In this project, I wanted to experiment with how form, color and temporal speed can interact with each other to create something that feels electric. The algorithm was pretty simple; depending on the position, I increased/decreased the x and y positions at the same speed to create a consistent web effect. More detail can be seen in the file comments.

Joseph Zhang – Looking Outwards – 04

Demo of Weather Thingy

Quite contrary to its comical name, Weather Thingy is a custom built sound controller that modifies the sounds from musical instruments by utilizing data from real-time weather events.

This project was created by Adrien Kaeser, a current Media and Interaction Design student at ECAL in Switzerland. The device is able to amplify or minimize the data from any one of its four sensors and add that information into any musical composition to distort it. The device was made primarily with Arduino products and coded with Arduino, and MIDI protocol.

The internal hardwiring of the device’s components

I find this project very fascinating because of its ability to take such qualitative data and make something so empathetic from it all. People often distinguish science and emotional art; Adrien was able to combine both.

Joseph Zhang –– Project –– 03 


Throughout the process of making this piece of interactive art, I was really focused on the relationship between the mouse and the shapes and how to change the temporal speed of movement. Often times, I would divide mouseX or mouseY by a number to have a slower animation than the actual speed of the mouse.

sketch

// Joseph Zhang
// Section E
// haozhez@andrew.cmue.edu
// Project-03: Dynamic Drawing

function setup() {
    createCanvas(480, 640);
}
 
function draw() {
    //Changes color depending on mouseX and mouseY position
    background(mouseY, mouseX, 200);
    noStroke();

    // resizing rectangle (left) - width increases by a factor of -mouseX / 2
    rect(480, 500, (-mouseX / 2), 60);

    // right resizing rectangle (right) - width increases by a factor of mouseX / 2
    rect(0, 100, (mouseX / 2), 60);

    // Rotating + Resizing Purple-to-Pink Rectangle
    push();
        rectMode(CENTER);
        // Trailing mouse parallax
        translate(180 + mouseX / 10, 430 + mouseY / 10);
        //Rotates rectangle depending on mouseX position
        rotate(radians(-mouseX / 3));
        //Changes color depending on mouseX position
        fill(170 + mouseX,180,210);
        //Drawing rectangle – width increases by a factor of mouseX / 4
        rect(0, 0, 160 + mouseX / 4, 160);
    pop();

    // Rotating Purple Squares
    push();
        rectMode(CENTER);
        translate(200,450);
        fill(170,160,210);
        //Rotates Rectangle depending on – mouseX position divided by 10
        rotate(radians(mouseX/10));
        //Drawing rectangle
        rect(0, 0, 130, 130);
    pop();

    // Resizing Black-to-White Ellipse
    push();
        // Trailing mouse parallax – position moves at a speed of mouseX divided by 10
        translate(200 + mouseX / 10, 200 + mouseY / 10);
        //Changes color depending on mouseX position
        fill(255 - mouseX)
        //Drawing ellipse
        ellipse(0, 0, -40 + (mouseY + mouseX) / 3, -40 + (mouseY + mouseX) / 3);
    pop();
}

Joseph Zhang – Looking Outwards – 03

Image result for rottlace mit
Rottlace Mask – MIT Media Lab

Rottlace is a 3D fabrication project built in MIT’s Media Lab by The Mediated Matter. Rottlace is a family of masks designed for Icelandic musician called Björk. The project’s form and texture pulls much of its inspiration from the human body’s various muscle-to-muscle and muscle-to-bone relationships, and in many ways, attempts to merge them together. The masks were printed by Stratasys using multi-material 3D printing, which allows complex combinations of various properties to be implemented in the construction of a single object.

Singer/Songwriter Björk wearing the mask

I chose this piece because of its mesmerizing flowing nature, and ultimately began reading more on it after realizing how complex the architectural forms of the mask truely were. To be able to design and build something so intricate yet natural is amazing. Coming from a sector of the MIT that focuses on using nature as design inspiration, I’d assume that Rottlace was built on algorithms representative of biological muscle tissue. The visionaries who built this mask have fabricated it in a way that has extracted the beautiful curves and lines found in the internal workings of nature, and replicated them through 3D form-building.

www.media.mit.edu/projects/rottlace/overview/