![[OLD FALL 2019] 15-104 • Introduction to Computing for Creative Practice](https://courses.ideate.cmu.edu/15-104/f2019/wp-content/uploads/2020/08/stop-banner.png)
//Sean Meng
//hmeng@andrew.cmu.edu
//Section C
//Final Project
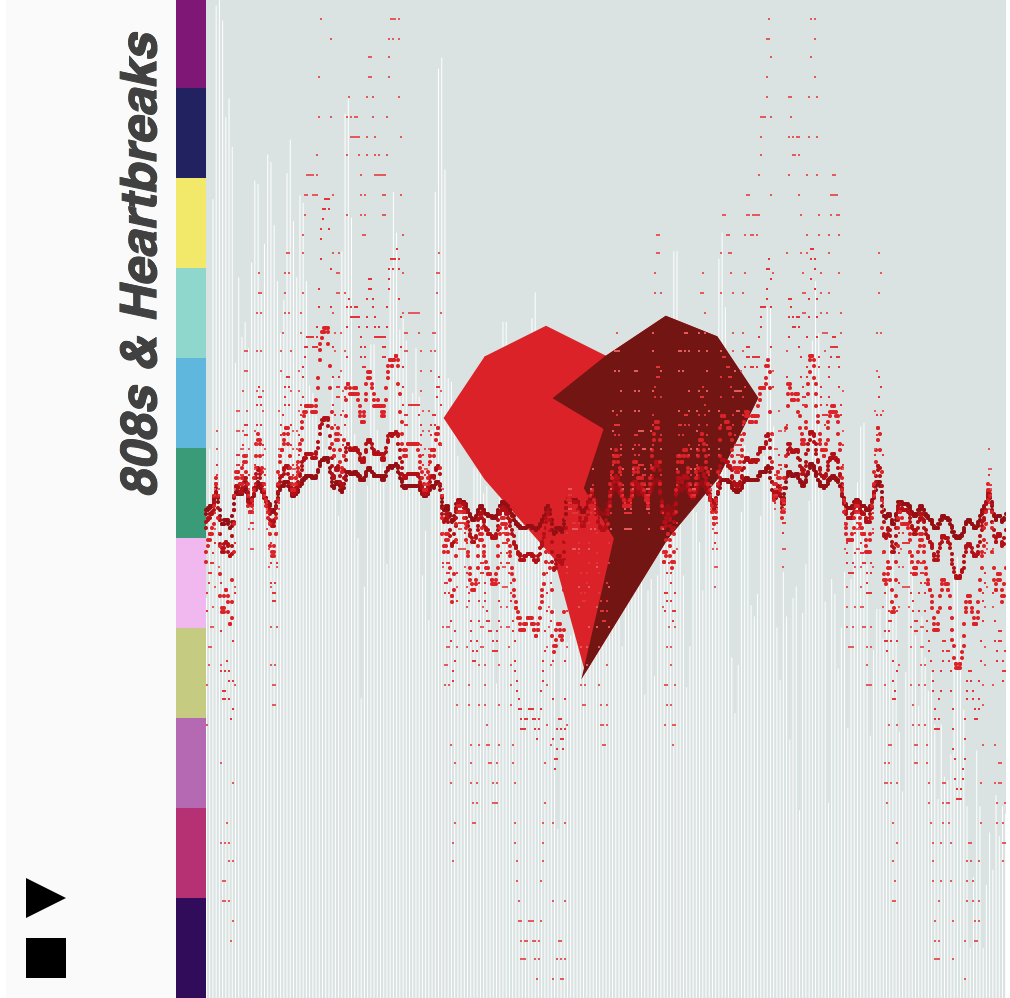
var mySoundA;
var amp;
var vol = [];
function preload() {
//Load music Love Lockdown
mySoundA = loadSound("https://courses.ideate.cmu.edu/15-104/f2019/wp-content/uploads/2019/11/Love_Lockdown-online-audio-converter.com.wav");
mySoundA.setVolume(2);
}
function setup() {
createCanvas(500, 500);
//define amplitude and frequency to visualize
amplitude = new p5.Amplitude();
fft = new p5.FFT();
mySoundA.amp(0.2);
frameRate(200);
}
function draw() {
//size of the button
var bSize = 20;
background(218, 227, 226);
noStroke();
//Album art background
fill(250);
rect(0, 0, 100, 500);
fill(128, 15, 120);
rect(85, 0, 15, 45);
fill(34, 32, 99);
rect(85, 45, 15, 45);
fill(242, 235, 97);
rect(85, 90, 15, 45);
fill(141, 214, 204);
rect(85, 135, 15, 45);
fill(92, 182, 224);
rect(85, 180, 15, 45);
fill(53, 156, 120);
rect(85, 225, 15, 45);
fill(242, 182, 241);
rect(85, 270, 15, 45);
fill(197, 204, 124);
rect(85, 315, 15, 45);
fill(181, 103, 180);
rect(85, 360, 15, 45);
fill(184, 44, 116);
rect(85, 405, 15, 45);
fill(49, 6, 92);
rect(85, 450, 15, 50);
//PAUSE button
fill(0);
rect(10, height - 30, bSize, bSize);
//PLAY button
fill(0);
triangle(10, height - 60, 10, height - 40, 30, height - 50);
//Spectrum represents amplitude
let spectrum = fft.analyze();
noStroke();
fill(255);
for (var i = 0; i< spectrum.length; i++){
let x4 = map(i, 0, spectrum.length, 100, width * 3.5);
let h4 = -height + map(spectrum[i], 0, 255, height * 0.95, 0);
rect(x4, height, width / spectrum.length, h4 )
}
//Beating heart graphic represents amplitude
let level = amplitude.getLevel();
let offset = map(level, 0, 1, 0, 80);
//draw first half of the heart
strokeWeight(2);
stroke(220, 30, 30);
fill(220, 30, 30);
beginShape();
vertex(240 - offset, 180 - offset);
vertex(270 - offset, 165 - offset);
vertex(300, 180 - offset);
vertex(330 + offset, 160 - offset);
vertex(355 + offset, 170 - offset);
vertex(375 + offset, 200);
vertex(355 + offset, 240);
vertex(330 + offset, 270);
vertex(290, 335 + offset);
vertex(275 - offset, 280);
vertex(240 - offset, 240);
vertex(220 - offset, 210);
vertex(240 - offset, 180 - offset);
endShape();
//Draw second half of the heart
strokeWeight(2);
stroke(115, 20, 15);
fill(115, 20, 15);
beginShape();
vertex(300, 180 - offset);
vertex(330 + offset, 160 - offset);
vertex(355 + offset, 170 - offset);
vertex(375 + offset, 200);
vertex(355 + offset, 240);
vertex(330 + offset, 270);
vertex(290, 335 + offset);
vertex(305 + offset, 270);
vertex(290 - offset, 245);
vertex(300 + offset, 215);
vertex(275 - offset, 200);
vertex(300, 180 - offset);
endShape();
//Five waveform that visualzie frequency
//wave A
let waveform = fft.waveform();
noFill();
beginShape(POINTS);
stroke(150, 10, 10);
strokeWeight(2);
for(var i = 0; i < waveform.length; i++){
let x0 = map(i, 0, waveform.length, 100, width);
let y0 = map(waveform[i], - 3, 3, 0, height);
vertex(x0, y0);
}
endShape();
//wave B
beginShape(POINTS);
stroke(180, 10, 10);
strokeWeight(2);
for(var i = 0; i < waveform.length; i++){
let x0 = map(i, 0, waveform.length, 100, width);
let y0 = map(waveform[i], - 1.5, 1.5, 0, height);
vertex(x0, y0);
}
endShape();
//Wave C
beginShape(POINTS);
stroke(220, 30, 30);
strokeWeight(2);
for(var i = 0; i < waveform.length; i++){
let x1 = map(i, 0, waveform.length, 100, width);
let y1 = map(waveform[i], - 0.7, 0.7, 0, height);
vertex(x1, y1);
}
endShape();
//Wave D
beginShape(POINTS);
stroke(230, 50, 50);
strokeWeight(1);
for(var i = 0; i < waveform.length; i++){
let x2 = map(i, 0, waveform.length, 100, width);
let y2 = map(waveform[i], - 0.4, 0.4, 0, height);
vertex(x2, y2);
}
endShape();
//Wave E
beginShape(POINTS);
stroke(230, 90, 90);
strokeWeight(0.5);
for(var i = 0; i < waveform.length; i++){
let x2 = map(i, 0, waveform.length, 100, width);
let y2 = map(waveform[i], - 0.2, 0.2, 0, height);
vertex(x2, y2);
}
endShape();
//Title of the album
push();
translate(75, 250);
rotate(- PI / 2);
stroke(65);
fill(65);
textStyle(BOLDITALIC);
textSize(25);
text('808s & Heartbreaks', 0, 0);
pop();
}
function mousePressed() {
//play the song when buttonA is clicked
if(mouseX > 10 & mouseX < 30 && mouseY > height - 60 && mouseY < height - 40){
mySoundA.play();
}
//pause the song when buttonB is clicked
if(mouseX > 10 & mouseX < 30 && mouseY > height - 30 && mouseY < height - 10){
mySoundA.pause();
}
} In this project, I intend to homage to my favorite artist of all time Kanye West. The project represents a visualization of his song Love Lockdown from his renowned album 808’s & Heartbreaks. The representation and graphic elements are inspired by the original album cover that designed by artist Kaws. While the beating heart visualizes the amplitude of the music, the waveforms which has a gradient of both color and stroke weight visualizes the frequency of the song. As the song goes, the frequency gets increasingly complicated and generates intriguing pattern.