Nadia Susanto – Project 07 – Curves

sketch

// Nadia Susanto
// Section B
// nsusanto@andrew.cmu.edu
// Project-07-Curves

var angle = 0;

function setup() {
    createCanvas(480, 480);
    background(220);
    angleMode(radians);
}

function draw() {
    //making the fill to be a combo of random colors
    var r = random(0, 100);
    var g = random(100, 150);
    var b = random(200, 275);
    frameRate(5);
    push();
    fill(r, g, b);
    translate(width/2, height/2); //drawn to be in the middle
    //rotating the asteroid
    angle += 1;
    rotate(angle);
    drawCurve(); //calling function
    pop();

}

function drawCurve() {
    var b = mouseY/2;
    var t = map(mouseY, 0, 200, 40, 120); //constraint

    //creating the astroid
    beginShape();
    for (var i = 0; i < 100; i++) {
      t = map(i, 0, 100, 0, TWO_PI);
      //reference from http://mathworld.wolfram.com/Astroid.html
      var x = 3 * b * cos(t) + b * cos(3 * t);
      var y = 3 * b * sin(t) - b * sin(3 * t);
      vertex(x, y);
    }
    endShape();


}

It was hard figuring out which curve to use as there were so many that were pretty, but I ended up choosing to go with the asteroid curve. I figured that a star-shaped curve could be beautiful especially when rotating. With the rotation it looks like a christmas tree star or it even looks flowerly-like. I also played around with the random colors and constrained it to be only blue/purple shades. I then used mouseX and mouse Y in order to determine the size of the asteroid. Overall, I am pretty happy with the result and it looks beautiful.
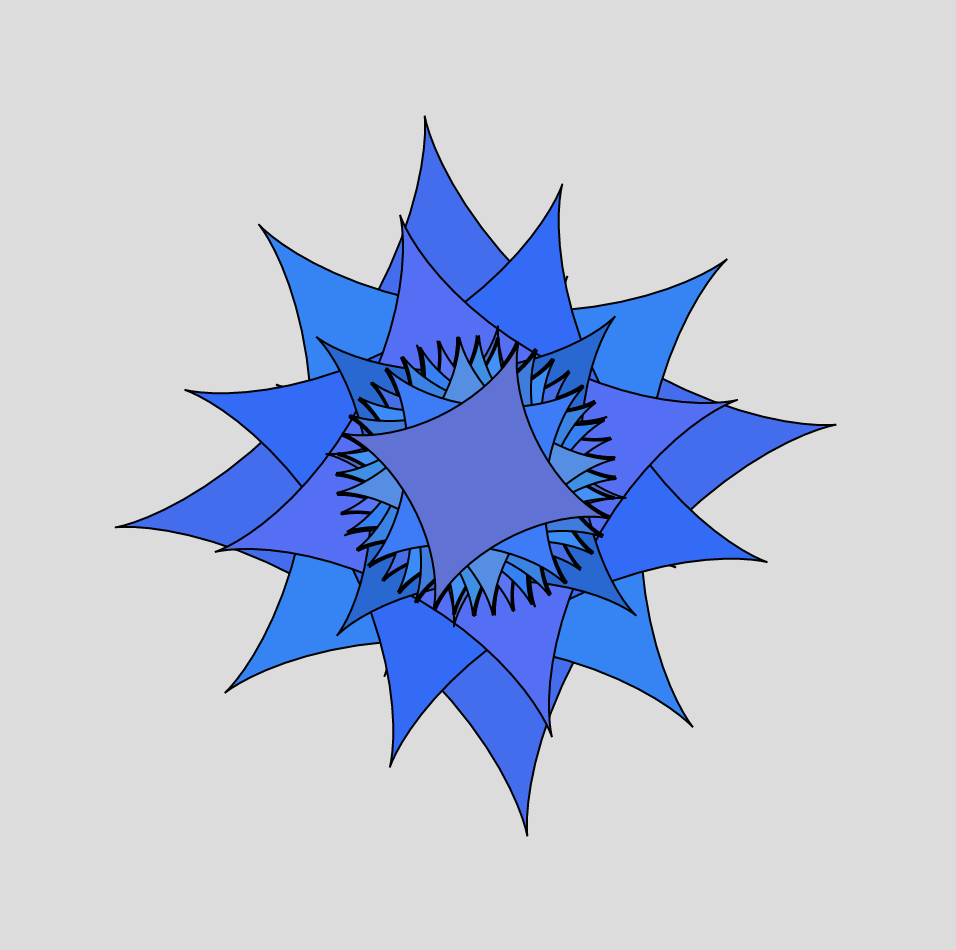
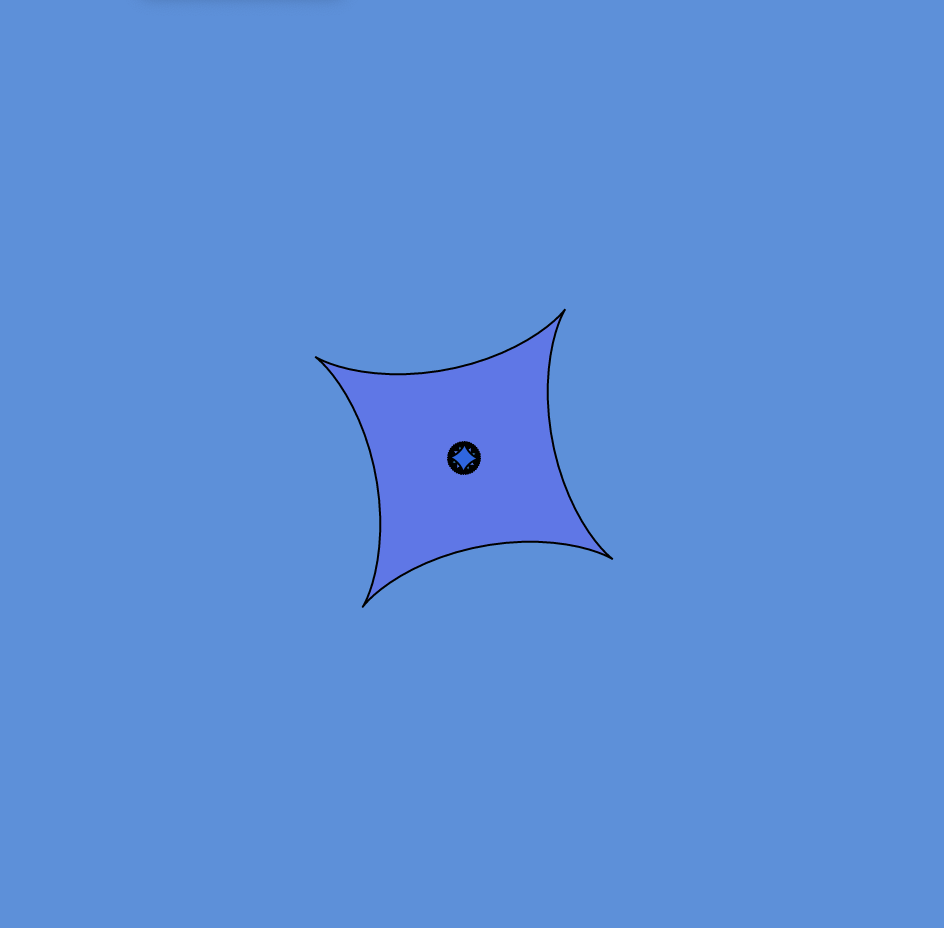
An example of this “flower-like” asteroid with multiple rotations
Another possible asteroid curve that looks like a ninja star

Nadia Susanto – Looking Outwards – 07

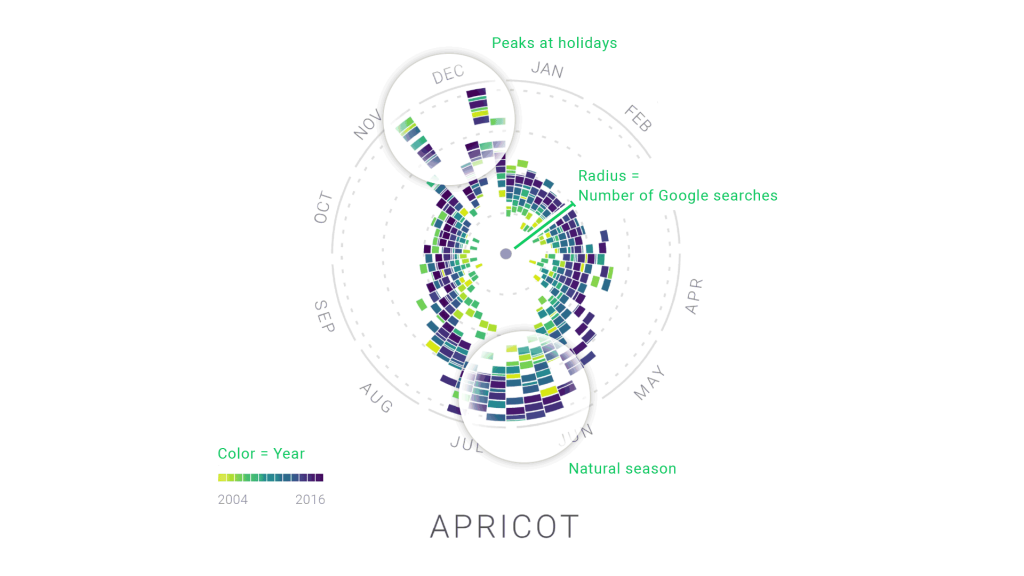
The Rhythm of Food is a visualization project led by creative director Moritz Stefaner in collaboration with Google News Lab. It takes 12 years of google search data and analyzes food seasonality. They developed a radial “year clock” chart to reveal season trends for specific food items like an apricot. The distance from the center shows the relative search interest and the different colors indicates a specific year. By having this, it allows an easier visualization of the year by year trends and rhythms.

Closer look into an example of a “clock” for apricots in which the years are shown through the various colors and the radius is clearly visible.
Video that demonstrates how the chart/”clock” should be read. It answers the question of how to go from simple bar charts to the radial chart.

In order to make this project, Moritz used many different softwares like ES2015, webpack, react, Material UI, and d3 v4. What I admire is that Moritz took something usually boring and difficult to read in chart data, but now it is very aesthetically pleasing and easy to understand.

If you want to learn more about this amazing project, click this link:

http://truth-and-beauty.net/projects/the-rhythm-of-food


Nadia Susanto – Project 06 – Abstract Clock

sketch

/* Nadia Susanto
   nsusanto@andrew.cmu.edu
   Section B
   Project-06-Abstract Clock */

   function setup() {
     createCanvas(400, 400);
     angleMode(DEGREES);
   }


   function draw() {
     background(255,255, 255);
     translate(200, 200);


     var hr = hour();
     var min = minute();
     var sec = second();

     push();
     textSize(30);
     text(nf(hr%12,2)+":"+nf(min,2)+":"+nf(sec,2) , -50, -20, 50, 100)
     pop();

     strokeWeight(4);
     var b = map(sec, 0, 60, 0, 255);
     stroke(color(100, b, 255));
     noFill();
     var secondAngle = map(sec, 0, 60, 0, 360);
     arc(0, 0, 300, 300, 0, 360-secondAngle);

     strokeWeight(5);
     var c = map(min, 0, 60, 0, 255);
     stroke(color(0, 255, c));
     noFill();

     var minuteAngle = map(min, 0, 60, 0, 360);
     arc(0, 0, 280, 280, 0, 360-minuteAngle);


     strokeWeight(3);
     var d = map(hr, 0, 60, 0, 255);
     stroke(color(d, c, b));
     noFill();
     var hourAngle = map(hr % 12, 0, 12, 0, 360);
     arc(0, 0, 260, 260, 0, 360-hourAngle);

   }

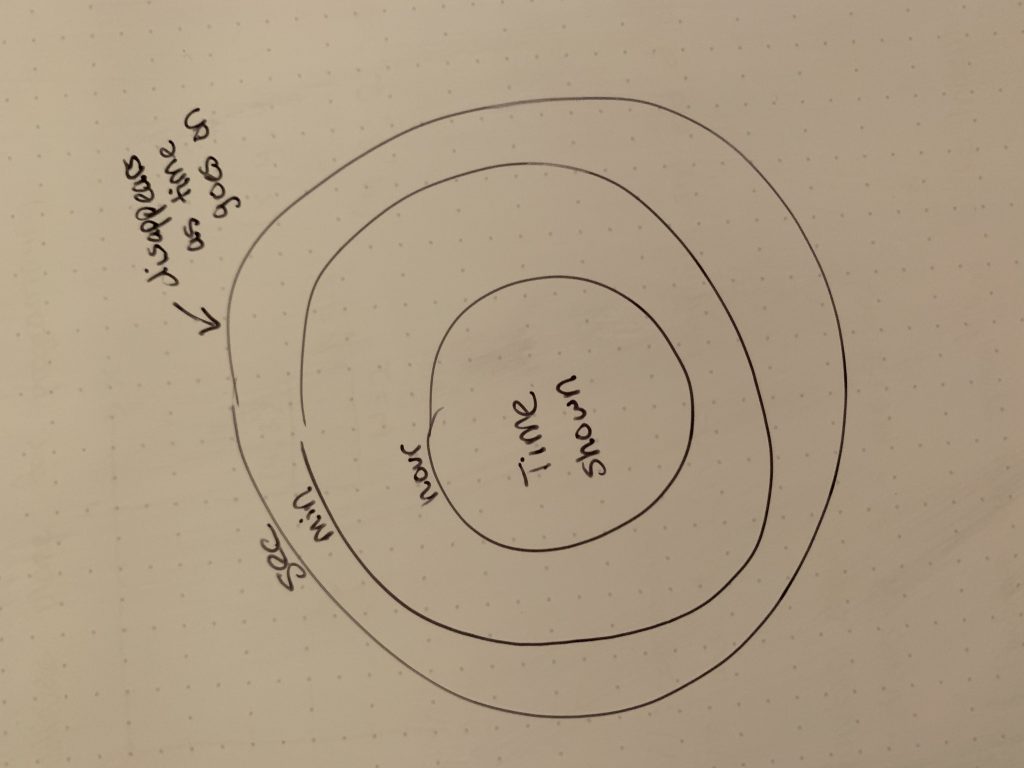
It was hard thinking of a very abstract concept, so I kept it simple. I wanted to stay simple but add the abstract element. The arc if hours, minutes, or seconds “disappears” to show the time passing by. Even though it looks simple, I think it looks pretty nice and I’m happy with the outcome.

Nadia Susanto – Looking Outwards – 06

The Mediated Matter group at the MIT Media Lab created the Silk Pavilion. This project explores the relationship between digital and biological fabrication. What makes this structure so unique is that the overall geometry was created using an algorithm that would assign threads across the patches providing various degrees of density.

Mediated Matter was inspired by the amazing silkworm and their ability to generate their own version of “3D art” out of only a single multi-property silk thread. The silkworms also create the unique randomness aspect of this as over 6500 silkworms were utilized, and this will definitely generate the random threads and patterns shown in the final product.

What I admire most about this project is that it had computation involved as the researchers did use the silkworms as a computational schema for determining shape and optimization of fiber-based surface structures. However, I am just so amazed how they brought in real-life insects to perform the art for them, not a computer that randomly generated it.

A wholistic view of the final product.
Video demonstrating the process from start to finish including the actual silkworms’ contribution to this entire process.
A closer look into how the researchers had to be up close and personal with the silkworms.

To read more about this amazing project, click the link below:

https://www.media.mit.edu/projects/silk-pavilion/overview/

Nadia Susanto – Project 05 – Wallpaper

sketch

/* Nadia Susanto
   nsusanto@andrew.cmu.edu
   Section B
   Project - 05 - Wallpaper */

function setup() {
    createCanvas(550, 550);
    background(92,160,219);
}

function draw() {
    //triangle pizza variables
    var triX1 = 50;
    var triY1 = 25;
    var triX2 = 25;
    var triY2 = 75;
    var triX3 = 75;
    var triY3 = 75;
    //pizza crust variables
    var crustX = 50;
    var crustY = 70;
    var crustW = 50;
    var crustH = 10;
    //peperoni variables
    var pepSize = 5;
    var pepX1 = 50;
    var pepY1 = 38;
    var pepX2 = 45;
    var pepY2 = 47;
    var pepX3 = 55;
    var pepY3 = 53;

    var flip = false;
    for (var triY1 = 25; triY1 < height; triY1 += 75) {
      triX1 = 50;
      triX2 = 25;
      triX3 = 75;
      pepX1 = 50;
      pepX2 = 45;
      pepX3 = 55;
      crustX = 50;
      for (var triX1 = 50; triX1 < width; triX1 += 75) {
          //cheese
          stroke(255, 241, 153);
          strokeWeight(0.5);
          fill(255,241,153);
          //upwards pizza
          if (flip == true)
          {
            triangle(triX1, triY1, triX2, triY2, triX3, triY3);
            fill(222,12,0)
            circle(pepX1, pepY1, pepSize, pepSize);
            circle(pepX2, pepY2, pepSize, pepSize);
            circle(pepX3, pepY3, pepSize, pepSize);
            //crust
            fill(226,104,60);
            ellipse(crustX, crustY+2, crustW, crustH);
            triX2 +=75;
            triX3 += 75;
            flip = false;
          }
          else { //downwards pizza
            triangle(triX1, triY2, triX2, triY1, triX3, triY1);
            fill(222,12,0);
            circle(pepX1, pepY1, pepSize, pepSize);
            circle(pepX2, pepY2, pepSize, pepSize);
            circle(pepX3, pepY3, pepSize, pepSize);
            stroke(226,104,60);
            strokeWeight(1);
            fill(226,104,60);
            ellipse(crustX, crustY-42, crustW, crustH);
            triX2 +=75;
            triX3 += 75;
            flip = true;
          }
          pepX1 += 75;
          pepX2 += 75;
          pepX3 += 75;
          crustX += 75;
    }
    triY2 += 75;
    triY3 += 75;
    pepY1 += 75;
    pepY2 += 75;
    pepY3 += 75;
    crustY += 75;
    }

}

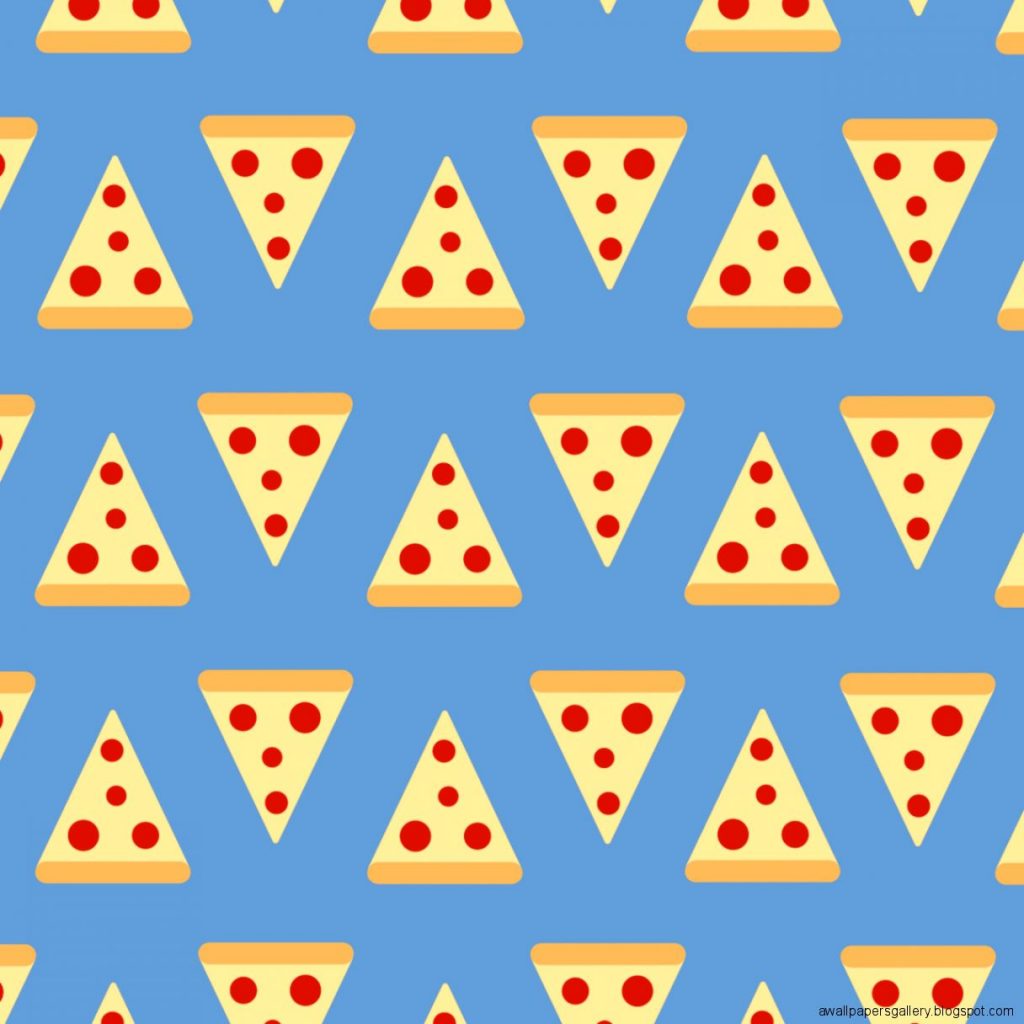
I was confused at first on what to draw, but then I became hungry and thought of pizza. I was then inspired by this pizza wallpaper I found online. I started coding first the initial pizza on the top left, then I initialized the variables using the numbers I got from my first pizza. I then incorporated for loops and other elements to flip the pizzas and make it a repeating pattern. 

Nadia Susanto – Looking Outwards – 05

“Inside Me” is a project by Dmitry Zakharov. It is based on a 3D scan technique that allows to reproduce a body image as a 3D object in a software. The artist himself scanned his own body. This piece of art is 3D computer generated and it reflects the invisible inner world of an individual. The artist was inspired by the idea of digitizing a body, hence the creation and deformation of its computer generated self, and the output reflects the digital world we live in today. He also mentioned that we humans try to express ourselves, but nobody can see through our souls.

This specific project inspires me because this art piece is literally a piece of the artist. Incorporating technology and art into describing this masterpiece was brilliant as it describes physical appearances, but also goes deep into a human’s inner self.

A video demonstrating the concept of digitizing a body and represents outer and inner human components.
A close up look of the abstract shapes to show the “inside” of the body.

If you want more information on this project, click on the link below!

https://dmitryzakharov.de/Inside-Me

Nadia Susanto – Project 04 – String Art

sketch

/* Nadia Susanto
   nsusanto@andrew.cmu.edu
   Section B
   Project 04 - String Art */


function setup() {
    createCanvas(400, 300);

}

function draw() {
    background("black");
    for (var i = 0; i < 100; i += 5) {
      //green line
      strokeWeight(1);
      stroke(29,151,98);
      //negative slope
      line(i - 50, -i, i*2, 300);

      //blue line
      strokeWeight(2);
      stroke(28,60,116);
      line(0, i + 20, width - i, i*3);

      //dark green line
      strokeWeight(3);
      stroke(1,50,36);
      //positive slope
      line(0, 350, i + 200, i*2);

      //red line
      strokeWeight(1);
      stroke(189, 3, 0);
      //right negative slope
      line(i - 50, -i, width, i + 20);
      //positive slope
      line(100, 400, 400, 50 + i*2);
      //left negative slope
      line(0, 50 + i*2, i*4, 100 + i*4);

      //yellow line
      stroke(218,149,1);
      strokeWeight(1);
      //negative slope
      line(350, i - 50, 400, 100 + i*3);
      //positive slope
      line(300, 400, 400, 100 + i*2);

    }

}

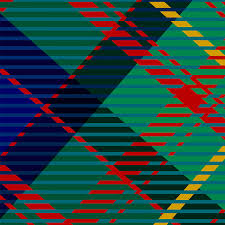
I was inspired by the tartan pattern and tried to code it similarly to this picture above. It was a challenging project because it took me a while to get used to it, but overall I am pretty happy with the result. It was fun experimenting with all the different curves and lines that can be a result of just changing a single number or variable.

Nadia Susanto – Looking Outwards – 04

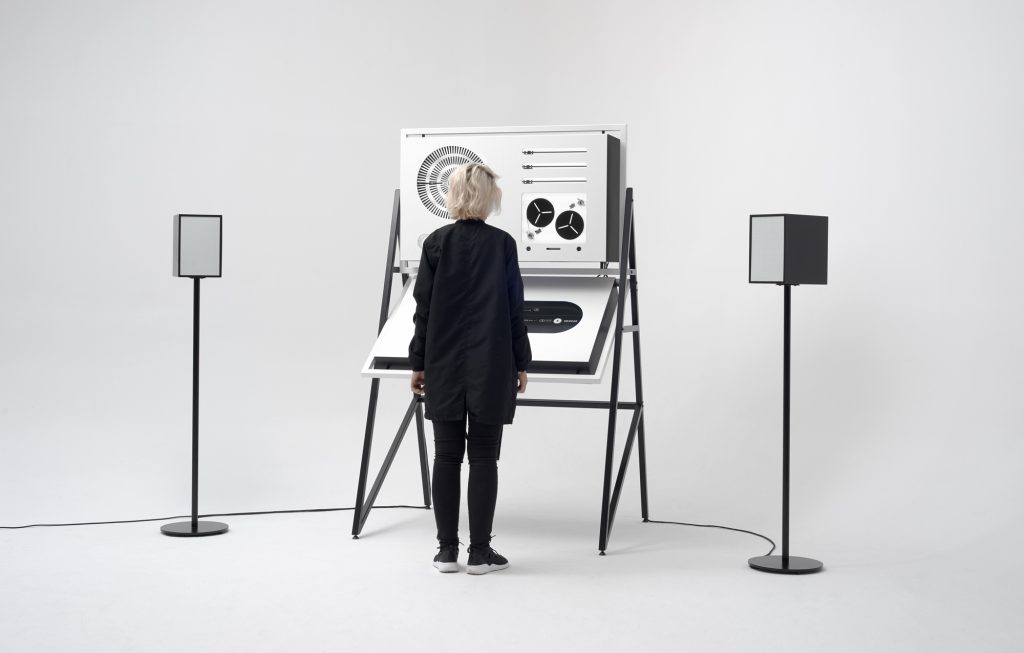
Apparatum, created by panGenerator, is a custom made apparatus with a digital interface that purely emits analogue sounds. panGenerator was inspired to build this machine because it was a reminder to the heritage of the Polish Radio Experimental Studio which was one of the very first studios in the world that produced electroacoustic music.

An overall view of the Apparatum with a user

Boguslaw Schaeffer’s “Symphony – electronic music” along with Oskar Hansen’s “Black Room” inspired the technical pieces of the machine and the aesthetic appeal of it. In the video below it is shown that a piece of paper comes out with the audio symbols, and this was created by Schaeffer who conceived his own visual language of symbols that were cues for the sound engineer to produce.

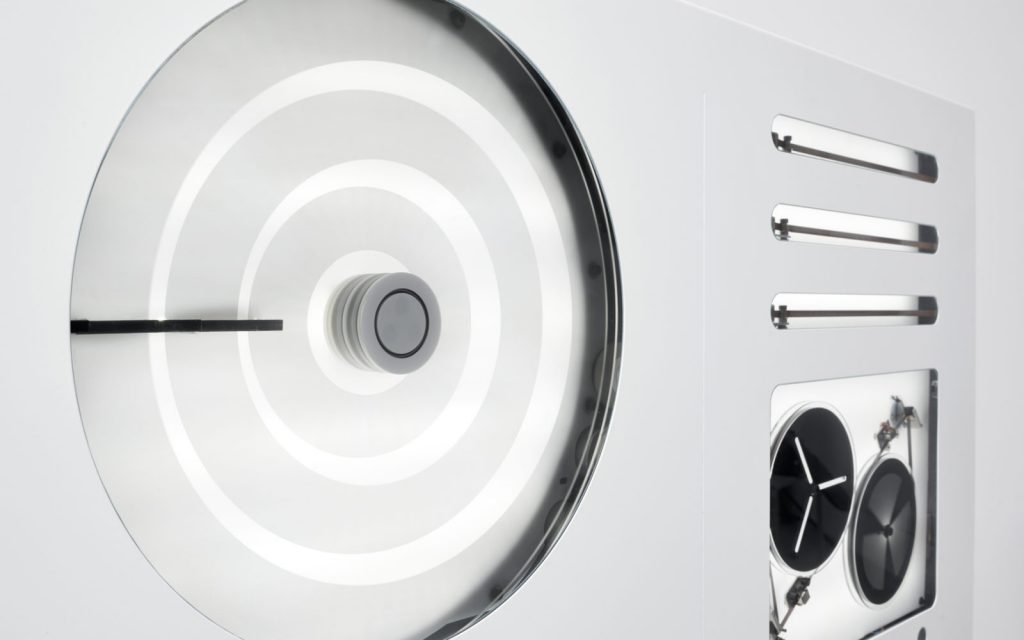
The build of the Apparatum itself was very complex with many components including tape samplers and optical generators. What I admire about this is that the physical machine is art in itself especially with the black and white aesthetic, but with the audio features its incredible to see a machine create sound like that.

A closer look into the detailed components of the Apparatum
A video demonstrating the components of the Apparatum, how the machine is used, and the results from the machine.

For more on the full story, click on the link below.

https://www.creativeapplications.net/sound/apparatum-installation-inspired-by-the-polish-radio-experimental-studio/

Nadia Susanto – Project 03 – Dynamic Drawing

sketch

/* Nadia Susanto
   Section B
   nsusanto@andrew.cmu.edu
   Project-03-Dynamic Drawing */

var angle = 0;

function setup() {
    createCanvas(640, 480);

}

function draw() {
    background("black");

    //background color changes dependent on mouseX
    if (mouseX > width/2) {
      background(0, 0, 88);
    }

    noStroke();
    //sun
    fill(255, 216, 0);
    ellipse(320, 240, 150, 150);
    //mercury (in solar system is fastest to orbit sun)
    fill(223, 126, 83);
    push();
    translate(320, 240);
    rotate(radians(angle*2.5));
    ellipse(50, 50, 50, 50);
    pop();
    //venus (in solar system is 2nd fastest to orbit sun)
    //rotates counter-clockwise
    fill(222, 184, 135);
    push();
    translate(320, 240);
    rotate(radians(-angle*1.5));
    ellipse(75, 100, 75, 75);
    pop();
    //earth (in solar system is 3rd fastest to orbit sun)
    fill(57, 118, 40); //green circle
    push();
    translate(320, 240);
    rotate(radians(angle));
    ellipse(150, 100, 100, 100);
    pop();
    //mars (in solar system is 4th fastest to orbit sun)
    fill(165, 42, 42);
    push();
    translate(320, 240);
    rotate(radians(angle*0.5));
    ellipse(200, 100, 85, 85);
    pop();
    angle = angle + 1

    //new planet size dependent on mouseX and mouseY
    // supposed to resemble neptune, uranus, or pluto (very slow to orbit)
    if (mouseX > 395 || mouseY > 315) {
    fill(30, 144, 255);
    push();
    translate(320, 240);
    rotate(radians(angle/4));
    circle(width-mouseX, height-mouseY, height - mouseY, 150);
    }

    //comet can move in regards to mouse movement
    if (mouseX < 250 & mouseY < 300) {
      fill(255, 100, 0);
      triangle(mouseX, mouseY, mouseX, mouseY*2, mouseX*4, mouseY*4);
      fill(119,136,153);
      ellipse(mouseX*4, mouseY*4, mouseX, mouseY);
    }

    //blackhole spins when pressed
    if (mouseIsPressed) {
      fill("black");
      push();
      translate(320, 240);
      rotate(-angle);
      ellipseMode(CENTER);
      ellipse(150, 100, 640, 480);
      pop();
      angle = angle + 5
    }

}

I was inspired by the solar system, so I tried having multiple planets shown with its orbit around the sun and made each speed correspond to how fast or slow they actually orbit the sun in real life. There is a comet shown with certain mouse directions and I tried to make it move with the mouse. If clicked on, I also incorporated a spinning black hole to “terrorize” the universe. Overall, the process was tough as I was not used to the push pop rules and rotation and translation, but I am happy with the finished product.

Nadia Susanto – Looking Outwards – 03

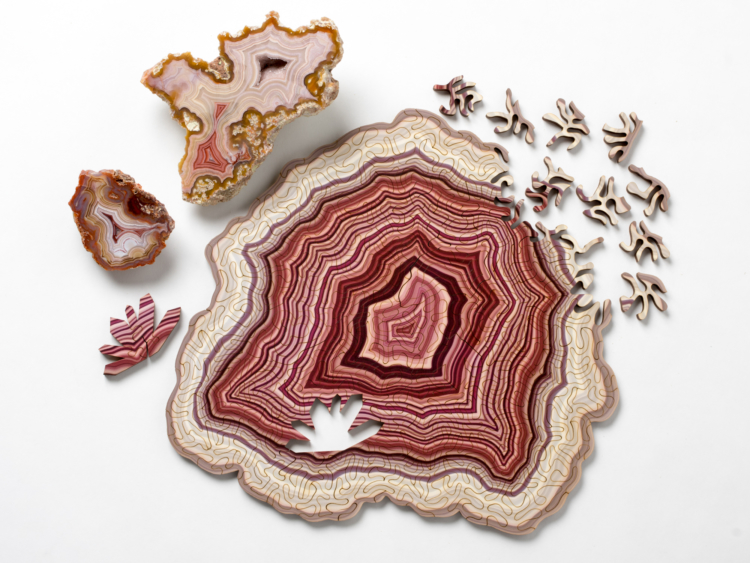
Nervous System is a generative art studio and one of their most viral projects is their geode jigsaw puzzles. Each puzzle has a unique computer-generated shape and pattern, resulting in the many types of geode puzzles. While each geode turns out unique, the process of computer generation is similar as they code it so that the rock used will grow progressively inwards and fill the chamber. Colors, characteristics, and growth rates are random which results in the unique puzzles. Each of the computer generated images represents a portion of the algorithmic agate.

What I admire most about this project is that its beautiful in its art form, but since its a puzzle it requires logical problem-solving skills. Most puzzles have an outcome that is a rectangular picture, so it is easy to establish the corners and the outside borders. However in this case you would have to work from inside to out, not having any easy puzzle pieces to go off from.

This video from Nervous System gives a summary of their geode puzzles from how they made them to what ta unique puzzle looks like.
A wholistic picture of the puzzle. The final result of the puzzle is a beautiful piece of art, but so many intricate pieces are needed to make it.
A closer look into the laser-cutted individual pieces needed for the geode jigsaw puzzle.
For more information on this specific project, click the link above to go to their blog about their jigsaw puzzles.