Sean Leo_Final Project

TEST CARD GENERATOR

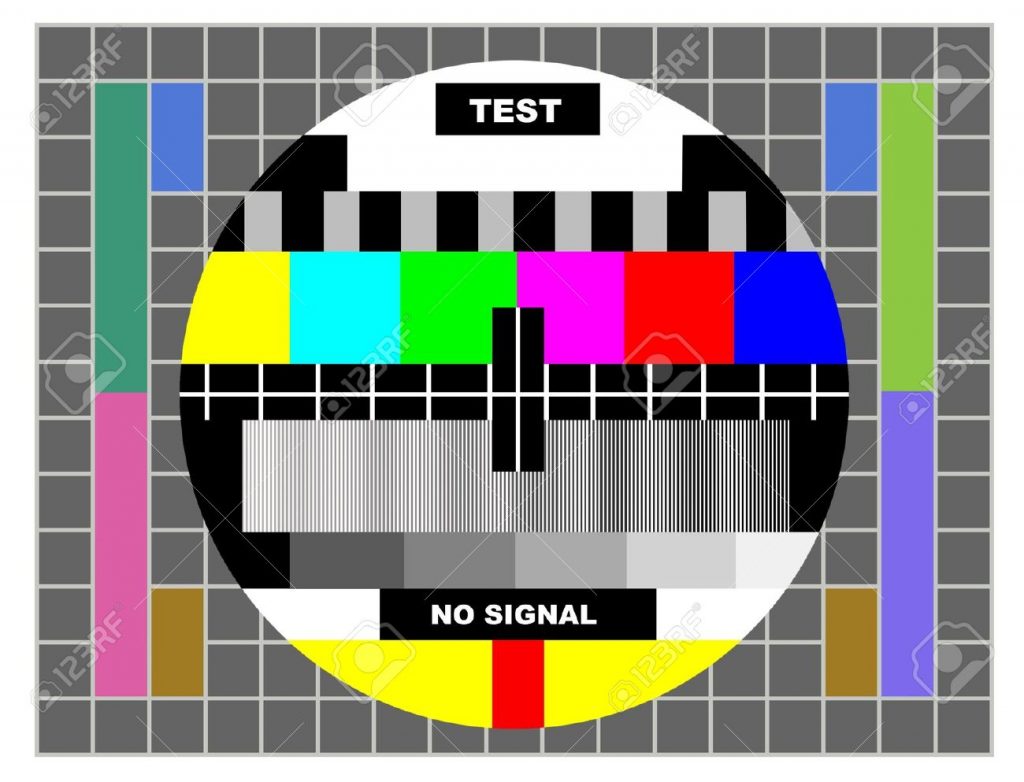
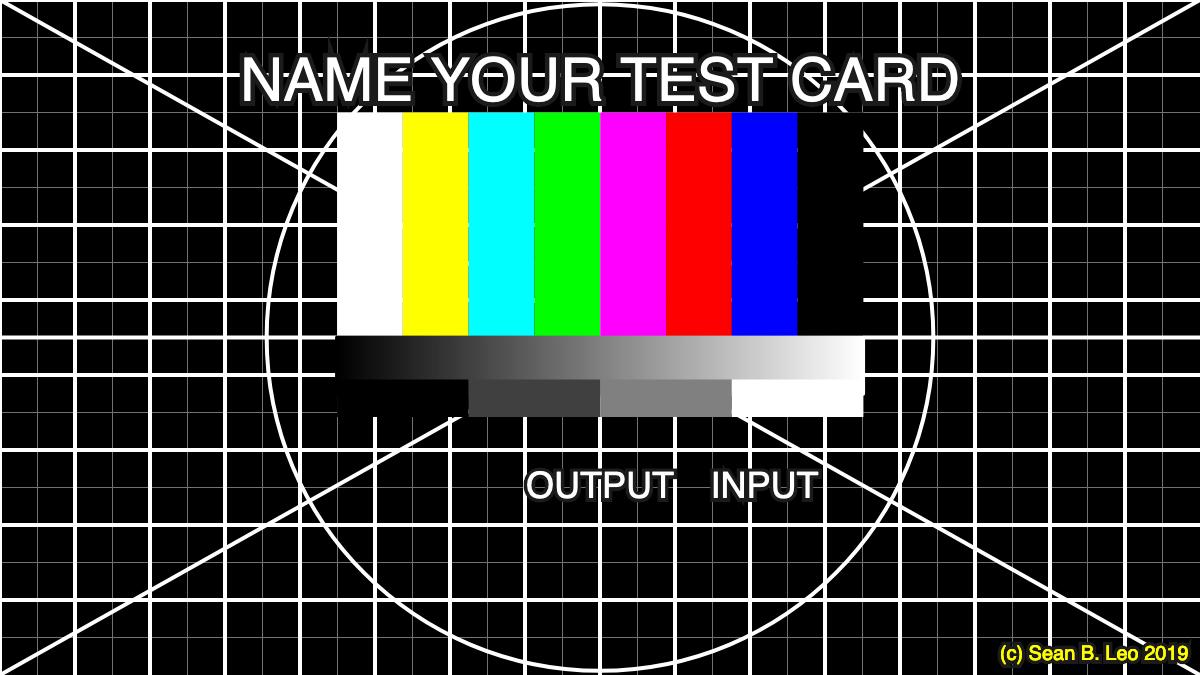
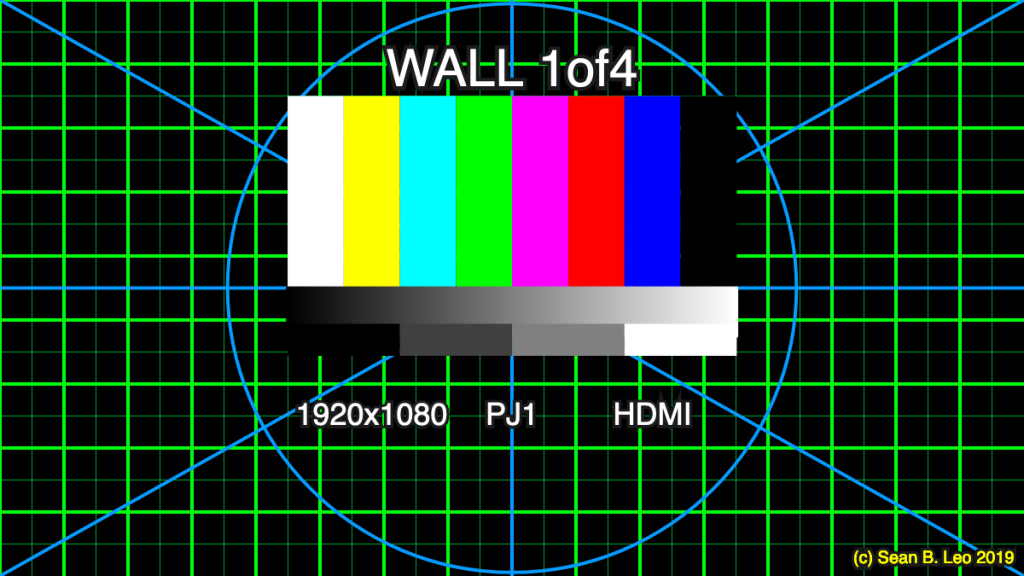
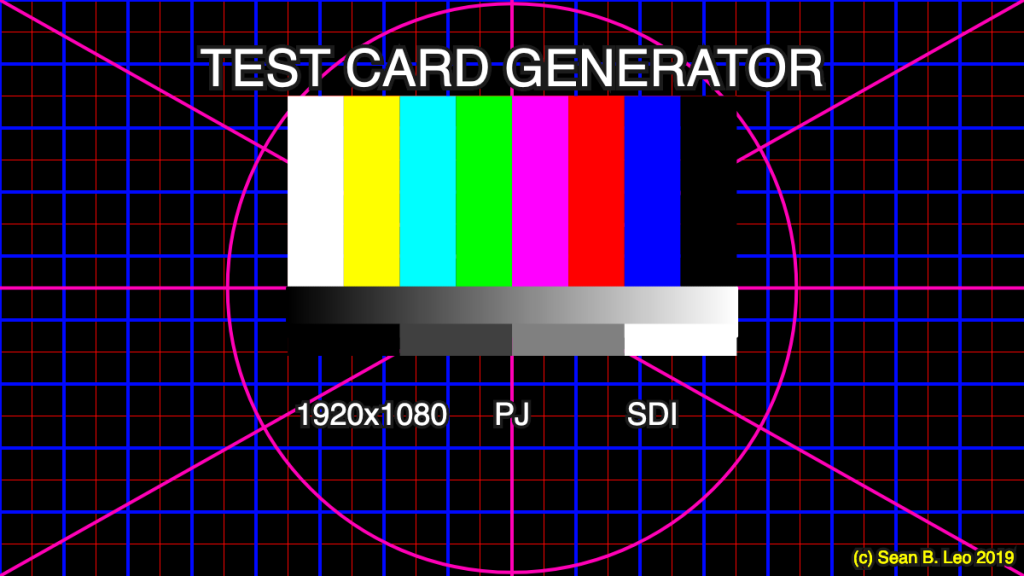
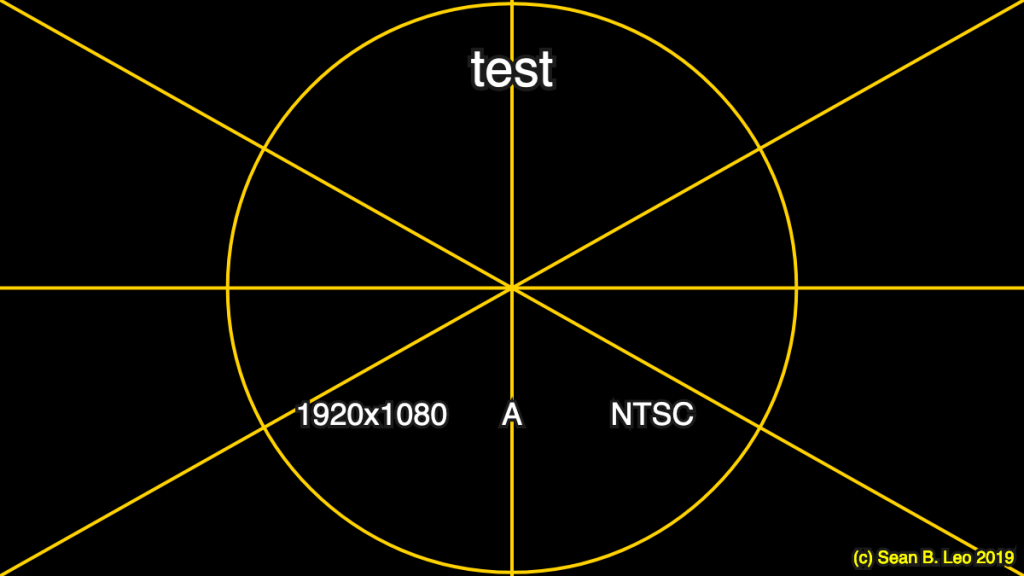
The Test Card Generator (TCG) allows you to create a customizable Test pattern to use for testing outputs for a media installation. You can select HD or SD (1920×1080 or 1280×720) which will populate on your card. Then using the input fields you can type in what you’d like the card to say. Provided is a field for a title and labeling the output and input; a Projector using SDI, for example. You can also color the grid lines to further customize and is extremely helpful with multiple outputs. Un-checking the boxes will take away some of the graphic elements to further customize the look of the card. Lastly clicking save will save a PNG titled with the name and selected resolution to your downloads folder.

As a media designer, I’m often faced with ambitious projects and installations that call for multiple outputs and sources of media. In a room with wrap around projections seeing the same test pattern everywhere doesn’t help you understand how your system is working and what is media is being feed to what. A tool like TCG allows me to quickly test multiple output sources and customize the look based on version, show, or whatever I feel like I need shown.

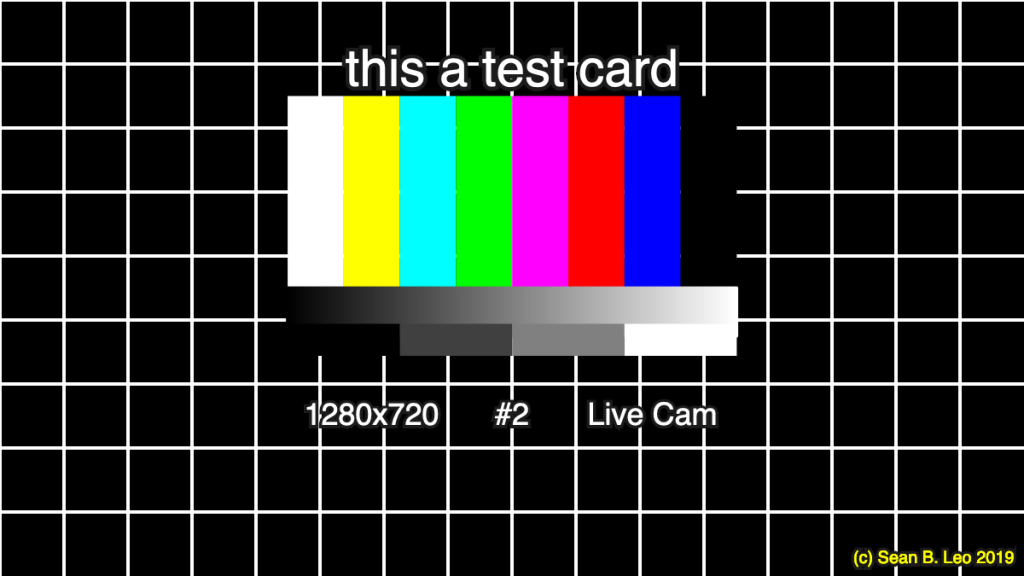
Below are some of the customizable test cards I generated:

thisatestcard_1280x720.png
WALL1of4_1920x1080.png
TESTCARDGENERATOR_1920x1080.png
test_1920x1080.png

sleo_finalProject_20191205

//Sean B. Leo
//sleo@andrew.cmu.edu
//Section C 
//FINAL PROJECT

//TEST CARD GENERATOR___________(c) Sean B. Leo 2019
/*The TCG allows you to create a customizable Test pattern 
to use for testing outputs for a media installion. You can 
select HD or SD (1920x1080 or 1280x720) which will populate on your card.
Then using the input fields you can type in what you'd like the card to say.
Provided is a field for a title and labeling the output and input; 
a Projector using SDI for example. You can also color the grid lines to further
customize and is extremly helpful with multiple outputs. 
Un-checking the boxes will take away some of the graphic elements
to further customize the look of the card. 
Lastly clicking save will save a PNG titled with the name and selected resolution 
to your downloads folder.*/

//Global variables
//aspect ratio
var aspectX = 16;
var aspectY = 9;
// grid color variables
var colorInp1, colorInp2;
//gradient color variables
var c1, c2;
//grid slider
var gridSlider;
var spacing = 0;
//element dimensions
var colW;
var colH;
var rowW;
var rowH;
//radio varibile
var radio;


function setup() {
//radio options set for HD and SD    
radio = createRadio(); 
radio.option('1920x1080');// HD
radio.option('1280x720');// SD
//canvas sized to fit within WP window
createCanvas(600, 337.5);
colorMode(RGB);
//Color picker input for elements
colorInp1 = createColorPicker('#ffffff'); //set to white at start
colorInp1.position(360,height+30);
colorInp2 = createColorPicker('#727272'); //set to gray at start
colorInp2.position(420,height+30);
colorInp3 = createColorPicker('#ffffff'); //set to white at start
colorInp3.position(480,height+30);
//black and white gradient color  
c1 = color(0);
c2 = color(255);
//Title for test card
textInp1 = createInput('NAME YOUR TEST CARD');
textInp1.size(150, 20);
textInp1.position(0,height+30);
//label output (projector, screen, etc.)
textInp2 = createInput('OUTPUT');
textInp2.size(100, 20);
textInp2.position(150,height+30);
//label input (HDMI, DVI, SDI, etc.)
textInp3 = createInput('INPUT');
textInp3.size(100, 20);
textInp3.position(250,height+30);
//Save custom test card
button = createButton('Save Test Card');
button.position(420, height+60);
button.mousePressed(saveImage);
//graphic element sizing
colW = width/2.28/8;
colH = height/3;
barStartX = width/3.56;
barStartY = height/6;  
//turn off or on elements
toggleGrid = createCheckbox('Grid', true);//set as on from start
toggleGrid.changed(toggleSet);
toggleGrid.position(0, height+60);

toggleLines = createCheckbox('Lines', true);
toggleLines.changed(toggleSet);
toggleLines.position(60, height+60);

toggleColor = createCheckbox('Color Bars', true);
toggleColor.changed(toggleSet);
toggleColor.position(120, height+60);

toggleGrad = createCheckbox('Black and White', true);
toggleGrad.changed(toggleSet);
toggleGrad.position(210, height+60);
}
function saveImage(){    
radioXY = radio.value(); // read radio value as variable
var title = textInp1.value() +"_" + radioXY; //set file name from custom inputs
if (button.mousePressed()){
    saveCanvas(title,'png');
    }
}
function draw() {
background(0);
toggleSet();
textBlocks();
}
function toggleSet(){
//turn off or on element functions based on state of checkbox    
if (toggleGrid.checked()) {
  grid();
  }
if (toggleLines.checked()) {
  lines();
  }
if (toggleColor.checked()) {
  colorBars();
  } 
if (toggleGrad.checked()){
  gradient();
  }
}
function grid(){
//draw grid    
var gridColorTop = colorInp1.color();//set grid color based on selection
var gridColorBot = colorInp2.color();//set grid color based on selection
var gridStrokeTop = 2;
var gridStrokeBot = .5
var x = spacing;
var y = spacing;
//bottom grid loop
for (var x = 0; x < width; x += width / (aspectX*2)) {
  for (var y = 0; y < height; y += height / (aspectY*2)) {
    stroke(gridColorBot);
    strokeWeight(gridStrokeBot);
    line(x, 0, x, height);
    line(0, y, width, y);
    }
  }
//top grid
for (var x = 0; x < width; x += width / aspectX) {
  for (var y = 0; y < height; y += height / aspectY) {
    stroke(gridColorTop);
    strokeWeight(gridStrokeTop);
    line(x, 0, x, height);
    line(0, y, width, y);
    }
  }
}
function lines(){    
var lineColor = colorInp3.color();//set color based on selection
stroke(lineColor);
strokeWeight(2);
//diagonals
line(0, 0, width, height);
line(width, 0, 0, height);
noFill();
//cross lines
line(width/2, 0, width/2, height);   
line(0, height/2, width, height/2); 
//circle
ellipse(width/2, height/2, width/1.8);
}
function colorBars(){
//SMPTE color bars
noStroke();
fill('white');
rect(barStartX, barStartY, colW, colH);
fill('yellow');
rect(barStartX+colW, barStartY, colW, colH);
fill('cyan');
rect(barStartX+colW*2, barStartY, colW, colH);
fill(0, 255, 0);
rect(barStartX+colW*3, barStartY, colW, colH);
fill('magenta');
rect(barStartX+colW*4, barStartY, colW, colH);
fill('red');
rect(barStartX+colW*5, barStartY, colW, colH);
fill('blue');
rect(barStartX+colW*6, barStartY, colW, colH);
fill('black');
rect(barStartX+colW*7, barStartY, colW, colH);
}
function setGradient(x, y, w, h, c1, c2) {
//creates gradient    
noFill();
for (var i = x; i <= x + w; i++) {
  var inter = map(i, x, x + w, 0, 1);
  var c = lerpColor(c1, c2, inter);
  stroke(c);
  line(i, y, i, y + h);
  }
}
function gradient(){
//gradient block
//calls gradient and creates shape
setGradient(barStartX, height/2, colW*8, colH/4, c1, c2);
//grayscale blocks
noStroke();
fill(0);
rect(barStartX, height/1.779, colW*2, colH/6);
fill(255/4);
rect(barStartX+colW*2, height/1.779, colW*2, colH/6);
fill(255/2);
rect(barStartX+colW*4, height/1.779, colW*2, colH/6);
fill('white');
rect(barStartX+colW*6, height/1.779, colW*2, colH/6);
}
function textBlocks() {
radioXY = radio.value();
fill(255);
textSize(30);
textAlign(CENTER, CENTER);
stroke(27);
strokeWeight(5);//set against grid pattern for better legibility
//takes in first text value to display at top of canvas
text(textInp1.value(), width/2, barStartY-barStartY/4);
strokeWeight(4);
//textSize(18);
//takes in radio button value to set text on canvas
textSize(18);
text(radioXY, width/2 - colW*2.5, barStartY*4.35);
//second text value 'OUTPUT'
textSize(18);
text(textInp2.value(), width/2, barStartY*4.35);
//third text value 'INPUT
textSize(18);
text(textInp3.value(), width/2 + colW*2.5, barStartY*4.35);
//Signing my work
textSize(10);
fill('yellow');
text('(c) Sean B. Leo 2019', width-colW-20, height-10);
}

Sean Leo – Project Proposal

Often during installations as a media designer, you work in unique environments where the technical demands of a system are very specific. I’ve come to find that many programs supply their own stock branded test card that doesn’t reflect the complexity or scope of the project. As I’ve built custom systems and done shows with multiple outputs I’ve realized a need for more customization with the test cards I use.

For my final project in 15104, I’d like to create a test card generator of my own design. Essentially this entails creating a responsive template that accounts for size, and having custom inputs; text, color, maybe even image. My list of features for this project are:

  • Custom resolution as an input field.
  • Custom color palette
  • Scalable grid sizing
  • Text input
  • Export as an image file.

Sean Leo – Project 11 – generative skyscape

sleo-project_11

//Sean B. Leo
//sleo@andrew.cmu.edu
//Section C

//Project 11 - generative landscape
var terrainSpeed = 0.0005;
var terrainDetail = 0.001;
var clouds = []; //background clouds
var clouds2 = []; //foreground clouds
var c1, c2;

function setup() {
  createCanvas(480, 480);
    for (var i = 0; i < 10; i++){
        var rx = random(width);
        clouds[i] = makeClouds(rx);
        clouds2[i] = makeClouds2(rx);
    }
   frameRate(30);
}

function draw() {
  //background gradient colors
  c1 = color(40, 90, 255,10);
  c2 = color(250, 250, 240);
  setGradient(c1, c2);
   
    updateClouds();
    removeClouds();
    addRandomClouds(); 
    
}

function setGradient(c1, c2) {
  noFill();
  for (var y = 0; y < height; y++) {
    var inter = map(y, 0, height, 0, 1);
    var c = lerpColor(c1, c2, inter);
    stroke(c);
    line(0, y, width, y);
  }
}


function updateClouds(){
    // Update the cloud positions
    for (var i = 0; i < clouds.length; i++){
        clouds[i].move();
        clouds[i].display();
    }
  for (var i = 0; i < clouds2.length; i++){
        clouds2[i].move();
        clouds2[i].display();
    }
}


function removeClouds(){
  var cloudsToKeep = [];
   var cloudsToKeep2 = [];
    for (var i = 0; i < clouds.length; i++){
        if (clouds[i].x + clouds[i].breadth > 0) {
            cloudsToKeep.push(clouds[i]);
        }
    }
    clouds = cloudsToKeep;
  for (var i = 0; i < clouds2.length; i++){
        if (clouds2[i].x + clouds2[i].breadth > 0) {
            cloudsToKeep2.push(clouds2[i]);
        }
    }
  clouds2 = cloudsToKeep2;
}


function addRandomClouds() {
    // probability of new cloud
    var newCloudLikelihood = 0.01; 
    if (random(0,1) < newCloudLikelihood) {
        clouds.push(makeClouds(width));
      clouds2.push(makeClouds2(width));
    }
}


//cloud positions
function cloudMove() {
    this.x += this.speed;
}
    

//draw clouds
function cloudDisplay() {
    //var bHeight = this.x; 
    fill(230, 230, 230, 155); 
    noStroke(); 
  
    push();
    translate(this.x, this.y+20);
    ellipse(0, 0, this.d/2, this.d/3);
    fill(220, 220, 220, 155); 
    noStroke();
    ellipse(0 - 10, 0 + 5, this.d*2, this.d* 1.3);
    fill(240, 240, 240, 190); 
    noStroke();
    ellipse(0 + 15, 0, this.d*1.2, this.d/2);
    pop();
}
function cloudDisplay2() {
    //var bHeight = this.x; 
    fill(255, 255, 255, 200); 
    noStroke(); 
    push();
    translate(this.x, this.y+20);
    ellipse(0, 0, this.d*1.1, this.d/1.2);
    fill(245, 245, 245, 200); 
    noStroke();
    ellipse(0 - 10, 0 + 5, this.d*3, this.d/ 1.3);
    fill(255, 255, 255, 200); 
    noStroke();
    ellipse(0 + 15, 0, this.d*1.2, this.d/2);
    pop();
}

function makeClouds(birthLocationX) {
    var cloud = {x: birthLocationX,
                y: random(0, height / 2),
    	        d: random(20, 80),
                breadth: 100,
                speed: -.1,
                move: cloudMove,
                display: cloudDisplay}
    return cloud;
}
function makeClouds2(birthLocationX) {
    var cloud2 = {x: birthLocationX,
                y: random(0, height / 2),
    	        d: random(20, 80),
                breadth: 100,
                speed: -.1,
                move: cloudMove,
                display: cloudDisplay2}
    return cloud2;
}


Sean Leo – project 09 – Portrait

sleo-project-09

//Sean B. Leo
//Sleo@andrew.cmu.edu
//Section C

//Project 09 Portrait

function preload() {
    var myImageURL = "https://static.wixstatic.com/media/b109e8_9226598d042f4ca2b17fd70a4e0d7319~mv2.jpg/v1/fill/w_572,h_680,al_c,q_85,usm_0.66_1.00_0.01/b109e8_9226598d042f4ca2b17fd70a4e0d7319~mv2.webp"; 
  
    IMG = loadImage(myImageURL);

}

function setup() {
    createCanvas(480, 480);
    background(0);
    IMG.loadPixels();
    frameRate(60);
  imageMode(CENTER);
}

function draw() {
    var px = random(width);
    var py = random(height);
    var ix = constrain(floor(px), 0, width-1);
  //print (ix);
    var iy = constrain(floor(py), 0, height-1);
  //print(iy);
    var rx = px + random(0,10); // randomize x-value
    var ry = py + random(0,10); // randomize y-value
    var rs = random(1,10); // randomize stroke weight
    var theColorAtLocationXY = IMG.get(ix, iy);

    strokeWeight(rs);
    stroke(theColorAtLocationXY);
    line(px,py,rx,ry);
}

Starting
Mid-render
Original Photo

Sean Leo – Project 06 – Abstract Clock

sleo-project-06

//Sean B. Leo
//sleo@andrew.cmu.edu
//Section C

//Project 6
//Abstract Clock

function setup() {
    createCanvas(600, 600);
    pixelDensity(1);
    frameRate(1);
  }
  
  function draw() {
    
    var S = second();
    var M = minute();
    var H = hour();
    
    var s1 = map(S, 0, 60, 0, 255);
    var m1 = map(M, 0, 60, 0, 255);
    var h1 = map(H, 0, 24, 0, 255);
    
    
    loadPixels();
    for(var y=0; y<400; y++){
      for(var x=0; x<400; x++){
        var index= (x + y *width)*4;
        pixels[index+0] = y-m1;
        pixels[index+1] = h1;
        pixels[index+2] = x-s1;
        pixels[index+3] = 255;
      }
    }
    
    updatePixels();
  
  }

I started thinking about abstracting the concept of time itself. Instead of viewing time as an exacting and regimented number, what if it could be displayed more like a feeling or mood? What if by looking at a display we could have a sense of the passing of time rather than knowing what time it is exactly?

I created a color field that adjusts it’s rgb values over time through a pixel array. No second is the same composition as the next though the change is subtle. Below you can see the progression of time over the day and familiar timestamps.

I think there are a lot of artistic applications of this project; mainly using the generated color field as a light source. Rather than a reading of time in a specific format: a watch, wall clock, microwave, etc. A lamp emitting the color field would affect the room it is in a subtly convey time passing.

8:30am
noon
6:30pm
midnight

Sean Leo – Project 05 – Wallpaper

For my wallpaper I thought to use a textile pattern I was familiar with. Houndstooth is useful in that it can be scaled to be very small or abstractly large.

sleo-wallpaper

//Sean B. Leo
//sleo@andrew.cmu.edu
//Section C
//Project 05 Wallpaper

var x1 = 10; //changing the value of x1 will change the scaling of the pattern
var x2 = x1*2;
var x3 = x1*3;
var x4 = x1*4;
var y1 = x1;
var y2 = y1*2;
var y3 = y1*3;
var y4 = y1*4;
var value = 0;

function setup() {
  createCanvas(600, 600);
}
function draw() {
  noStroke();
  background(255);
  //Scales the color based on the mouse position
  r = map(mouseX, 0, width, 0, 200); 
  g = map(mouseX/mouseY, 0, 600, 0, 200);
  b = map(mouseY, 0, height, 0, 200);
  for (var x = 0; x < width+x1; x += x1*4) {
    for (var y = 0; y <height+y1; y += y1*4) {
    houndstooth (x-30, y-30);
    }
  }
}
function houndstooth(x,y) {
  fill(r, g, b);
  push();
  translate(x, y);
  rect(x2, y2, x2, y2); 
  quad(0, y4, x2, y2, x2, y3, x1, y4);
  quad(x2, y4+y1, x3, y4, x4, y4, x2, y4+y2);
  triangle(x3, y2, x4, y1, x4, y2); 
  triangle(x4, y2, x4+x1, y2, x4, y3);
  pop();
}
/* the original coordinate positions draw to determine the relative values
  rect(50, 50, 50, 50); 
  quad(0,100, 50, 50, 50, 75, 25, 100);
  quad(50, 125, 75, 100, 100, 100, 50, 150);
  triangle(75, 50, 100, 25, 100, 50); 
  triangle(100, 50, 125, 50, 100, 75);
*/

Sean Leo – Looking Outwards 05

Alan Warburton – East Tower, 2016

East Tower. gif 2016 – sequence of modeled floors of the BBC East Tower by Alan Warburton

In 2016, artist Alan Warburton was accepted into a residency by White Noise City, that placed artists into the BBC East Tower, soon to be demolished to make way for a new development. Warburton created a virtual replica based on documentation of the site in mid-2016 that restored the building to an ideal state. 

Not only is his replica incredibly photo-realistic, it is also free. Often digital assets, of this quality and scale, would be priced with a professional market in mind. By releasing it for free, Warburton enacts a radical and democratic action.  He states on his website, that the model  ” can be used for any purpose, with the hope that the real-life 20th century space continues to live on in 21st century digital animation, virtual reality, architecture, 3D printing and games.”

He created the model using Maya and Vray.

East Tower, 2016 – Digital Render

Sean Leo – Project 04 – String Art


This learning curve on this was step (pun intended) but once I realized I could copy and rotate the different parts it was smooth sailing.

sleo-project04

//Sean B. Leo
//sleo@andrew.cmu.edu
//Section C
//Project 04
var x1 = 0;
var y1 = 0;
var x2 = 0; 
var y2 = 350;
var x2step = 11; 
var y1step = 4;

function setup() {
  createCanvas(400, 300);
  background(0);
  strokeWeight(.6);
}

function draw() {
//first curve
stroke('blue');
for(var i=0; i<1; i++){
    line(x1, y1, x2, y2);
    y1+=y1step;
    x2+=x2step;
}
//blue curve translated, rotated and colored
push();
stroke('red');
translate(300, 0);
rotate(radians(90));
for(var i=0; i<1; i++){
    line(x1, y1, x2, y2);
    y1+=y1step;
    x2+=x2step;
}
pop();
//blue curve translated, rotated and colored 2
push();
stroke('green');
translate(400, 300);
rotate(radians(180));
for(var i=0; i<1; i++){
    line(x1, y1, x2, y2);
    y1+=y1step;
    x2+=x2step;
}
pop();
//blue curve translated, rotated and colored 3
push();
stroke('yellow');
translate(100, 300);
rotate(radians(270));
for(var i=0; i<1; i++){
line(x1, y1, x2, y2);
y1+=y1step;
x2+=x2step;
}
pop();
}


Sean Leo – Looking Outwards – 04

HarmonicTunes – Published on Nov 13, 2010

Chiptune music, or chip music, is produced mostly using video game consoles and home computer technology. Musicians utilize the sound card found on those devices and generate patterns to create their music. Most notably are musicians using the Nintendo Gameboy to create their sounds with. What I find so interesting about chiptune is that there’s an aspect of nostalgia, as we all have been accustomed to 8-bit plings and beeps growing up in an age of fast media advancements. Now the sounds feel old, and out-dated. Which, honestly, is apart of it’s appeal to me. It is choice to not use the newest, highest fidelity systems, and instead use a consumer product from an entirely different industry. Part of the rise of chiptune was it’s accessibility. If you had a game boy you were already half way there. The music from those games are iconic (we could probably all whistle the Mario theme, whenever asked), so to have those same sounds be created in a live setting with the energy of a punk show; it’s incredibly fun.

Sean Leo – Project 03 – Dynamic Drawing

I wanted to create an dynamic drawing that was minimal and focused more the on the composition and geometries of the basic shapes. Stopping your mouse anywhere on the canvas will produce a new composition, color and relation between all the parts. Also it’s really satisfying to just roll your mouse around on the canvas!

project-03

//Sean B. Leo
//Section C
//sleo@andrew.cmu.edu

//Project-03
function setup() {
    createCanvas(600, 480);
    strokeWeight(4);
  }
  
  function draw() {
    background(0);
    noFill();
    //scale mouse X value from 0-175
    var a = map(mouseX, 0, width, 0, 175);
    //scale mouse Y value from 0-175
    var b = map(mouseY, 0, height, 0, 175);
    //print(a);
    //contrary motion
    var inX = width - mouseX;
    var inY = height - mouseY;
    //rectangle transformations
    stroke(a, 0, 100);//scales R value
    rect(inX, inY, inX, inY);
    //circle transformations 
    stroke(100, a, b);//scales G B values
    ellipse(width/2, height/2, a, b);
    //triangle transformations
    stroke(0, a, 100);//scales G values
    triangle(width/2, mouseX / 2, mouseY / 2, mouseY / 2, mouseX, mouseY);
  }