![[OLD FALL 2019] 15-104 • Introduction to Computing for Creative Practice](https://courses.ideate.cmu.edu/15-104/f2019/wp-content/uploads/2020/08/stop-banner.png)
This project will be a collaboration between Shariq Shah and I. We plan to create a dynamic data visualization to represent the patterns of weather and their effects on landscapes. As of now, the weather effects we will be focusing on will be wind and water. These effects will be driven by properties based on real world data and will react to the topography image map. This map will be a gradient based height map of a topography and will potentially change when the user interacts with the visualization, subsequently shifting the patterns of the weather effects. We also plan to use color gradients and other properties such as movement speeds and direction to further convey the environmental effects. Some precedents we have been looking at while coming up with the design are the works of Refik Anadol, Earth by Cameron Beccario, and Drawing Water by David Wicks.
Tag: section C
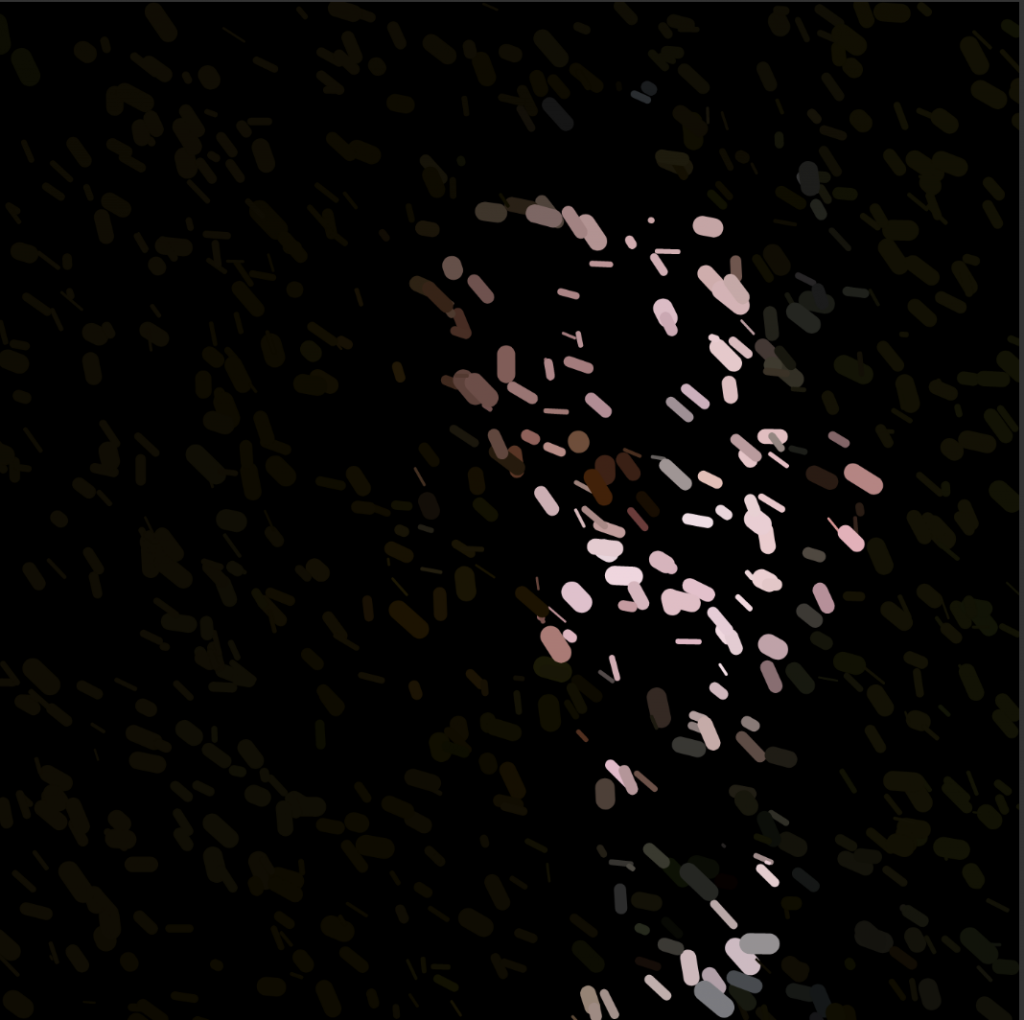
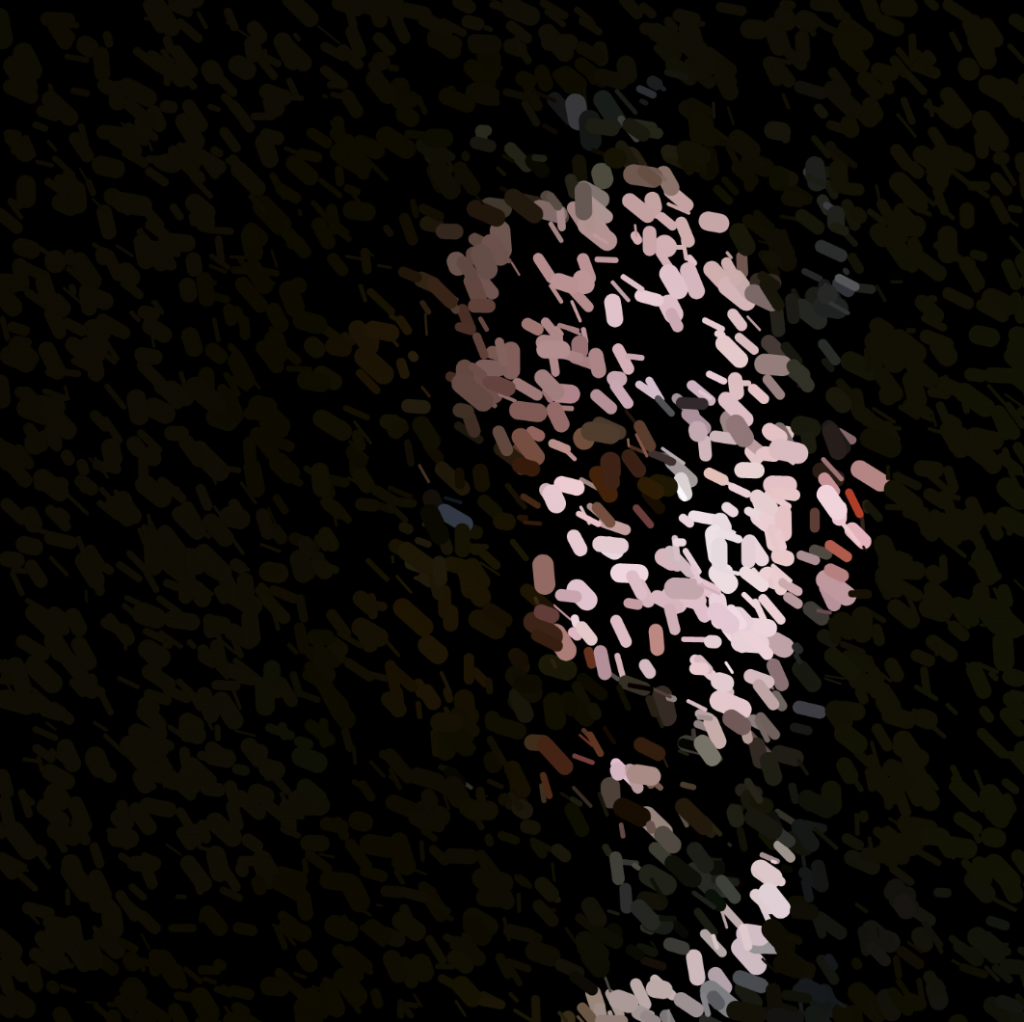
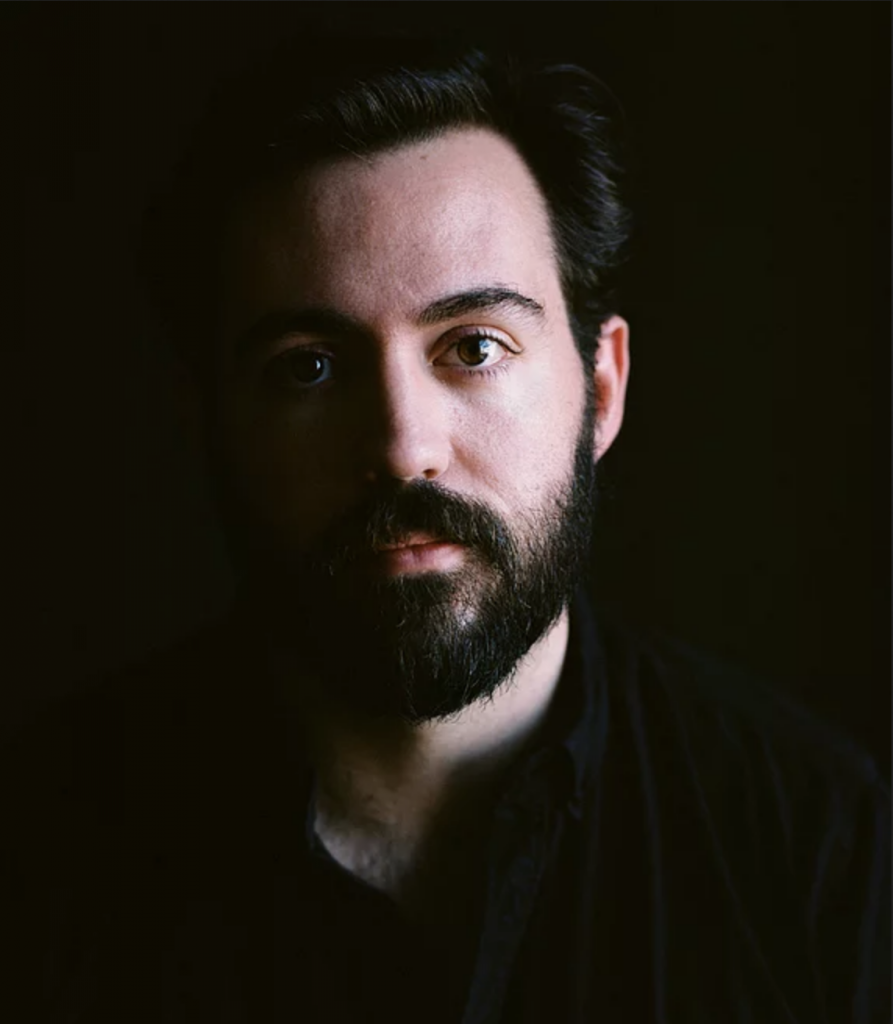
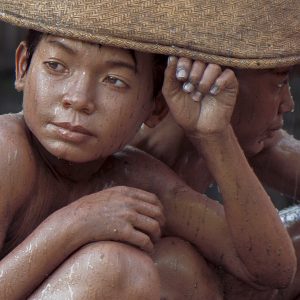
Sean Leo – project 09 – Portrait
//Sean B. Leo
//Sleo@andrew.cmu.edu
//Section C

//Project 09 Portrait

function preload() {
    var myImageURL = "https://static.wixstatic.com/media/b109e8_9226598d042f4ca2b17fd70a4e0d7319~mv2.jpg/v1/fill/w_572,h_680,al_c,q_85,usm_0.66_1.00_0.01/b109e8_9226598d042f4ca2b17fd70a4e0d7319~mv2.webp";

    IMG = loadImage(myImageURL);

}

function setup() {
    createCanvas(480, 480);
    background(0);
    IMG.loadPixels();
    frameRate(60);
  imageMode(CENTER);
}

function draw() {
    var px = random(width);
    var py = random(height);
    var ix = constrain(floor(px), 0, width-1);
  //print (ix);
    var iy = constrain(floor(py), 0, height-1);
  //print(iy);
    var rx = px + random(0,10); // randomize x-value
    var ry = py + random(0,10); // randomize y-value
    var rs = random(1,10); // randomize stroke weight
    var theColorAtLocationXY = IMG.get(ix, iy);

    strokeWeight(rs);
    stroke(theColorAtLocationXY);
    line(px,py,rx,ry);
}
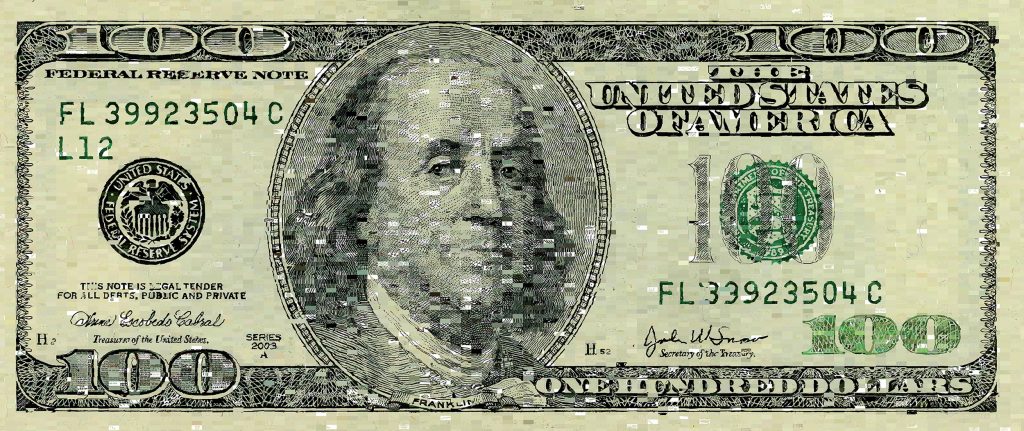
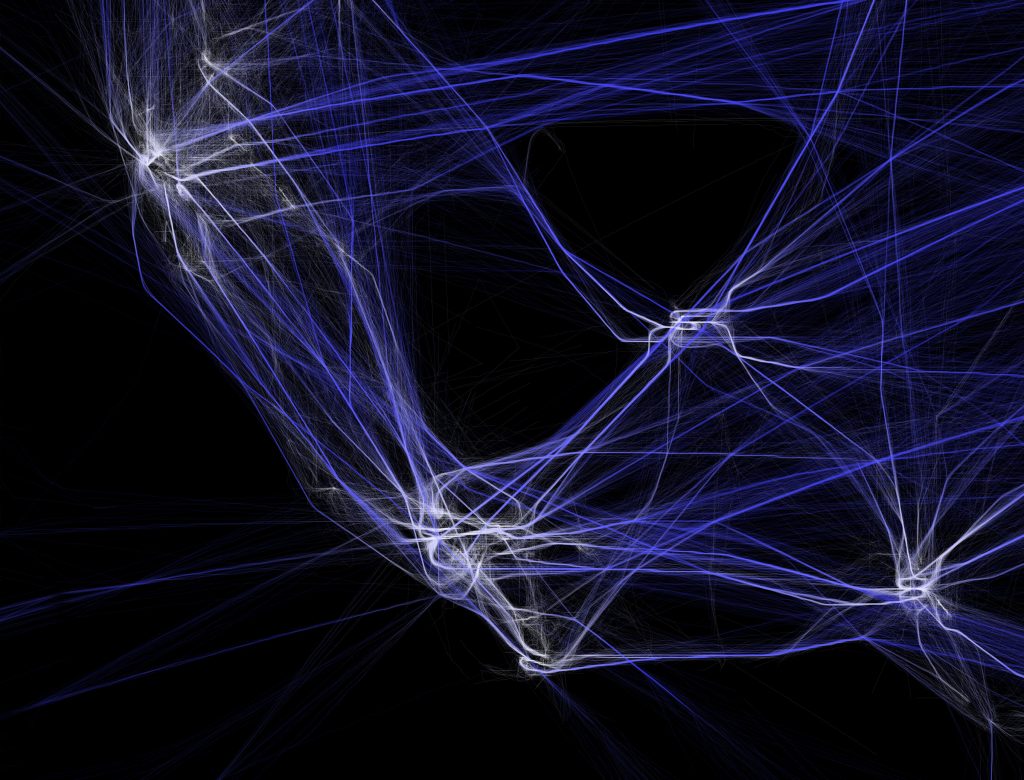
Shariq M. Shah – Looking Outwards 07 – Information Visualization
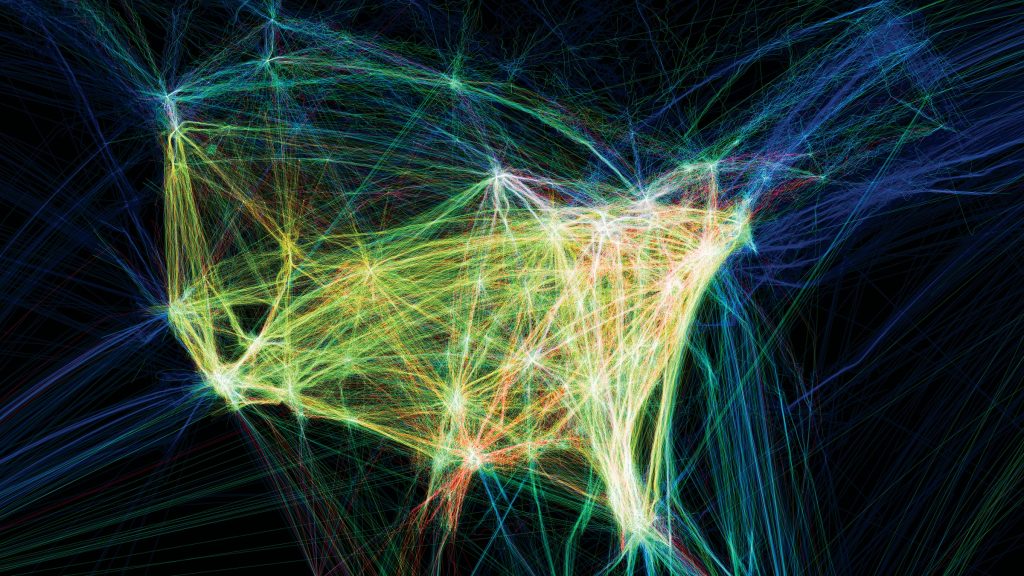
Aaron Koblin is an artist, designer, and programmer specializing in data and digital technologies and using computational techniques to visualize and develop information networks. One of his most compelling works focuses on visualizing flight pattern networks, which render paths of air traffic over North America through varieties of color and form. The FAA data for the flight networks was parsed through Processing and visualized to show nodes and overlaps among highly complex flight patterns. Another Intriguing work of Koblin’s, uses Amazon’s Mechanical Turk to spread out the work of developing an image of the hundred dollar bill across thousands of individuals to where each individual was unaware of the overall task. The computational process works in service of exploring the idea of an advancing economy and distribution of labor. These highly visual and creative ways of visualizing information by Aaron Koblin challenge conceptions of informational graphics and have the potential to become generative models for innovative thinking and development.
Shariq M. Shah – Project 07 – Curve
// Name: Shariq M. Shah
// Andrew ID: shariqs
// Section: C
// Project 07

//defining global variable for number of points

var nPoints = 500;


function setup() {
  createCanvas(400, 400);
}

function draw() {


  //stroke colors will be a function of mouseX location

  var r = map(mouseX, 0, width, 80, 250);
  var g = map(mouseY, 0, height, 80, 250);
  var b = map(mouseX, 0, width, 80, 250);


  //call drawEpitrochoidCurve function

  background(g, b * 2, r * 2);
  push();
  noFill();
  stroke(b, g, r);
  strokeWeight(0.5);
  translate(width/2, height/2);
  drawEpitrochoidCurve();
  rotate(radians(frameRate));
  pop();


  //call drawFermat function
  push();
  noFill();
  stroke(r, g, b);
  strokeWeight(0.5);
  translate(width/2, height/2);
  drawFermat();
  pop();

}


function drawEpitrochoidCurve() {

    // Epicycloid:
    // http://mathworld.wolfram.com/Epicycloid.html

    var x;
    var y;

    var a = map(mouseX, 0, width, 0, width/2);
    var b = a / 2;
    var h = height / 4;
    var ph = mouseX / 10;

    beginShape();
    for (var i = 0; i < nPoints; i++) {

        var t = map(i, 0, nPoints, 0, PI * 2);

       // defining curves as function of i

        x = (a + b) * cos(t) - h * cos(i * (a + b) / b);
        y = (a + b) * sin(t) - h * sin(i * (a + b) / b);


        vertex(x, y);


    }
    endShape(CLOSE);

}

function drawFermat() {

    var x;
    var y;

    var a = map(mouseX, 0, width, 0, width);
    var b = a / 2;
    var h = height / 2;
    var ph = mouseX / 10;


    beginShape();
    for (var i = 0; i < nPoints; i++) {

        //defining angle variable for function

        var angle = map(i, 0, nPoints, 0, TWO_PI);


        x = (a - b) * sin(angle) - b * sin(angle * (a - b));
        y = (a - b) * cos(angle) - b * cos(angle * (a - b));

        vertex(x, y);


    }
    endShape(CLOSE);

}
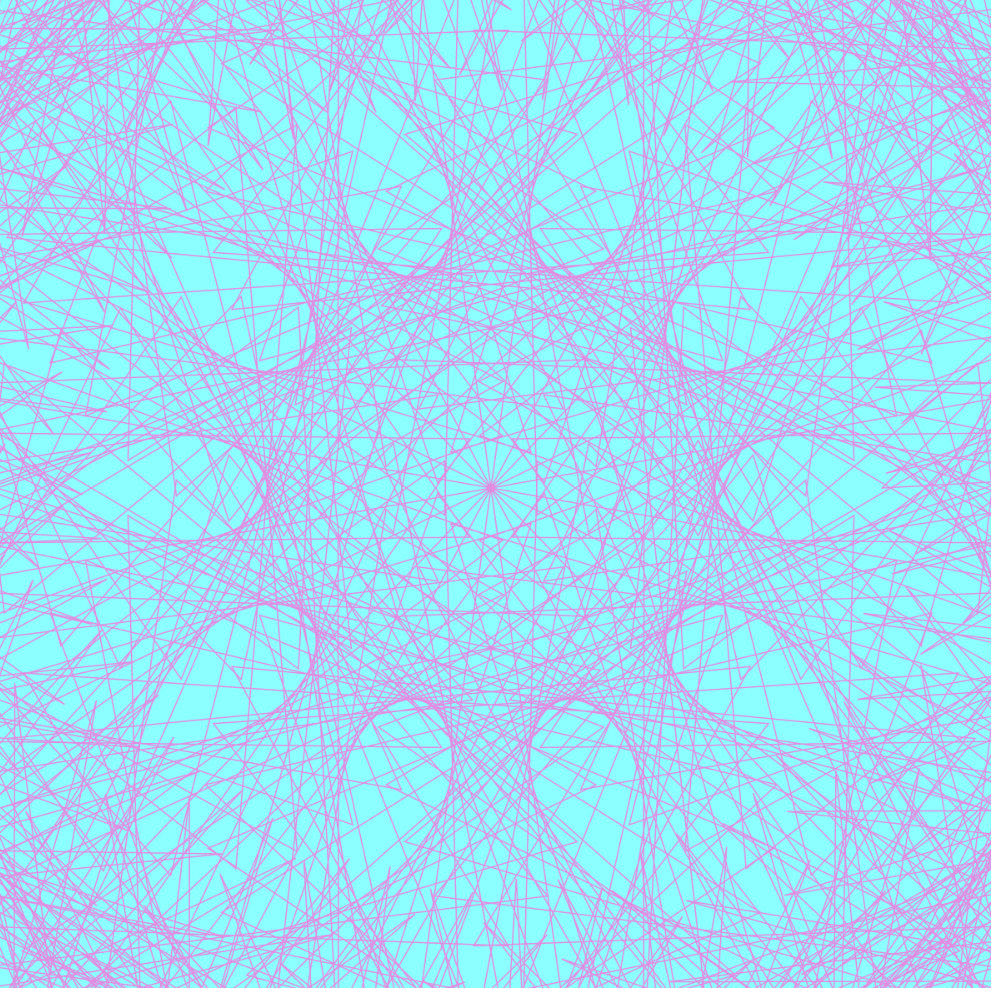
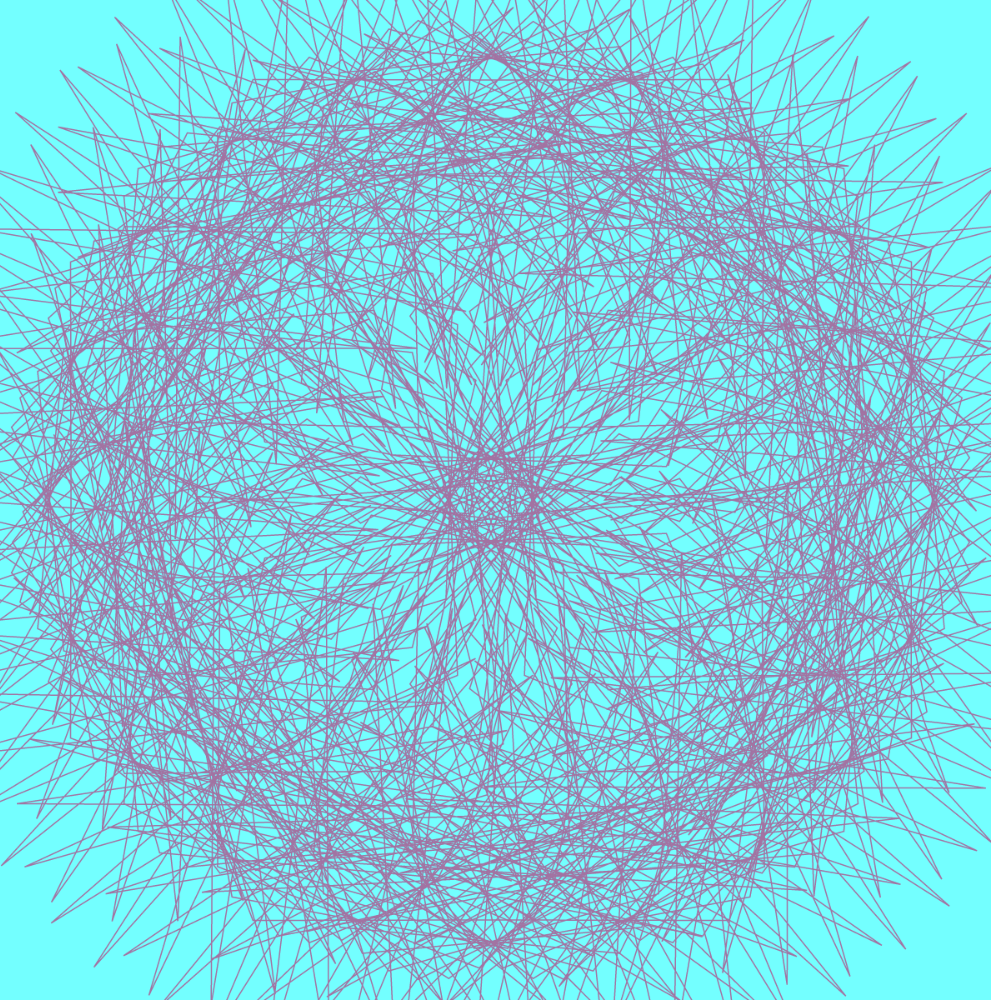
In this project, I was able to use curve equations to generate highly complex and articulated line patterns that change with the location of the mouse. By using mapped numbers and for loops that iterate upon the functions the line patterns become layered and produce interesting effects as the overall patterns change. From there, I was able to use variables to change the color of the lines as the mouse position changes, and subsequently the background to match the line colors as they adapt. By using variables for many of the inputs, the results become highly varied and complex.
Shariq M. Shah – Looking Outwards 06 – Randomness
I am using one of my grace days for this late submission.
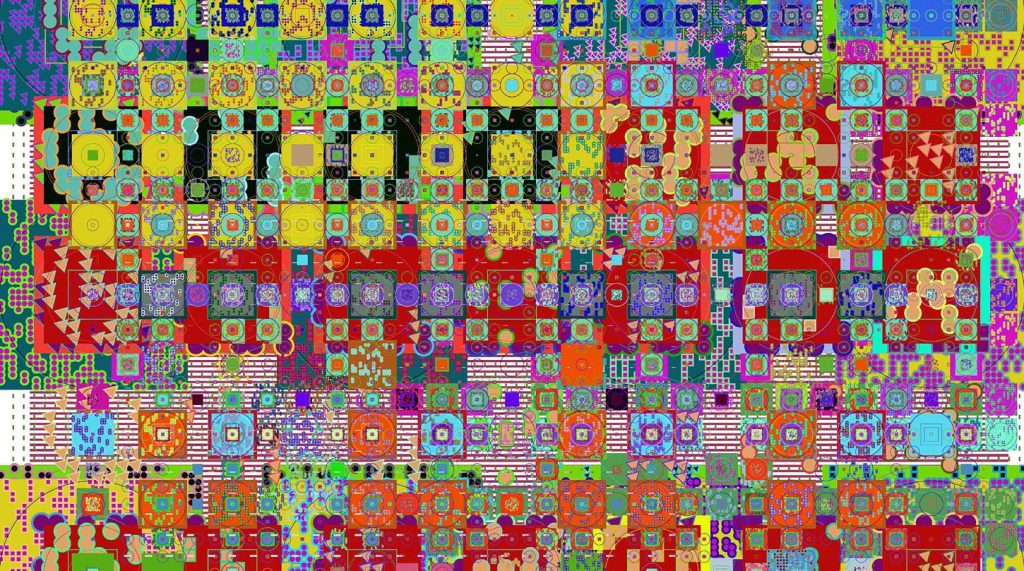
Mark Wilson is a computational artist and designer who focuses on the random aggregation of images into quilt-like mosaics and collages. His work includes processes that collect patterns and images at random and stitches them together in a variety of compositions. Through the logic of the program, color palettes and combinations are developed over a number of iterations, and there is emphasis on the overall mosaic effect of these works. Wilson’s work has been shown at a variety of exhibitions and corporate settings, where the processes and visual complexity of his work are able to be studied. This work is particularly intriguing as it relies on a program to develop an overall composition, thereby shifting the role of the artist in such a work.

Shariq M. Shah – Project 06 – Abstract Clock
function setup() {
    createCanvas(480, 480);

}

function draw() {

    background(0);

    // get the current time
    var H = hour();
    var M = minute();
    var S = second();

    // map times to canvas proportions
    var mappedH = map(H, 0,23, 0,width);
    var mappedM = map(M, 0,59, 0,width);
    var mappedS = map(S, 0,59, 0,width);
    var timeArray = [mappedH, mappedM, mappedS]

    var x = width / 2 - 20;

    push();

    translate(width / 2, height / 2);

    noFill();


  for(s = 0; s < 60; s++) {

    strokeWeight(0.1);

    stroke(0 + mappedS, 300, 20);

    ellipse(0, 0, mappedS, x);

    rotate(radians(s * 0.2));

  }


    for(m = 0; m < M; m++) {

    strokeWeight(0.1);

    stroke(0 + mappedM, 60, 20);

    ellipse(0, 0, mappedM, x);

    rotate(radians(m * 0.2));

  }

    for(h = 0; h < H; h++) {

    strokeWeight(0.1);

    stroke(200, 60, 20);

    ellipse(h, 0, mappedH, x);

    rotate(radians(H * 0.1))


  }

    pop();


    text(H, (width / 2 )- 6, height / 2);
    fill(300);

    text(M, (width / 2) - 6, height / 2 + 15);
    fill(300);

    text(S, (width / 2) - 6, height / 2 + 30);

    fill(300);


}
In this project, I explored the practices of timekeeping in relation to abstract line geometries that rotated and overlapped based on the corresponding time. Different colors represent the different time increments, and complex geometries emerge as a result of the time keeping computation. These processes result in a clock that is dynamic and presents interesting and complex geometries as a result of time.
Sean Leo – Project 06 – Abstract Clock
//Sean B. Leo
//sleo@andrew.cmu.edu
//Section C

//Project 6
//Abstract Clock

function setup() {
    createCanvas(600, 600);
    pixelDensity(1);
    frameRate(1);
  }

  function draw() {

    var S = second();
    var M = minute();
    var H = hour();

    var s1 = map(S, 0, 60, 0, 255);
    var m1 = map(M, 0, 60, 0, 255);
    var h1 = map(H, 0, 24, 0, 255);


    loadPixels();
    for(var y=0; y<400; y++){
      for(var x=0; x<400; x++){
        var index= (x + y *width)*4;
        pixels[index+0] = y-m1;
        pixels[index+1] = h1;
        pixels[index+2] = x-s1;
        pixels[index+3] = 255;
      }
    }

    updatePixels();

  }
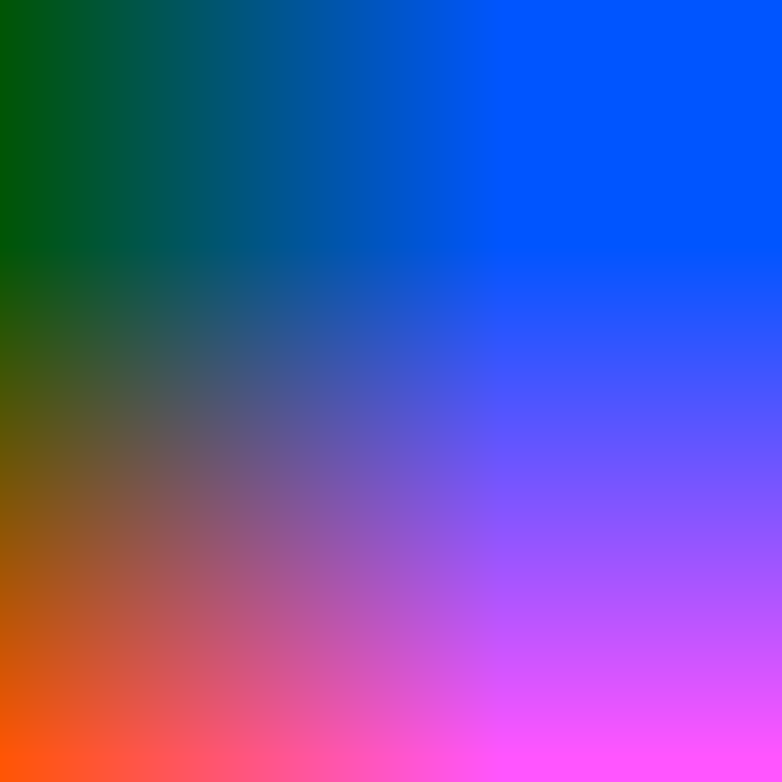
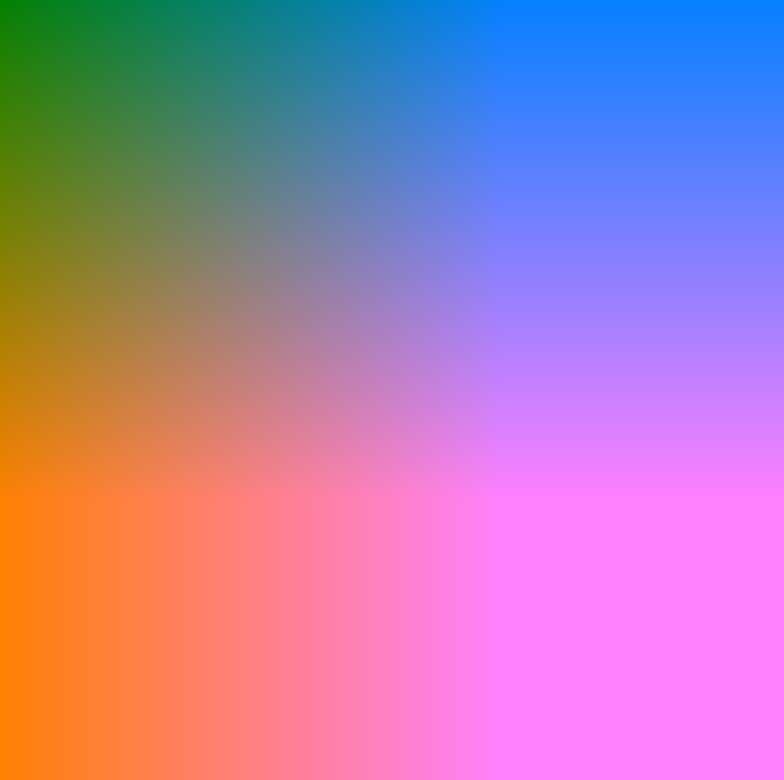
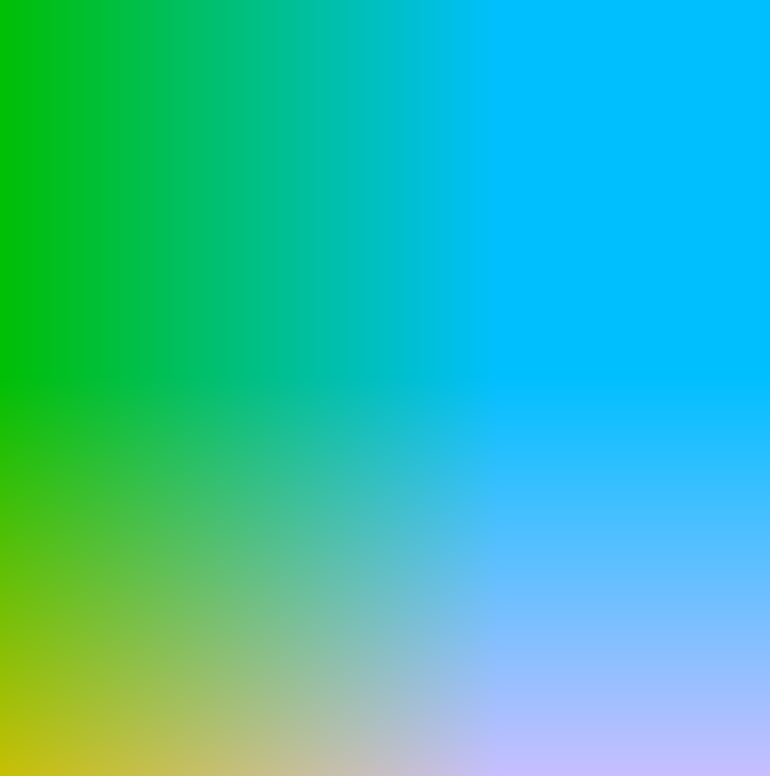
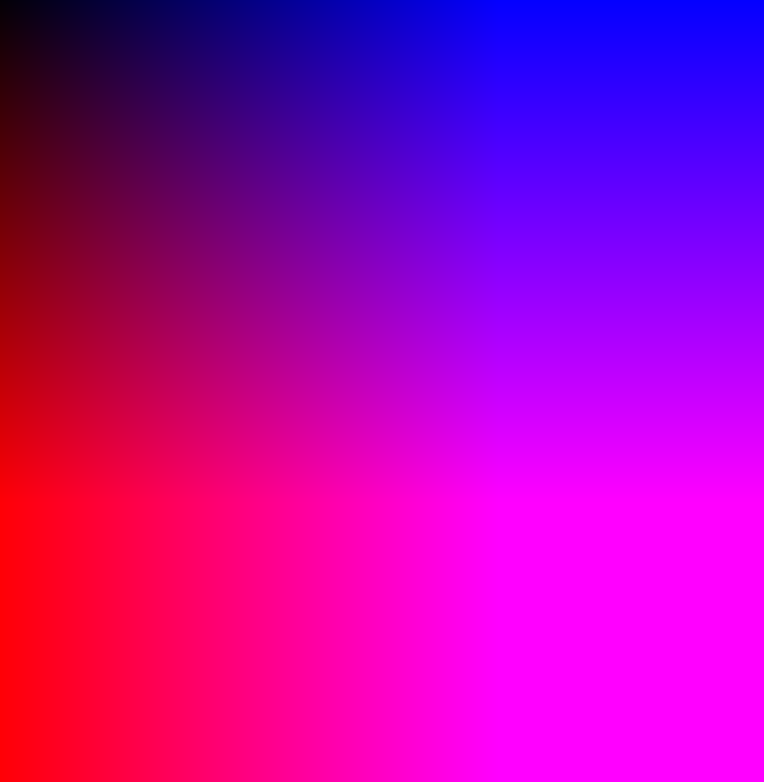
I started thinking about abstracting the concept of time itself. Instead of viewing time as an exacting and regimented number, what if it could be displayed more like a feeling or mood? What if by looking at a display we could have a sense of the passing of time rather than knowing what time it is exactly?
I created a color field that adjusts it’s rgb values over time through a pixel array. No second is the same composition as the next though the change is subtle. Below you can see the progression of time over the day and familiar timestamps.
I think there are a lot of artistic applications of this project; mainly using the generated color field as a light source. Rather than a reading of time in a specific format: a watch, wall clock, microwave, etc. A lamp emitting the color field would affect the room it is in a subtly convey time passing.
Shariq M. Shah – Looking Outwards – 05
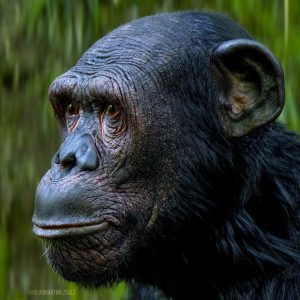
Aldo Martinez Calzadilla is a 3D Computer Graphics Artist who works in highly detailed and lifelike three dimensional models. These computational techniques allow Martinez to explore other worldly ventures and develop methodologies that surpass what may be conceived as possible. Various modeling and processing techniques are used to produce highly articulated, vastly emotional, and intriguing images. Unlike many other artists, the mathematics and computation behind these processes produce a controlled and orchestrated image whereas some other computational artists take a generative approach to the design. In contrast, this process produces high resolution images that have an extreme level of planned detail. This work is highly resolved and its use of computational techniques is evident in its minute details.
Shariq M. Shah – Project 05 – Wallpaper
// Shariq M. Shah
// Section C
// shariqs@andrew.cmu.edu
// Project - 05


function setup() {
    createCanvas(640, 400);
    background(200, 50, 0);
    noStroke();

    var w = 60;
    var h = 60;


    for (var y = 0; y < height; y ++) {

       // using modulus operator to determine even or odd row


       for (var x = 0; x < width; x ++) {

            // using spacing multipliers to get accurate spacing

            var py = y * h;
            var px = x * w;

            stroke(180, 200 - py * 0.5, 300 - py * 0.5);
            strokeWeight(2)
            noFill();
            rectMode(CENTER);


            rect(px, py, 50, 50);


            //coinciding geometries based on positions by changing rectMode to center
            //applying gradient to wallpaper

            stroke(180, 200 - py * 0.5, 300 - py * 0.5);
            rect(px, py, 35, 35);
            ellipse(px, py, 50, 50);
            stroke(200, 30, 50);
            ellipse(px, py, 60, 60);

      }

    }
    noLoop();
}
In this project, I explored using nested for loops to create a wallpaper from coinciding geometries, which created interesting overlapping shapes. By doing this and applying a color gradient, the different geometries created through the for loop develop into an interesting pattern design.
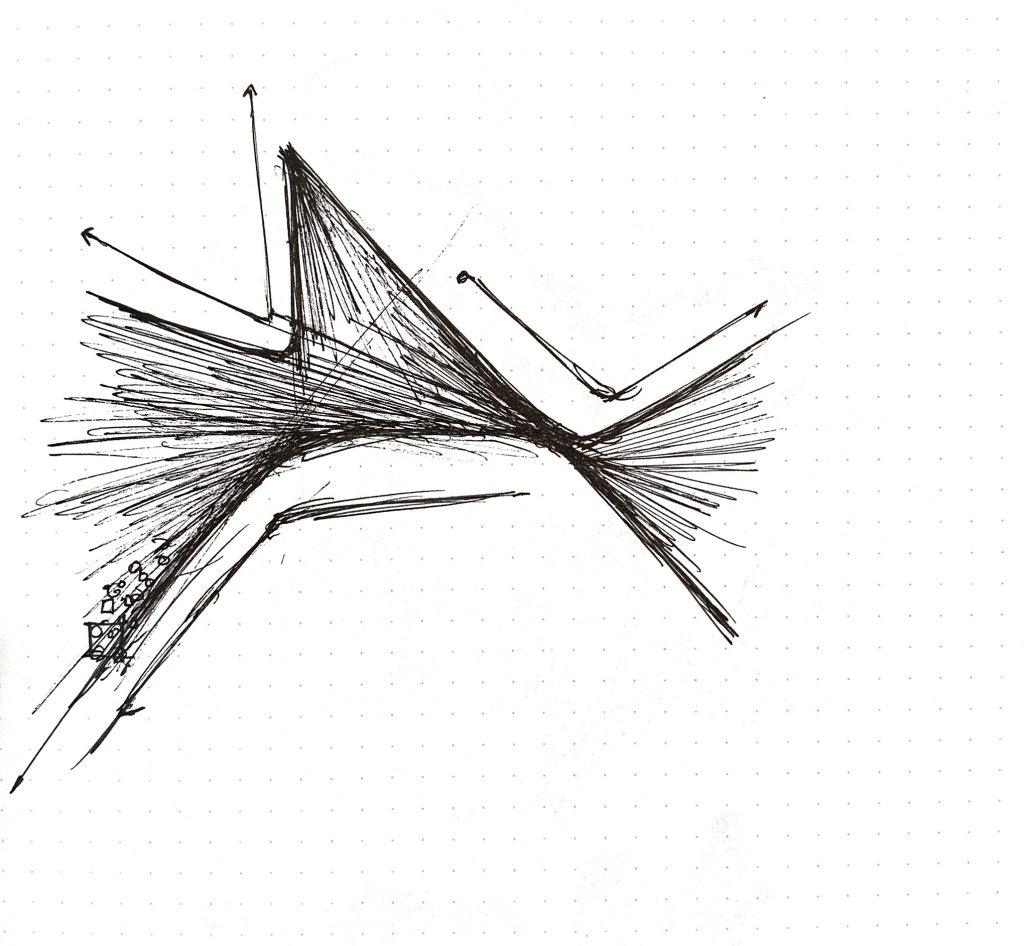
Shariq M. Shah – Project 04 – String Art
// Project - 04
// Name: Shariq M. Shah
// Andrew ID: shariqs
// Section: C


function setup() {

createCanvas(400,300);

}

function draw() {

  background(0);

  for (var i = 0; i < 200; i += 1) {

      //defining a rotating series of lines that converge in patterns
      //using frameCount to have rotations and colors change over time

      strokeWeight(0.4);
      translate(width / 2, height / 2 + 100);
      rotate(radians(180 * 0.1 + frameCount));

      //various configurations and colors of lines that change according to stepping i variable
      //mouseY used to alter color and configurations depending on mouse location

      stroke(mouseY, 0, 25 + frameCount);
      line(i + i * width,  height * 0.1 * mouseY, width/2, i + i*2);


      stroke(0.5 * mouseY, 0, 25);
      line(i + i * -width,  height * 0.1 * mouseY, width/2, i + i*2 );


      stroke(mouseY, 0, 250);
      line(i + i * width/10,  -height * 0.1 * mouseY, width/2, height);


      stroke(mouseY, 0, 250);
      line(i + i * -width/10,  -height * 0.1 * mouseY, width/2, height);

      }

}
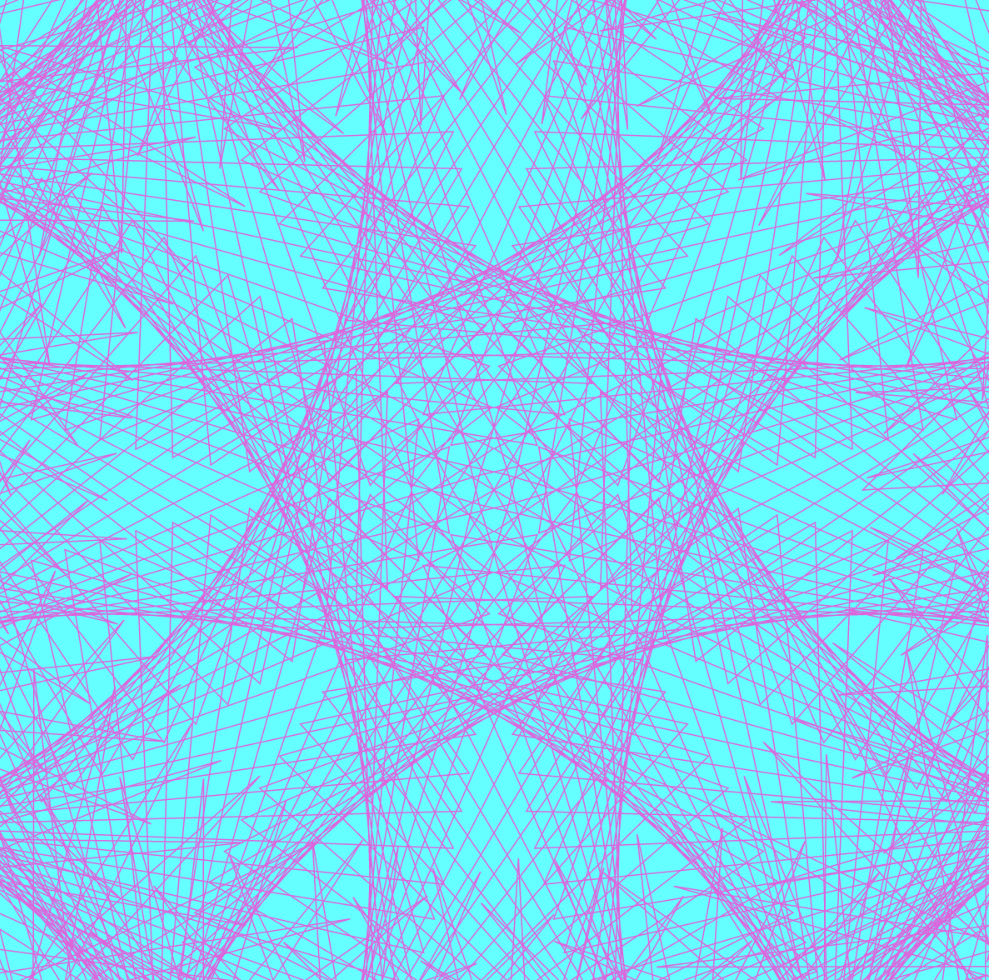
In this project, I explored various configurations and rotational properties that could be created with the lines created in for() loops. The program I developed focuses on developing a highly dynamic and fluid pattern of lines that at times seem solid and at other times seem porous. The colors are also dynamic as they change with the movement of the lines.