![[OLD FALL 2019] 15-104 • Introduction to Computing for Creative Practice](https://courses.ideate.cmu.edu/15-104/f2019/wp-content/uploads/2020/08/stop-banner.png)
This project will be a collaboration between Shariq Shah and I. We plan to create a dynamic data visualization to represent the patterns of weather and their effects on landscapes. As of now, the weather effects we will be focusing on will be wind and water. These effects will be driven by properties based on real world data and will react to the topography image map. This map will be a gradient based height map of a topography and will potentially change when the user interacts with the visualization, subsequently shifting the patterns of the weather effects. We also plan to use color gradients and other properties such as movement speeds and direction to further convey the environmental effects. Some precedents we have been looking at while coming up with the design are the works of Refik Anadol, Earth by Cameron Beccario, and Drawing Water by David Wicks.
Tag: Section A
Paul Greenway – Looking Outwards – 12
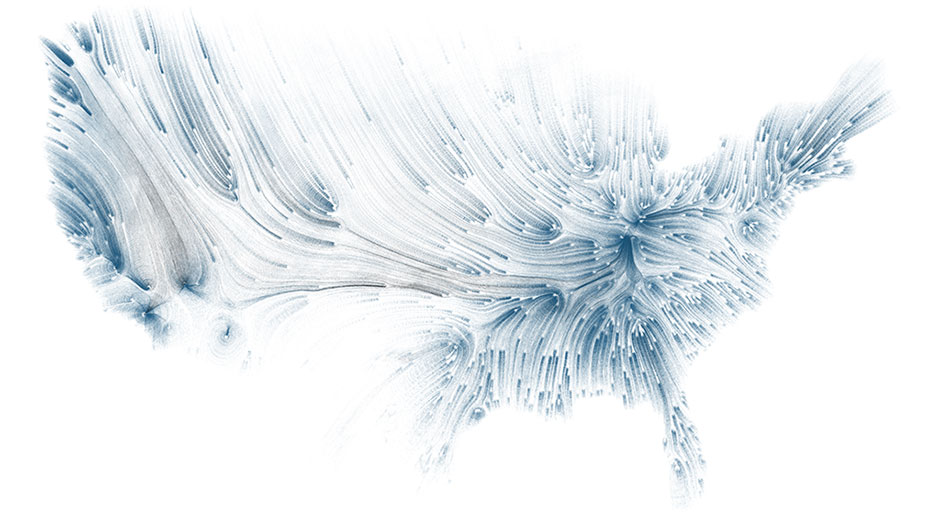
Drawing Water by David Wicks 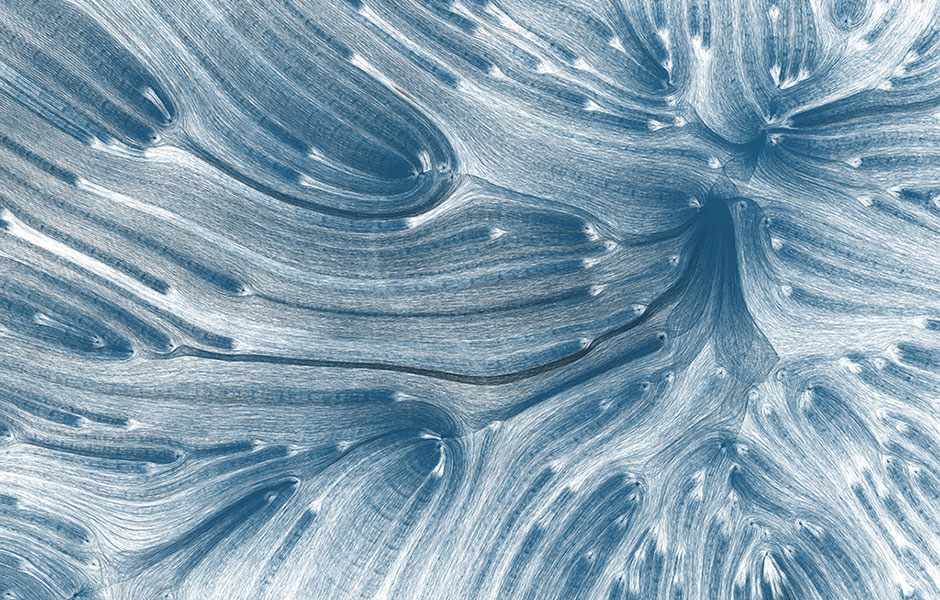
The first precedent project I found relevant to my final project was Drawing Water by David Wicks. The project is a data visualization overlaid on a map of the US that shows the relationship between where rain initially falls and where urban water is most consumed. The result is a series of curves with varying saturations and opacities to further represent the patterns and movement of water. To create the project, Wicks pulled Water consumption data from the USGS and rainfall data from the NOAA/NWS. This data was then input into a series of python scripts to create the final visualization.
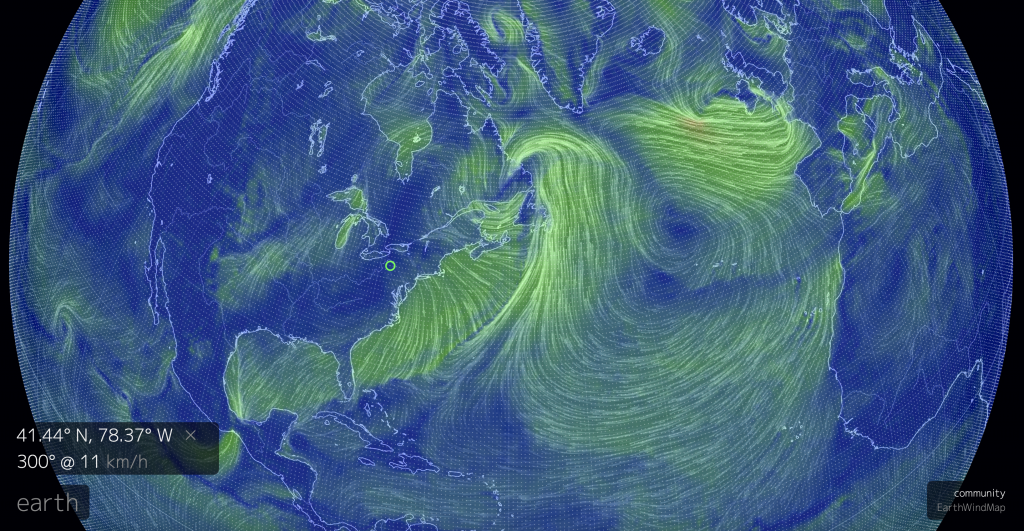
Earth by Cameron Beccario
The second precedent project, Earth by Cameron Beccario, is a near realtime weather visualization on a global scale. Similarly to the previous project, Earth also generates dynamic linear paths that in this project represent wind patterns as well as changing colors to represent various other weather conditions. Earth also pulls weather data but from a wider array of sources and makes use of supercomputers to create and constantly update the visualization.
Paul Greenway – Looking Outwards 11
History Flow is a data visualization project by Fernanda Viégas, a senior researcher at Google with a focus on human/AI interaction and data visualization. The project History Flow shows study collaboration patterns on Wikipedia and was on display at the MoMA in New York City. To show such patterns on Wikipedia, Viégas collected the entire past editorial data from various different wikipedia pages and input this data into a script in order to create a legible graphic representation. The resulting visualizations make use of color, patterns, and direction to represent various different events and trends within each page’s history and tell a story about that particular topic from the perspective of all its contributed combined.
I found the project to be a really compelling data visualization with an especially unique focus on something I never would have imagined being visualized. The final images tell interesting stories and show the overall interest / controversial nature about their respective topics.

edit history graphic representing the wikipedia page on chocolate 
edit history graphic representing the wikipedia page on history
Paul Greenway – Project 11 – Landscape
// Paul Greenway
// pgreenwa
// pgreenwa@andrew.cmu.edu
// Project-11-Landscape

var terrainSpeed = 0.0005;
var terrainDetail = 0.005;

var buildings = [];
var trees = [];

var c1;
var c2;

function setup() {
    createCanvas(480, 300);

    //gradient background color set
    c1 = color(0, 90, 186);
    c2 = color(255, 166, 0);
    setGradient(c1, c2);

    // create an initial collection of buildings
    for (var i = 0; i < 20; i++){
        var rx = random(width);
        buildings[i] = makeBuilding(rx);
    }
    frameRate(60);
}


function draw() {

    setGradient(c1, c2);

    mountains1();
    mountain2();
    strokeWeight(1);


    updateAndDisplayBuildings();
    removeBuildingsThatHaveSlippedOutOfView();
    addNewBuildingsWithSomeRandomProbability();

    updateAndDisplayTrees();
    removeTreesThatHaveSlippedOutOfView();
    addNewTreesWithSomeRandomProbability();


    fill(40);
    rect (0,height-60, width, height-50);

    noFill();
    stroke(255);
    strokeWeight(1);
    line(0,height-40, width, height-40);
    strokeWeight(3);
    line(0,height-30, width, height-30);

    noStroke();
    fill(255);
    ellipse(500,50,30,30);


}


//create background mountains

function mountains1() {

    noStroke();
    fill(255,100);
    beginShape();
    for (var x = 0; x < width; x++) {
        var t = (x * terrainDetail*3) + (millis() * terrainSpeed);
        var y = map(noise(t), 0, 1, height/4, height/2);
        vertex(x, y);
      }
    vertex(width, height);
    vertex(0, height);
    endShape(CLOSE);
}

function mountain2() {

    noStroke();
    fill(185, 96, 0, 100);
    beginShape();
    for (var x = 0; x < width; x++) {
        var t = (x * terrainDetail*3) + (millis() * terrainSpeed);
        var y = map(noise(t), 0, 1, height/1.5, height/2);
        vertex(x, y);
      }
    vertex(width, height);
    vertex(0, height);
    endShape(CLOSE);
}


//set background color gradient

function setGradient(c1, c2) {

  noFill();
  for (var y = 0; y < 300; y++) {
    var inter = map(y, 0, 150, 0, 1);
    var c = lerpColor(c1, c2, inter);
    stroke(c);
    line(0, y, width, y);
  }
}


//create windy trees

function updateAndDisplayTrees(){

    for (var i = 0; i < trees.length; i++){
        trees[i].move();
        trees[i].display();
    }
}
function removeTreesThatHaveSlippedOutOfView(){

    var treesToKeep = [];
    for (var i = 0; i < trees.length; i++){
        if (trees[i].x + trees[i].breadth > 0) {
            treesToKeep.push(trees[i]);
        }
    }
    trees = treesToKeep; // remember the surviving buildings
}
function addNewTreesWithSomeRandomProbability() {
    // With a very tiny probability, add a new building to the end.
    var newTreeLikelihood = 0.01;
    if (random(0,1) < newTreeLikelihood) {
        trees.push(makeTree(width));
    }
}
function treeMove() {
    this.x += this.speed;
}
function treeDisplay() {
    var treeHeight = random(45,50);
    var tHeight = treeHeight;
    fill(0,100);
    noStroke();
    push();
    translate(this.x, height - 40);
    ellipse(0, -tHeight, this.breadth-10, tHeight);
    fill('black');
    rect(0-4,-tHeight, this.breadth-45, tHeight);
    pop();
}
function makeTree(birthLocationX) {
    var tre = {x: birthLocationX,
                breadth: 50,
                speed: -1.0,
                nFloors: round(random(2,8)),
                move: treeMove,
                display: treeDisplay}
    return tre;
}


//create buildings based on starter code

function updateAndDisplayBuildings(){

    for (var i = 0; i < buildings.length; i++){
        buildings[i].move();
        buildings[i].display();
    }
}
function removeBuildingsThatHaveSlippedOutOfView(){

    var buildingsToKeep = [];
    for (var i = 0; i < buildings.length; i++){
        if (buildings[i].x + buildings[i].breadth > 0) {
            buildingsToKeep.push(buildings[i]);
        }
    }
    buildings = buildingsToKeep; // remember the surviving buildings
}
function addNewBuildingsWithSomeRandomProbability() {
    // With a very tiny probability, add a new building to the end.
    var newBuildingLikelihood = 0.005;
    if (random(0,1) < newBuildingLikelihood) {
        buildings.push(makeBuilding(width));
    }
}
function buildingMove() {
    this.x += this.speed;
}
function buildingDisplay() {
    var floorHeight = 20;
    var bHeight = this.nFloors * floorHeight;
    fill(100,200);
    noStroke();
    push();
    translate(this.x, height - 40);
    rect(0, -bHeight, this.breadth, bHeight);
    noStroke();
    fill(255);
    for (var i = 0; i < this.nFloors; i++) {
        ellipse(3+5,-10+20*-i,5,5);
    }
    for (var y = 0; y < this.nFloors; y++) {
        ellipse(13+5,-10+20*-y,5,5);
    }
    for (var z = 0; z < this.nFloors; z++) {
        ellipse(23+5,-10+20*-z,5,5);
    }
    for (var x = 0; x < this.nFloors; x++) {
        ellipse(33+5,-10+20*-x,5,5);
    }
    pop();
}
function makeBuilding(birthLocationX) {
    var bldg = {x: birthLocationX,
                breadth: 50,
                speed: -1.0,
                nFloors: round(random(2,8)),
                move: buildingMove,
                display: buildingDisplay}
    return bldg;
}
For this project I wanted to create the view of a landscape as seen when driving in a car. I made use of the base passing buildings object as well as adding trees, mountains, and a gradient sky color to create the overall composition.
Paul Greenway – Project 10 – Sonic Sketch
// Paul Greenway
// pgreenwa
// pgreenwa@andrew.cmu.edu
// Project-10-Sonic Sketch


let osc;

function preload() {


    //load sound files

    mySnd1 = loadSound("https://courses.ideate.cmu.edu/15-104/f2019/wp-content/uploads/2019/11/boop.wav");
    mySnd1.setVolume(0.2);

    mySnd2 = loadSound("https://courses.ideate.cmu.edu/15-104/f2019/wp-content/uploads/2019/11/alert.wav");
    mySnd2.setVolume(0.5);

    mySnd3 = loadSound("https://courses.ideate.cmu.edu/15-104/f2019/wp-content/uploads/2019/11/alertHigh.wav");
    mySnd3.setVolume(0.5);

    mySnd4 = loadSound("https://courses.ideate.cmu.edu/15-104/f2019/wp-content/uploads/2019/11/bump.wav");
    mySnd4.setVolume(0.5);

}


function setup() {

    createCanvas(640, 480);

    //set frequency and amplitude

    osc = new p5.TriOsc();
    osc.amp(0.5);


    osc.start();

}

function soundSetup() {

    myOsc = new p5.Tri0sc();

    myOsc.freq(800.0);

    myOsc.start();
    myOsc.freq(400);
}

function draw() {

    background(170, 190, mouseY);
    noStroke();

    let maxX = constrain(mouseX, 0, width-mouseX);

    // left circles

    fill(170, 190, mouseY);
    //rotate(radians(angle));
    square(maxX, 0, mouseX/2, mouseY/5);

    fill(mouseY, 190, 200);
    //rotate(radians(angle));
    square(maxX, 50, mouseX/2, mouseY/5);

    fill(170, 190, mouseY);
    //rotate(radians(angle));
    square(maxX, 100, mouseX/2, mouseY/5);

    fill(mouseY, 190, 200);
    //rotate(radians(angle));
    square(maxX, 150, mouseX/2, mouseY/5);

    fill(170, 190, mouseY);
    //rotate(radians(angle));
    square(maxX, 200, mouseX/2, mouseY/5);

    fill(mouseY, 190, 200);
    //rotate(radians(angle));
    square(maxX, 250, mouseX/2, mouseY/5);

    fill(170, 190, mouseY);
    //rotate(radians(angle));
    square(maxX, 300, mouseX/2, mouseY/5);

    fill(mouseY, 190, 200);
    //rotate(radians(angle));
    square(maxX, 350, mouseX/2, mouseY/5);

    fill(170, 190, mouseY);
    //rotate(radians(angle));
    square(maxX, 400, mouseX/2, mouseY/5);

    fill(mouseY, 190, 200);
    //rotate(radians(angle));
    square(maxX, 450, mouseX/2, mouseY/5);


    // play sound effects at canvas borders

    if (mouseY > 470) {

        mySnd2.play();
    }

    if (mouseY < 10) {

        mySnd3.play();
    }

    if (mouseX < 10) {

        mySnd4.play();
    }

    if (mouseX > 630) {

        mySnd4.play();
    }

    //modulate sound while mouse is moving

    let freq = map(mouseX, 0, width, 40, 880);
    osc.freq(freq);

    let amp = map(mouseY, 0, height, 1, 0.01);
    osc.amp(amp);

}
For this project, I used my project 3 dynamic drawing as a starting point. I then decided to use sound effects based on the mouse position on the canvas. The user is able to control the frequency of the base sound with the mouse and can also trigger different sound effects at each border of the canvas.
Paul Greenway – Looking Outwards – 10
NSynth Super is part of an ongoing project by Google called Magenta that explores how machine learning can become a new tool for musicians. The NSynth, or neural synthesizer, uses algorithms to learn the characteristics of existing sounds and subsequently create new sounds based on the inputs. The results of this process are completely original sounds that may be produced by a combination of more than one instrument. The NSynth not only generates these unique sounds but also gives artists control over the dynamics of the new sounds through custom interface and well designed hardware. All of the code for the project is open source as the project, like all other magenta projects, is meant to be free to access by anyone.
What I found most interesting about this project was its potential for generating brand new sounds un-restricted by existing tools or instruments. In addition, I thought the ease of use and accessible nature of the project both in its hardware and software was another aspect which made it a great project and something that anyone who is interested in it could try out.

Paul Greenway – Project 09 – Portrait
// Paul Greenway
// pgreenwa
// pgreenwa@andrew.cmu.edu
// Project-09-Portrait

var originalPortrait;

function preload() {

    //original portrait image from imgur

    var portraitUrl = "https://i.imgur.com/mqXKE8q.jpg";
    originalPortrait = loadImage(portraitUrl);
}


function setup() {
    createCanvas(700, 1200);
    background(255);
    originalPortrait.loadPixels();
    frameRate(1000);
}

function draw() {

    var px = random(width);
    var py = random(height);
    var circSize = random(5,20);
    var ix = constrain(floor(px), 0, width-1);
    var iy = constrain(floor(py), 0, height-1);
    var theColorAtLocationXY = originalPortrait.get(ix, iy);


    //fill circles with color based on base image
    noStroke();
    fill(theColorAtLocationXY);

    //draw circle with dimension based on mouse position

    ellipse(px, py, circSize*(mouseX*0.01), circSize*(mouseY*0.01));

}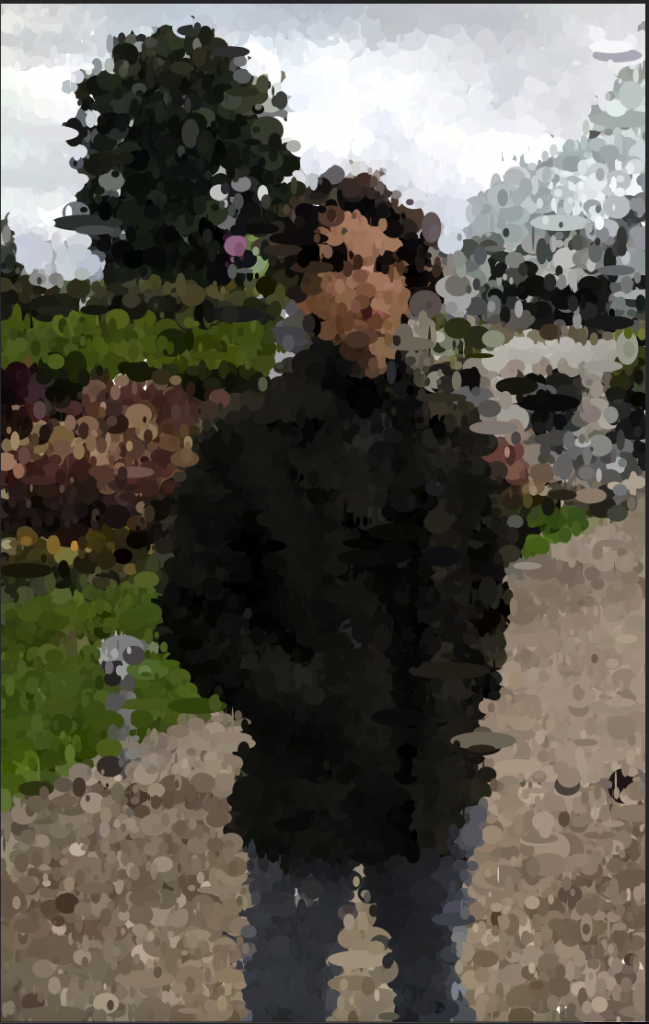

For this project I wanted to create portrait generator that would adjust the size / resolution of the dots based on user input. While I found it hard implement the exact control over the image that I wanted, the final result was a portrait made up of circles with dimensions based on the mouse position.
Paul Greenway – Looking Outwards – 09
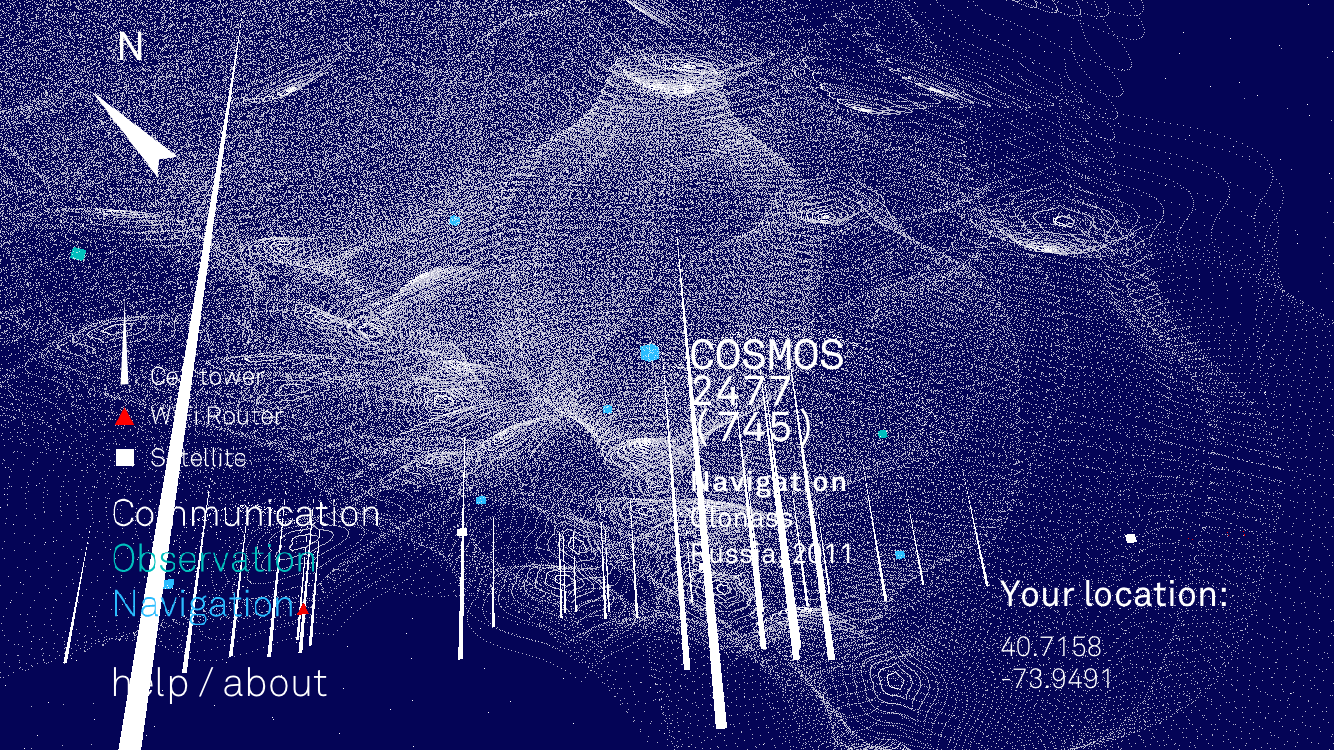
The Looking Outwards post I decided to look into further was Steven Fei’s week 7 post. The project this post covers is called Architecture of Radio and is by Richard Vijgen and his studio. The design studio, based in the Netherlands, focusses on contemporary information culture and how such data can be visualized through digital art as well as physical installations. This specific project visualizes the world of radio waves, collecting live signals from a variety of different sources and compiling them into one cohesive “infosphere” experience. The infosphere is then viewed by the user through a real time phone application.
In his post, Steven was specifically interested in the first person representation of the radio wave visualizations that the app provides and how it could allow the user to view the infrastructure of such signals in a unique and immersive way rather than the typical top down system plans. I too found this aspect of the project interesting and in addition thought it managed to very successfully visualize a system critical to our everyday lives that would normally be invisible to us.
Paul Greenway – Looking Outwards – 08
Refik Anadol is media artist who heads his own design studio focussed mainly on public art driven by site specific parametric data. The studio is based in Los Angeles California and as a result, Anadol is also a lecturer and researcher at UCLA’s Department of Design Media Arts. With degrees in Fine Arts and Media Arts, Anadol describes his work as a hybrid between physical, architectural spaces and digital media.
Refik Anadol’s body of work is largely made up of exhibition / public installation projects that visualize data in dynamic and interesting ways. I was initially drawn to his work because of the unique aesthetic quality of his projects but after looking further into them, I found the data driving the designs to equally important. One of the projects that I feel showcases Anadol’s work best is the installation called Melting Memories.
In the Eyeo Festival presentation, Refik Anadol began by explaining the inspiration behind his works and how he initially got into data visualization and media art. Then after providing context for his work, he presented his work with a combination of images, animations and text to fully convey his intentions to the audience. The dynamic nature of many of the projects meant that animation was an ideal format to showcase the work.
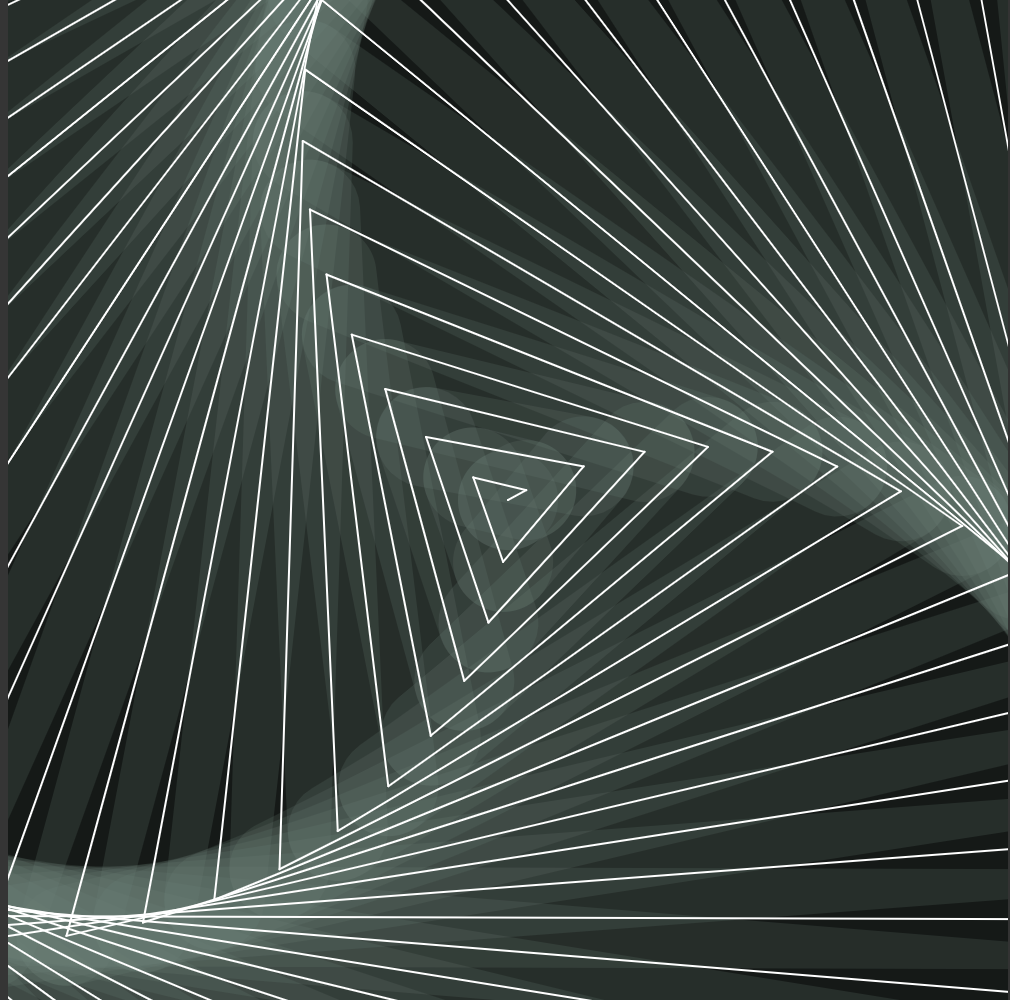
Paul Greenway – Project 07 – Curves
/*Paul Greenway
Section 1A
pgreenwa@andrew.cmu.edu
Project-07-Curves
*/

function setup() {
    createCanvas(500, 500);
}

function draw() {
    background('black');


    //background spiral

    strokeWeight(50);

    size = 150;
    spiralWidth = 5;

    angleMap = map(mouseX, 0, width, 0, 20);
    angle = angleMap;

    Rcolor = map(mouseY, 0, height, 255,0);
    Gcolor = map(mouseY, 0, height, 100,150);
    Bcolor = map(mouseY, 0, height, 0,200);

    col = color(Rcolor,Gcolor,Bcolor, 50);

    stroke(col);

    drawSpiral();


    //foreground spiral

    strokeWeight(1);

    size = 150;
    spiralWidth = 5;

    angleMap = map(mouseX, 0, 300, 0, 20);
    angle = angleMap;

    Rcolor = map(mouseY, 0, height, 255,0);
    Gcolor = map(mouseY, 0, height, 100,150);
    Bcolor = map(mouseY, 0, height, 0,200);

    col = color(Rcolor,Gcolor,Bcolor);
    stroke('white');

    drawSpiral();

}

function drawSpiral() {
    oldX = width/2;
    oldY = height/2;

    for (let i=0; i<size; i++) {
        newAngle = (angle/10) * i;
        x = (width/2) + (spiralWidth * newAngle) * Math.sin(newAngle);
        y = (height/2) + (spiralWidth * newAngle) * Math.cos(newAngle);

        line(oldX, oldY, x, y);
        oldX = x;
        oldY = y;

    }
}
For this project I used an Archimedean spiral as the base curve type for my design. In order to make the movement of the spiral interactive I mapped the movement of the mouseX to the angle of the spiral and mouseY to the rgb value. This allowed for the properties of the spiral to be dynamic and based on the user’s mouse movement. In addition, I also added a larger opaque spiral to mirror the main one and act as a backdrop to the design.