Shariq M. Shah | Paul Greenway – Final Project

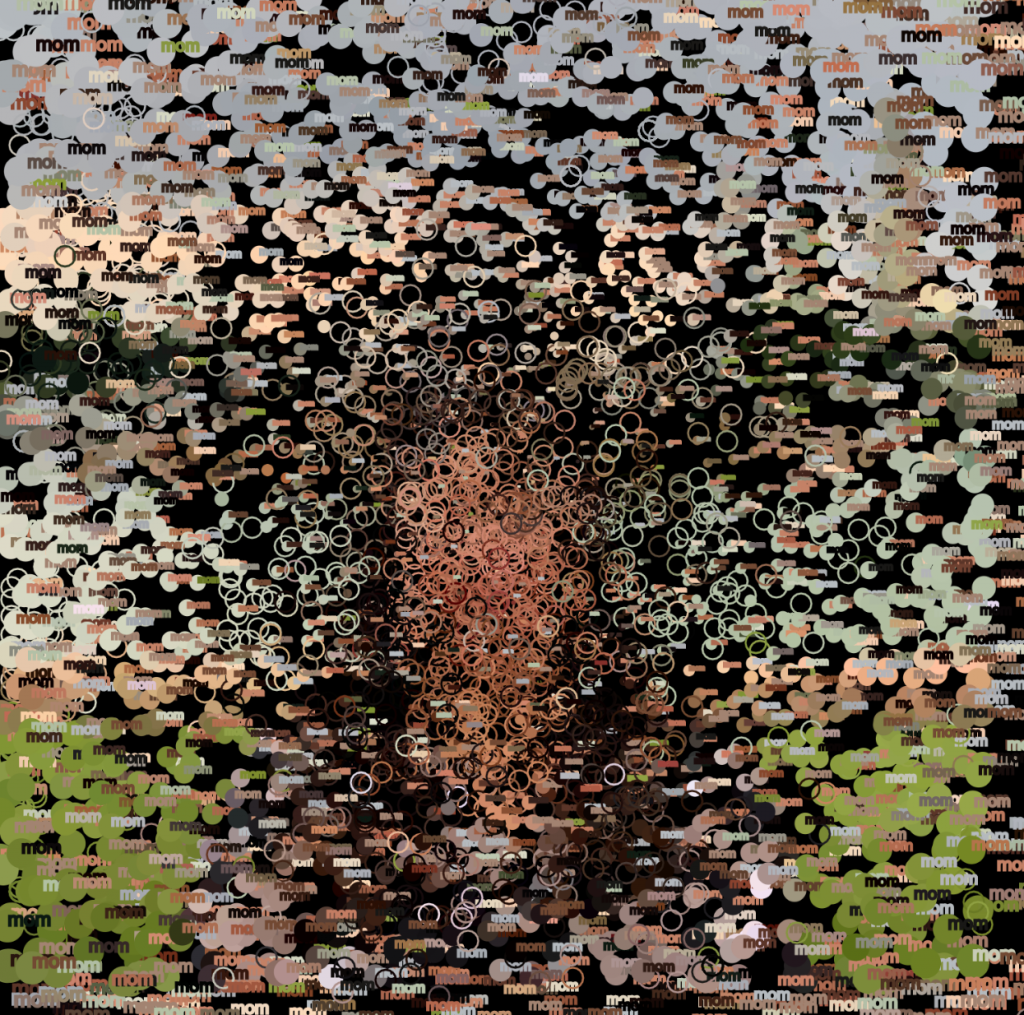
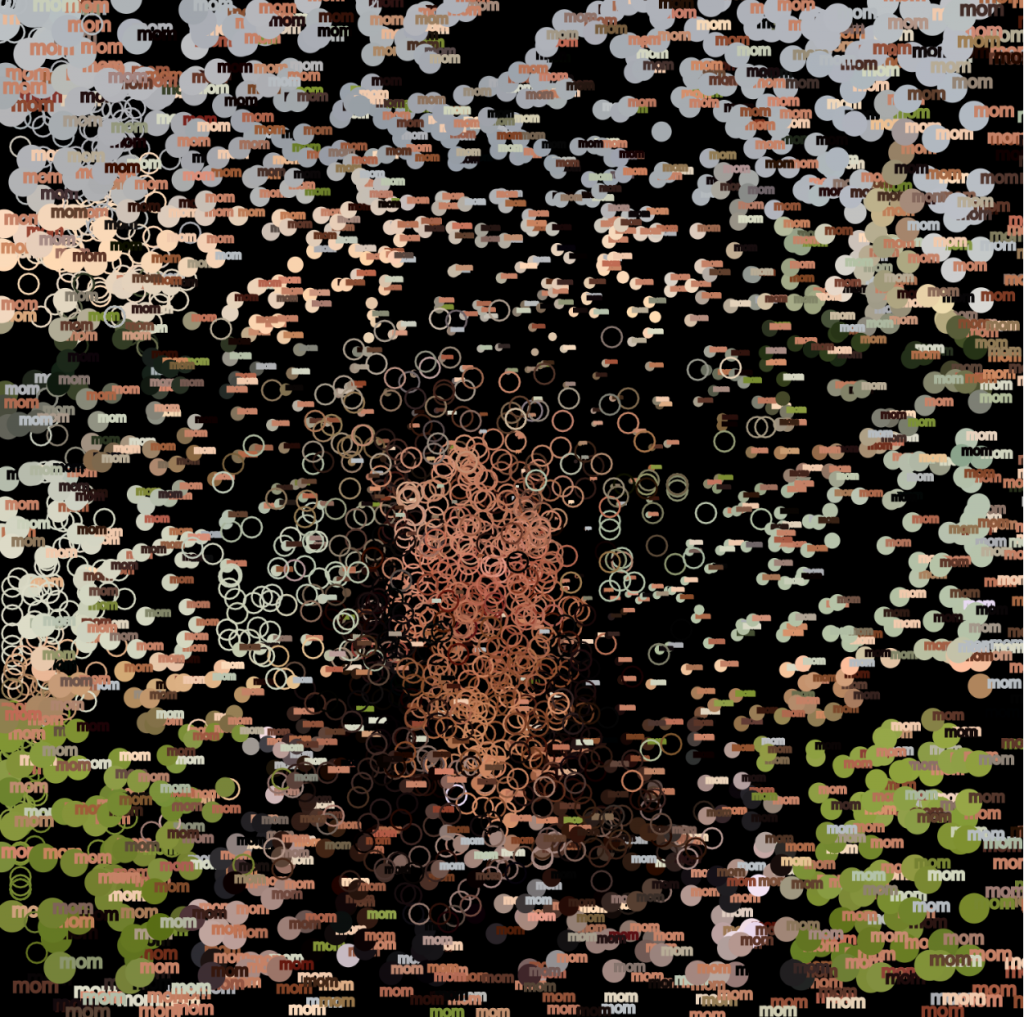
This project functions as a Climate Change Visualizer, where the user is able to understand the extents of their environmental impact in a game like exaggeration of excessive consumption. The user’s actions to increase their ecological footprint, are translated to an increased rate of change in the number of tonnes of CO2 emitted. Each aspect of the Anthropocene (transport, fossil fuels, and agriculture) are represented by icons and are associated with facts that are cycled through in an array. At the end of the clicking cycle, there is a sarcastic game-like “YOU WIN!” message that points to the absurdity of excessive human consumption that ultimately leads to the degradation of the planet. The hope is that this climate change visualizer helps people to understand the gravity and severity of their impact relative to climate change.  Part of the user’s involvement makes it necessary to refresh the page in order to restart the game. The squares that change in size and movement based on mouse location are indicative of icecaps that get smaller in size as “ecological footprint” increases. 

shariqs-pgreenwa

// Shariq Shah | Paul Greenway
// shariqs | pgreenwa
// shariqs@andrew.cmu.edu | pgreenwa@andrew.cmu.edu

// Project-12-Final Project
// Climate Change Visualizer

//Variables


//Ice movement intensity variable
let movementIntensity = 0;


// Environmental impacts multipliers
var impactSize = [6,9,12,400];

//Step Variable
var n = 0;

//Starting C02 Value
var co2 = 2332947388070;

//Images


//Impact Icon Links
var impactImageLinks = [
"https://i.imgur.com/BQBpdiv.png", "https://i.imgur.com/De2zFwf.png", "https://i.imgur.com/a0ab0DC.png", 'https://i.imgur.com/SRVUOkn.png'
  ]
//Impact Facts
var impactFacts = [ "","                               Livestock contributes nearly 2/3 of agriculture's greenhouse & 78% of its methane emissions", "                       In total, the US transportation sector produces nearly thirty percent of all US global warming emissions", "The consumption of fossil fuel by the United States has been 80%. Fossil fuels are the most dangerous contributors to global warming"
  ]
//Impact Tags
var impactNames = [
  "agriculture", "transportation", "fossil        fuels", "you win"];

var impactImages;

//Images Preload

function preload() {
    impactImages =         loadImage(impactImageLinks[n]);
    currentImpactImageIndex = 0;
}

//Setup, Load in Images
function setup() {
  createCanvas(600, 600);
 
  currentImpactImage = impactImages;
  currentImpactImage.loadPixels();
 
  strokeWeight(0.25);
  stroke(dist(width/2, height/2, mouseX, mouseY), 10, 200);
  noFill();
}
 
 
function draw() {
 
  //Background color + opacity setup  
  background(255,0,0,10);
  tint(500, 20);

  //Dynamic ice grid setup 
  for (let x = 0; x <= width; x = x + 50) {
    for (let y = 0; y <= height; y = y + 50) {

      const xAngle = map(45, 0, width, -4 *         PI* 3, 4 * PI * 3, true);
      const yAngle = map(45, 0, height, -4 *         PI, 4 * PI, true);

      const angle = xAngle * (x / width) +           yAngle * (y / height);


      const myX = x + 20 * cos(2 * PI/4 *           movementIntensity + angle/10);
      const myY = y + 20 * sin(2 * PI/2 *           movementIntensity + angle/10);     
      stroke(0,255,255,200);
      strokeWeight(n);
      fill('white');
      rectMode(CENTER);
     
      rect(myX, myY, dist(myX, myY, mouseX,         mouseY)/impactSize[n],dist(myX, myY,           mouseX, mouseY)/impactSize[n]); // draw       particle5
    }
  }
 
  //Impact Icons Config + draw
  imageMode(CENTER);
  currentImpactImage.resize(100, 100);
  image(currentImpactImage, mouseX, mouseY);


  textFont('Helvetica');
  
  noStroke();
  
  fill('white');
  
  rect (width/2, 500, width, 60);
  
  fill('black');
  
  textSize(25);
  
  //C02 Emmited updating Text

  text('TONNES OF CO2 EMITTED : ' + co2, 40, 509);
  fill(255);
  //C02 emmision text backdrop

  rect(width/2, 100, width, 40);
  fill(0);
  textSize(10);
  text(impactFacts[n], width/2 - 295, 105);
  
  //C02 Count Multiplier
  co2 = co2 + 10 * n * 20;
  
  textSize(32);
    
  
  //game over text
  if (n == 4) {
    fill(0);
    text('YOU WIN! ICE CAPS MELTED.', mouseX - 200,           mouseY + 100);
  
    textFont('Helvetica');
    }
  
    else {
    
    textSize(6 * n);
    text('PRESS TO INCREASE YOUR ECOLOGICAL FOOTPRINT!',       mouseX - 120 * n, mouseY + 100);
  
  }
  
  //Ice Movement Intensity Multiplier
  movementIntensity = movementIntensity + 0.01 +n/150;

}

//Mouse Click functions

function mousePressed(){
   
    //change impact icons on click
    impactImages = loadImage(impactImageLinks[n]);
    currentImpactImage = impactImages;

    currentImpactImage.loadPixels();
    //increase step on click
    n = n + 1;
   
    if (n > 4) {
        n = 0;
    }

}

Shariq M. Shah – Looking Outwards 12

NAND.Io – Raw Sensor Data
Levels of excitement from biometric data
Visualization alongside driving experience

The two practices I drew inspiration from for the final project included innovative and dynamic information visualizations from Nand.io studio and Stefanie Posavec. The work of Nand.io studio seeks to capture the experience of driving through data, motion, and light. The forces at work within the movement of the Infiniti Q10 are translated abstractly into the diagrammatic explorations in dynamic data. Speed, heart rate, motion, and fluid dynamic shapes are consolidated into cohesive data sets then used to show the data.

Phantom Terrains

Stefanie Posavec’s project, Phantom Terrains, explores the physicality and the auditory presence of wireless networks through experimentally augmenting wireless networks within soundscapes. Network identifiers, data rates, and encryption modes are moved into sonic parameters, then associated with auditory representations.

Shariq M. Shah – Project 11 – Generative Landscape


shariqs-project-11

// Name: Shariq M. Shah
// Andrew ID: shariqs
// Section: C
// Project 11

//initializing objects as empty arrays
var boxes = [];
var balls = [];

var spikesSpeed = 0.0005;
var spikesDetail = 0.5;

function setup() {
    createCanvas(640, 240);
    // creating boxes
    for (var i = 0; i < 10; i++){
        var rx = random(width);
        boxes[i] = makebox(rx);
    }
    frameRate(30);
}
function draw() {
    background(235, 183, 52);
    noFill();
    stroke(1);
    beginShape();
    for (var x = 0; x < width; x++) {
      var t = (x * spikesDetail * 2) + (millis() * 1.3 * spikesSpeed);
      var y = map(noise(t), 0, 1, 0, height);
      vertex(x, y);
      push();
      fill(0);
      ellipse(x, y, 5, 5);
      pop();
    }
    endShape();
    updateAndshowboxes();
    removeboxesThatHaveSlippedOutOfView();
    addNewboxesWithSomeRandomProbability();
    //text that moves in generative landscape
    text("//wishyouwerehere", constrain(mouseX, 50, width - 100), height/2 + 50, 5)
}
function updateAndshowboxes(){
    // Update the box's positions, and show them.
    for (var i = 0; i < boxes.length; i++){
        boxes[i].move();
        boxes[i].show();
    }
}
function removeboxesThatHaveSlippedOutOfView(){
    var boxesToKeep = [];
    for (var i = 0; i < boxes.length; i++){
        if (boxes[i].x + boxes[i].breadth > 0) {
            boxesToKeep.push(boxes[i]);
        }
    }
    boxes = boxesToKeep; // remember the surviving boxes
}
function addNewboxesWithSomeRandomProbability() {
    // With a very tiny probability, add a new box to the end.
    var newboxLikelihood = 0.007;
    if (random(0,1) < newboxLikelihood) {
        boxes.push(makebox(width));
    }
}
// method to update position of box every frame
function boxMove() {
    this.x += this.speed;
}
function boxshow() {
    var heightUp = 20;
    var bHeight = this.nFloors * heightUp;
    fill(0);
    stroke(5);
    push();
    translate(this.x, height - 40);
    noStroke();
    for (var i = 0; i < 50; i++) {
        rect(5, -15 - (i * heightUp), this.breadth - 5, 1 + i);
        ellipse(-20, -(i * 1.2 * 2 * heightUp), 5 + i, 5 + i);
    }
    pop();
}
function makebox(birthLocationX) {
    var bldg = {x: birthLocationX,
                breadth: 50,
                speed: -1.0,
                nFloors: round(random(2,8)),
                move: boxMove,
                show: boxshow}
    return bldg;
}

In this project, I used objects to generate an abstract and dynamic landscape that interacts with the rectangular geometry objects in the background. The arrays and dynamic objects generate a constantly moving and energetic field.

Shariq M. Shah – Looking Outwards 11


For Want of a Nail

Amy Franceschini is an artist and designer who challenges the “certainties” of space and time in a way that brings into inquiry the supposed conflict between mankind and nature. Throughout her work, there are developments of an intertwined relationship between people, nature, and space, in ways that reconfigure understandings of traditional space making. One project by her practice, Future Farmers, is called Wind Theater and it transforms and translates the physical experience of wind into one that is visual and auditory, using its movements to generate color fields. Another project, For Want of a Nail, brings into inquiry the complex history of nuclear energy in New Mexico, as it seeks to develop a dialogue between the materials and those affected by the materials. Franceschini’s work spans a variety of disciplines and challenges the notions of art, architecture, and research in ways that positions the work in intriguing ways.

Wind Theater

http://www.futurefarmers.com/projects

Shariq M. Shah – Project 10


shariqs-project10

// Project - 10
// Name: Shariq M. Shah
// Andrew ID: shariqs
// Section: C


var travis;
var heavenly;
var kick;
var explosion;

//loading different sounds
function preLoad() {
    travis = loadSound("https://courses.ideate.cmu.edu/15-104/f2019/wp-content/uploads/2019/11/travisscott.wav");
    travis.setVolume(0.2);

    heavenly = loadSound("https://courses.ideate.cmu.edu/15-104/f2019/wp-content/uploads/2019/11/heavenly.wav")
    heavenly.setVolume(0.4);

    kick = loadSound("https://courses.ideate.cmu.edu/15-104/f2019/wp-content/uploads/2019/11/kick.wav")
    kick.setVolume(0.2);

    explosion = loadSound("https://courses.ideate.cmu.edu/15-104/f2019/wp-content/uploads/2019/11/explosion.wav")
    explosion.setVolume(0.2);
}


function setup() {
   createCanvas(400,300);
   useSound();
}

function soundSetup() {
    osc = new p5.TriOsc();
    osc.freq(100.0);
    osc.amp(0.1);
    osc.start();
}

function draw() {

  background(0);

  for (var i = 0; i < 100; i += 1) {
      //defining a rotating series of lines that converge in patterns
      //using frameCount to have rotations and colors change over time
      strokeWeight(0.4);
      translate(width / 2, height / 2 + 100);
      rotate(radians(180 + 0.1 * frameCount));
      //various configurations and colors of lines that change according to stepping i variable
      //mouseY used to alter color and configurations depending on mouse location
      stroke(mouseY, 0, 250);
      line(i + i * width/10,  -height * 0.1 * mouseY, width/2, height);

      stroke(mouseY, 0, 250);
      line(i + i * -width/10,  -height * 0.1 * mouseY, width/2, height);
    }
      //amplitude and frequency change based on loaction of mouse x and y
      var freq = map(mouseX, 0, width, 40, 100);
      osc.freq(freq);

      var amp = map(mouseY, 0, height, 0.2, 0.05);
      osc.amp(amp);
}

//depending on where user presses mouse, a different brooding sound is played according to the relative amplitude and frequency at the location
function mousePressed() {

    if(mouseX > 10 & mouseY < height / 2) {
      travis.play(0, 1, 2);
    }

    if(mouseX > width/2 & mouseY < 200) {
      heavenly.play(0, 1, 2);
    }

    if(mouseY > 50 & mouseY < 100) {
      kick.play(0, 1, 2);
    }

    if(mouseX > 300 & mouseY > 200) {
       explosion.play(0, 1, 2);
    }


}

In this project, I experimented with a variety of sounds and used a differing mouseX and mouseY location to change the auditory experience when the mouse is clicked.  I did this using if statements that change the sound that is played based on where the mouse is clicked. This became more interesting once the form of the rotating lines responded to the fluctuating soundscape, both in color and in geometry. Overall, this was a great project with which I could experiment with creating different soundscapes in a program. 

Shariq M. Shah – Looking Outwards 10 – Sound Art

The Cycling wheel project, by Hong Kong based practice Keith Lam, Seth Hon and Alex Lai, takes the concept of Marcel Duchamp’s famed bicycle wheel, in his readymade explorations, and transforms it into a generative light and sound instrument. In order to turn it into this interactive performance art piece, it uses Processing to create a specially made control panel configuration that functions on three levels: controlling music, movement, and LED lights. The processes take the movement of the bicycle wheel and uses it to generate a variety of sounds that are augmented by the control panel computation. The result is a magical interplay of light, music, art, and computation that makes for quite a spectacular interactive art piece. It makes me think of ways that other physical movements can be translated into dynamic soundscapes, a concept similar to what I tried to do for this week’s project. It is also interesting to consider how a variety of different sounds can be layered to produce an immersive soundscape experience, as this orchestral performance demonstrates. 


https://www.creativeapplications.net/processing/cycling-wheel-the-orchestra-reimagining-marcels-bicycle-wheel-as-a-lightsound-instrument/

Shariq M. Shah – Project 09 – Portrait

shariqs-09-project

// Shariq M. Shah
// Project 09
// Section C

var underlyingImage;

function preload() {
    //changing example image
    var myImageURL = "https://i.imgur.com/hpfafgd.jpg[/img]";
    underlyingImage = loadImage(myImageURL);
}

function setup() {
    createCanvas(500, 500);
    background(0);
    underlyingImage.loadPixels();
    frameRate(10);
}

function draw() {
    var px = random(width);
    var py = random(height);
    var ix = constrain(floor(px), 0, width-1);
    var iy = constrain(floor(py), 0, height-1);
    var theColorAtLocationXY = underlyingImage.get(ix, iy);

    noStroke();
    fill(theColorAtLocationXY);
    //making size of "pixels" geometries proportional to distance from CENTER
    ellipse(px, py, 0.05 * dist(px, py, width/2, height/2), 0.05 * dist(px,     py, width/2, height/2));

    var theColorAtTheMouse = underlyingImage.get(mouseX, mouseY);
    stroke(theColorAtTheMouse);
    noFill();
    //drawing ellipses based on mouse location
    ellipse(pmouseX, pmouseY, 10, 10);
    //placing "mom" text at each ellipse
    textSize(0.03 * dist(px, py, width/2, height/2));
    text('mom', px, py);
}

In this project, I used a picture of my mom from when we went on a family trip to Chicago this summer. I used small ellipses and text that change in size based on their distance from the center to develop the computational portrait of my mom. In addition, small empty ellipses are drawn with colors of the picture as the user moves the mouse. The drawn ellipses, the “pixel” ellipses, and the text make up the overall computational portrait of my mom. She’ll love seeing this when I go back for Thanksgiving break.

My mom in Chicago.

Shariq M. Shah – Looking Outwards 09


The Looking Outwards that I found particularly interesting was Tai Manheim’s exploration of the work of Stamen, an artificial intelligence tool used to analyze wealth and poverty at an urban scale. The project was developed by Stamen and researchers at Carnegie Mellon University and it implements neural networks to develop machine learning frameworks that take in information on infrastructure in various neighborhoods and subsequently uses the information to make predictions on the average income of the areas. I found Tai’s explanations of the digital techniques and data structure networks that make this project possible to be highly informative and intriguing. With a project of this scope, there are inevitably associations and unintended associations made between income, race, crime, and location which can be used negatively for increased surveillance and policing strategies. This raises issues on the interface between Artificial Intelligence, machine learning, and politics, as the impressions and conclusions derived from a project like this may be based on hard data, but can be used negatively. There are also clear design incentives as to how residential areas can be organized better according to the data found from a project like this.

https://stamen.com/work/penny/

https://courses.ideate.cmu.edu/15-104/f2019/2019/10/06/taisei-manheim-looking-outward-07/

Shariq M. Shah – Looking Outwards 08 – Creative Practice of an Individual


Refik Anadol is digital media artist and director born in Istanbul, Turkey working at the intersection of parametric data sculpture and audio/visual fields in service of immersive ephemeral experiences. Anadol uses data structures and machine learning frameworks to develop experiential conditions that challenge typical orientations and attitudes towards spatial realities, thereby fundamentally shifting what it means to occupy and experience space. His installation work exemplifies the ephemeral nature of “non-digital reality”, that he references in his talk, an idea centralized by the destruction of the singularity, the championing of dynamism, and the triumph of the out of body experience. The networks between architecture, space, art, and computation are all brought into question as a result of Anadol’s work, and his talks suggest that conventional spaces can become canvases for the new digital realities that emerge from innovative computational techniques. One of Anadol’s recent works, Melting Memories, manifests as an all encompassing field condition that seemingly takes over the viewer. The workflow transposes EEG data into procedural noise forms, resulting in a highly dynamic and articulated formal development. As an architecture student interested in the intersection of these various ways of thinking, Anadol’s work and talk is highly intriguing and thought provoking, as it proposes new ways of thinking about space and computation. I intend to use the logic, workflows, and aesthetic attitudes as inspiration for my work going forward.

Machine Hallucinations

Melting Memories Workhttp://refikanadol.com/

Shariq M. Shah – Looking Outwards 07 – Information Visualization

Aaron Koblin is an artist, designer, and programmer specializing in data and digital technologies and using computational techniques to visualize and develop information networks. One of his most compelling works focuses on visualizing flight pattern networks, which render paths of air traffic over North America through varieties of color and form. The FAA data for the flight networks was parsed through Processing and visualized to show nodes and overlaps among highly complex flight patterns. Another Intriguing work of Koblin’s, uses Amazon’s Mechanical Turk to spread out the work of developing an image of the hundred dollar bill across thousands of individuals to where each individual was unaware of the overall task. The computational process works in service of exploring the idea of an advancing economy and distribution of labor. These highly visual and creative ways of visualizing information by Aaron Koblin challenge conceptions of informational graphics and have the potential to become generative models for innovative thinking and development.


10, 000 Cents Image Produced through Mechanical Turk System
Flight Patterns Visualization 01
Flight Patterns Visualization 02
Aaron Koblin’s Website