Looking Outwards 11: Societal Impacts of Digital Art

Theodore Kim addresses racial bias in computer graphics and poses solutions to prevent systemic bias. Kim claims that early film technology and procedures from the analog period have biases ingrained in them. For example, “subsurface light transport” is a component of digital design that allows for a skin glow effect, but this doesn’t apply to darker skin tones. This same algorithm can look unrealistic on people with darker skin tones. In addition, there are no algorithms for kinky hair. The use of deep machine learning can offset historical racial bias in computer graphics. He further proposes that this process enables artists to discard outdated rules and produce a futuristic aesthetic for digital media.

Alexia Forsyth

https://www.tkim.graphics/

Mimi Son’s Another Moon

Alexia Forsyth

Mimi Son’s Another Moon
Another Moon is a project that was first unveiled at the 2021 Newnow festival and later at the Plasmata festival in 2022. The piece is a massive outdoor apparition replicating the moon. This “second moon” is produced by a cross-temporal reflection of sunlight that is then projected back into the sky. Son uses wireless networking, laser projectors, microcontrollers, batteries, solar panels, and detailed calibration to create this masterpiece. Interestingly, Another Moon can be seen up to half a mile away. I really appreciate the spiritual and scientific combination Son used to develop the Another Moon. Mimi Son was born, lives, and works in Seoul as an artistic director, professor, curator, and artist. Her master’s degree is in Digital Media Art and Design; she has an additional major in Interaction Design. In 2009 she and her partner Elliot Woods founded the art studio Kimchi and Chips. Her works are heavily influenced by Buddhist philosophy and geometry.
Link: https://kimchiandchips.com/works/anothermoon/

The Creative Practice of an Individual: Amanda Cox

Alexia Forsyth
15-104
October 25, 2022

Amanda Cox presented for the Eyeo Festival in 2018 where she discussed processes, practices, and lessons she has learned through her career. She is the editor of a feature of The New York Times called The Upshot. It launched in 2014 and is aimed to provide news and commentary via graphics and charts. Amanda graduated from St.Olaf in 2001 with a bachelor’s degree in math and economics and graduated from the University of Washington in 2005 with a master’s degree in statistics. She won the National Design Award in 2009 and the Excellence in Statistical Reporting Award in 2012. I really admire Amanda’s work because it is useful and practical. Through her data visualization, she has been able to make a difference in media politics and information distribution. She worked on a project that measured the percentage of children who grew up rich and how their wealth changed as an adult. She looked into differences in race and incarceration rate. In the 2016 election, her team worked on a project called ‘Chance of Winning Presidency’ that repetitively forecasted the likelihood of Clinton and Trump’s success. Although the code behind each of her projects is complicated the outer visual is simple and user-friendly. She explained the impact and importance of her work more than the code behind it, avoiding using intimidating jargon.

Moritz Stefaner’s Impfdashbord

Looking Outwards 07: Information Visualization

Alexia Forsyth

Moritz Stefaner is an independent designer and consultant that specializes in data visualization. She is dedicated to helping organizations develop research and data into something beautiful. I really admire the practicality of Stefaner’s work. This type of visualization seems like a useful skill to have in any career path. Her Impfdashbord describes Germany’s Covid-19 vaccine information. She prioritizes a mobile-first design approach, avoiding the common chart formats. As part of her design she even added a “vaccination clock” to help viewers visualize the  pace of vaccination. Her dashboard is really creative and seems to genuinely make an impact in how Germany, and world viewers see the success of covid vaccines. She uses social media preview images and utilizes favicon and puppeteer to generate a cohesive set of images that accurately represent the data

link: https://truth-and-beauty.net/projects/impfdashboard

Andrej Bauer’s random art generator

Andrej Bauer’s random art generator

Alexia Forsyth

Bauer’s random art generator utilizes pseudo-random numbers to construct a mathematical formula. This formula is responsible for each pixel color and sequence of random choices. I really admire the semi formed appearance of Bauer’s pieces. Though random, his series have a particular look and create distinct, colorful visuals. His generator is able to transform into completely new and unique pieces with one word change in the program. I appreciate the versatility. For example, this particular piece, can be interpreted in many different ways; for me, it looks like a stingray.The artist uses an acyclic directed graph coded in the python coding language and implemented in ocaml.

Link: https://www.random-art.org/about/

Landscape by Afanassy Pud 

Alexia Forsyth

Pud is a Russian contemporary artist. His work has been displayed in over twenty exhibits since 1970. His piece “Landscape” is a three-dimensional tapestry showing a colorful collection of trees and hills. I really admire the traditional aspects of the landscape that are stylized with more modern ideas. Afanasy Pud transforms the common image of trees and hills into a psychedelic visual experience. The artist considers himself a scientist and programmer. He used Corel and Photostyler software to create his pieces. More recently, he favors CorelPhotopaint and FractalDesignPainter as his main source of composition. His artistic sensibilities are demonstrated through the overlaying of colors and odd patterns onto a plain image.

Link: https://digitalartarchive.siggraph.org/artwork/afanassy-pud-landscape/

Landscape by Afanassy Pud

04 Project: Alexia

sketch
//Alexia Forsyth
//aforsyth
//Section A

var dx1;
var dy1;
var dx2;
var dy2;
var angle = 3;
var numLines = 350;


function setup() {
    createCanvas(400, 300);
    background(255,240,105);
    dx1 = (25)/numLines;
    dy1 = (135)/numLines;
    dx2 = (25)/numLines;
    dy2 = (-135)/numLines;
}

function draw() {

	push();//saves original origin
	translate(100,100); //translate by 100 for the sun center
    var x1 = -(width);
    var y1 = height/2;
    var x2 = 0;
    var y2 = height/2;

    //dark red bottom layer of lines
    for (var i = 0; i <= numLines; i += 1) {
    	stroke(215,100,20);
        rotate(radians(angle));
        line(x1, y1, x2, y2);
        x1 += dx1;
        y1 += dy1;
        x2 += dx2;
        y2 += dy2;
    }

    //revert to original coordinates
    var x1 = -(width);
    var y1 = height/2;
    var x2 = 0;
    var y2 = height/2;
    numLines -= 20;//reduce number of lines by 20
    angle +=5; //rotate by 5

    //3rd dark orange layer
    for (var i = 0; i <= numLines; i += 1) {
    	stroke(205,95,0);
        line(x1, y1, x2, y2);
        rotate(radians(angle));
        line(x1, y1, x2, y2);
        x1 += dx1;
        y1 += dy1;
        x2 += dx2;
        y2 += dy2;
    }

    //revert to original coordinates
    var x1 = -(width);
    var y1 = height/2;
    var x2 = 0;
    var y2 = height/2;
    numLines -= 20;//reduce number of lines by 20
    angle +=5; //rotate by 5

    //second bright orange layer
    for (var i = 0; i <= numLines; i += 1) {
    	stroke(204,153,0);
        line(x1, y1, x2, y2);
        rotate(radians(angle));
        line(x1, y1, x2, y2);
        x1 += dx1;
        y1 += dy1;
        x2 += dx2;
        y2 += dy2;
    }

    //revert to original coordinates
    var x1 = -(width);
    var y1 = height/2;
    var x2 = 0;
    var y2 = height/2;
    angle +=5; //angle by 5
    numLines -= 20; //subtract number of lines by 20

    //outer yellow lines
    for (var i = 0; i <= numLines; i += 1) {
    	stroke(250,236,30);
        line(x1, y1, x2, y2);
        rotate(radians(angle));
        line(x1, y1, x2, y2);
        x1 += dx1;
        y1 += dy1;
        x2 += dx2;
        y2 += dy2;
    }

    pop(); //revert to original origin
    fill(204,153,0);
    noStroke();
    ellipse(113,95,150,150); //sun

    noLoop();
    
}

‘FORMS – String Quartet’ by Playmodes

Alexia Forsyth

Section A

‘FORMS – String Quartet’ is an automated emulation of string musicians. Not only is the music beautiful, but the visual display is stunning and captures the essence of the song. The artists use a color code that identifies the instruments on the score and randomizes them. The generator is known as “The Steaming Bot”. The graphics are then transformed into sound. “The Steaming Bot” uses compositions from John Cage, Gyorgi Ligetti, Mestrews Quadreny, and Karlheinz Stockhausen. Every part of the network ensemble plays instrumental roles such as rhythm, harmony, and texture. The artist explains, “Images become sound spectrums, making it possible to hear what you see” (Playmodes 8). Their artistic sensibility is shown through the visualization of the musical cords and their relation to the cords.

Video: https://vimeo.com/553653358?embedded=true&source=video_title&owner=7721912

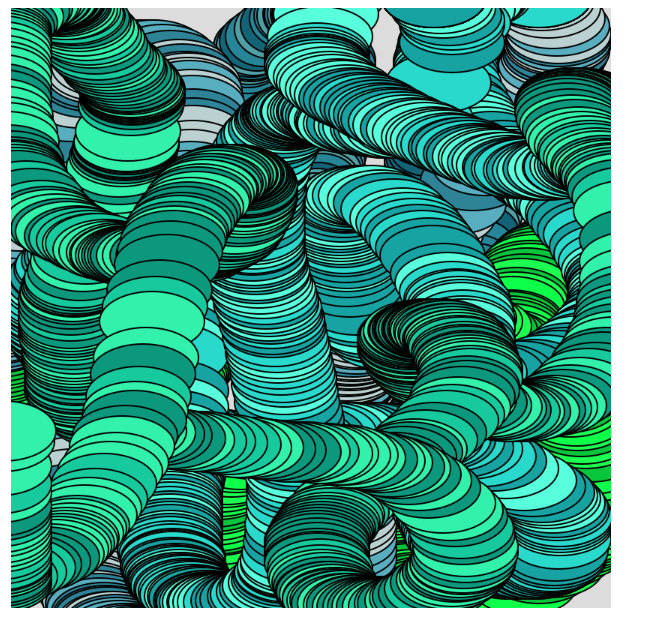
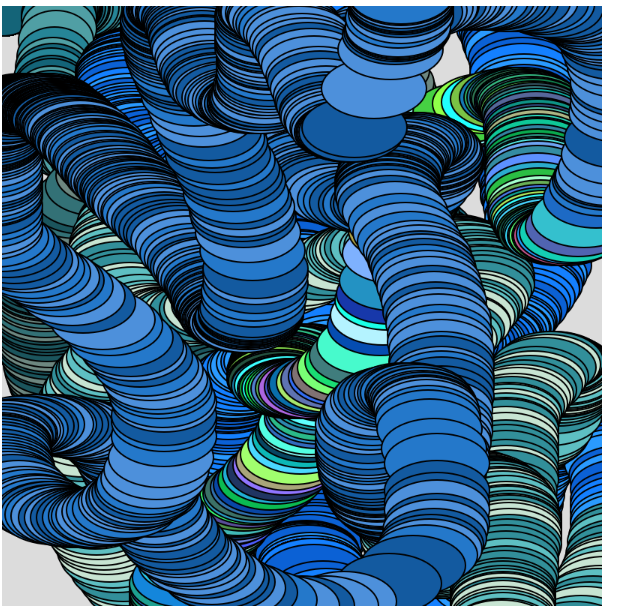
Project 03: Alexia Forsyth

sketch
//Alexia Forsyth
//aforsyth
//Section A

var hVelocity = 50;
var vVelocity = 50;

var w = 50;
var h = w * .8;

var count = 0;

var drawing = true;

r = 20;
g = 100;
b = 120;

function setup() {
    createCanvas(400, 400);
    background(220);
}

function draw() {
	if (drawing == true){
	print("Move your mouse to draw...")
	print(count);

	if (count == 50 || count == 100 || count == 150 || count == 200){
		w = 70;
		r = random(5,50);
		g = random(50,200);
		b = random(50,220);
	}
	else if (count == 300){
		drawing = false;
	}

	if (random(3) <= 1){
		fill(r, g, b);
	}
	else if (random(3) > 1 & random(3) < 2){
		fill(r+(.88*r), g+(.33*g), b+(.26*b));
	}
	else{
		fill(r+(3*r), g+(.59*g), b+(.37*b));
	}

	ellipse(mouseX,mouseY, w, h);

	if(mouseX >= width || mouseY >= height || mouseY <= 0 || mouseX <= 0){
		hVelocity = -hVelocity;
		vVelocity = -vVelocity;
		count += 1;
	}
	
}
else{
	print("Stop");
}

}

Some of my examples: