I looked into copyrights and the sale of the graphic artist Beeple’s artwork called “Everydays: The First 5000 Days” for $69.3 million in 2011. This kind of digital artwork is considered a non-fungible token. This means the ownership of a digital artwork can change, but the copyright still remains with the artist. Its record sales figure comes from the push for the NFTs to gain traction and become more commodifiable. It signifies a change in the art market and shows that more NFT can be bought and sold. The concept of NFTs evolved from the buying and selling of central art, digital artwork and video works, in the art world. Digital artists now can sell their artwork with more certainty that it will not cause legal issues.
Author: Ana
Project 9 – Portrait
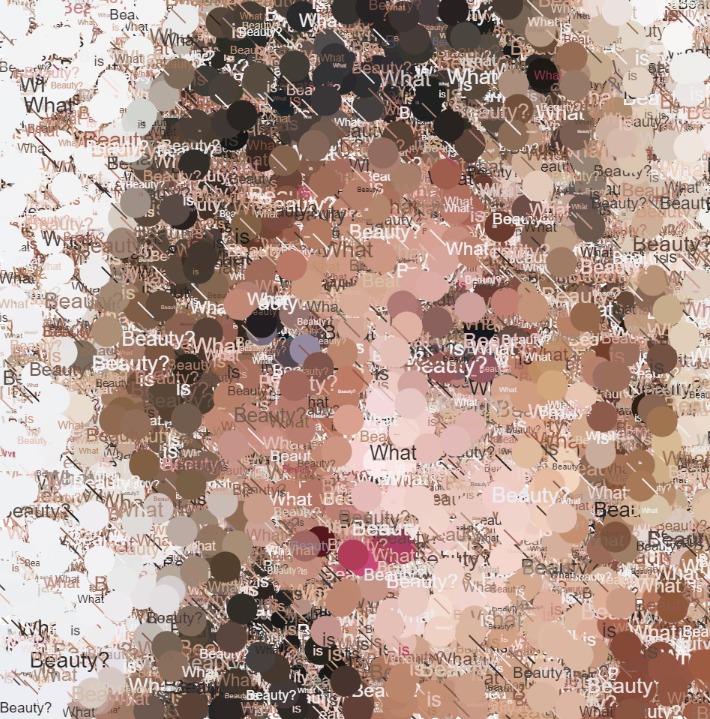
What is Beauty?
// Ana Furtado
// Section E
// Project 9 Computational Portrait
//What is Beauty?
let img;
let smallPoint;
let largePoint;
function preload() {
//img = loadImage('https://i.imgur.com/pl5VSHB.jpeg')
img = loadImage('https://i.imgur.com/hxAyzbU.jpeg')
}
function setup() {
createCanvas(480, 480);
smallPoint = 10;
largePoint = 15;
img.resize(width, height);
imageMode(CENTER);
background(255);
noStroke();
img.loadPixels();
frameRate(75);
}
function draw() {
//paint the image using dots
let point = map(mouseX, 0, width, smallPoint, largePoint);
let x = floor(random(img.width));
let y = floor(random(img.height));
let pix= img.get(x,y);
fill(pix, 128);
//fill(pix);
ellipse(x, y, point, point);
//prints What is Beauty? across canvas in random places using image colors
wordtext = ["What", "is", "Beauty?"];
for (var i = 0; i <3; i++) {
fill(pix);
textSize(random(1,15));
text(wordtext[floor(random(wordtext.length))], random(0,width), random(0,height));
//floor gives less messages than round
}
//paints/ further distorts image using randomly placed line of image color
push();
stroke(pix);
let a = random(0,width);
let b = random(0,height);
line(a, b, a+10, b+10);
//line(a, b+10, a+10, b);
pop();
}
The most challenging part of this project was making all the different elements work to distort the existing image to create a new portrait.
Looking Outwards – 09
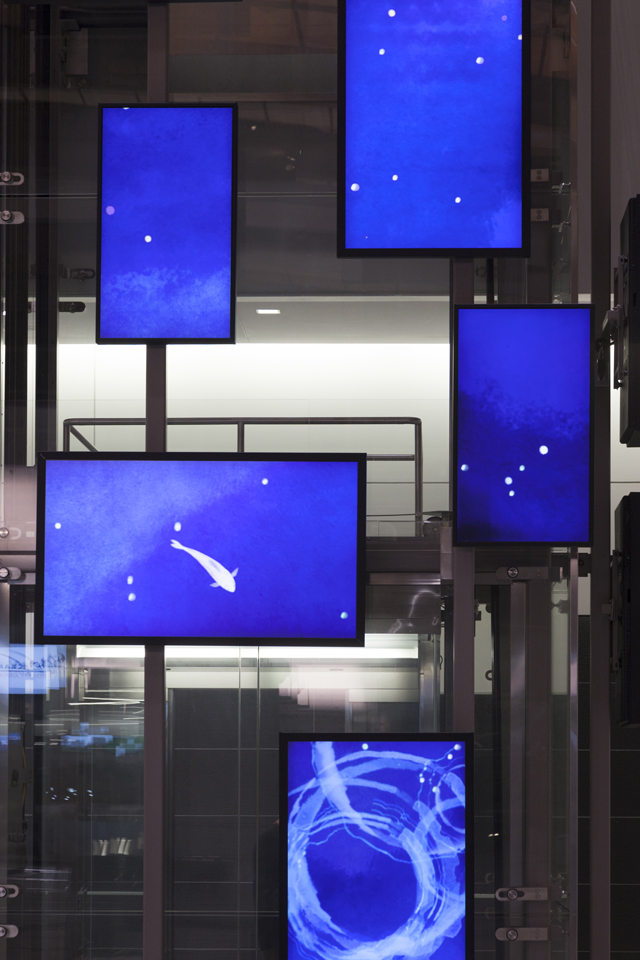
I admire the project Active Ecosystem (SMF) by Camille Utterback and Michelle Higa Fox created in 2011 for Sacramento International Airport’s ticketing hall. I like how it continues the surrounding structure’s idea of “bringing the outside in”. It shows the interest of its maker in its inspiration: the “cycles of growth, movement, and decay in the natural agricultural environment or Sacramento”. The piece changes in response to multiple factors including the elevator that it surrounds, the time of day, and seasons. The piece combines hand drawn animations and dynamic calculations to generate the movement of growing or moving. It embodies the Utterback’s goal of creating physical-digital stems that engage surrounding and people’s bodies instead of just grasping attention of passerbyers. Camille Utterback is an artist with a focus on digital and interactive art. She explores possibilities of linking computational systems to human movement and physicality in many ways. Utterback combines sensing and display technology with custom software. She has a BA from Williams College and an MPS degree from the Interactive Telecommunications Program from New York University.
Looking Outwards – 08
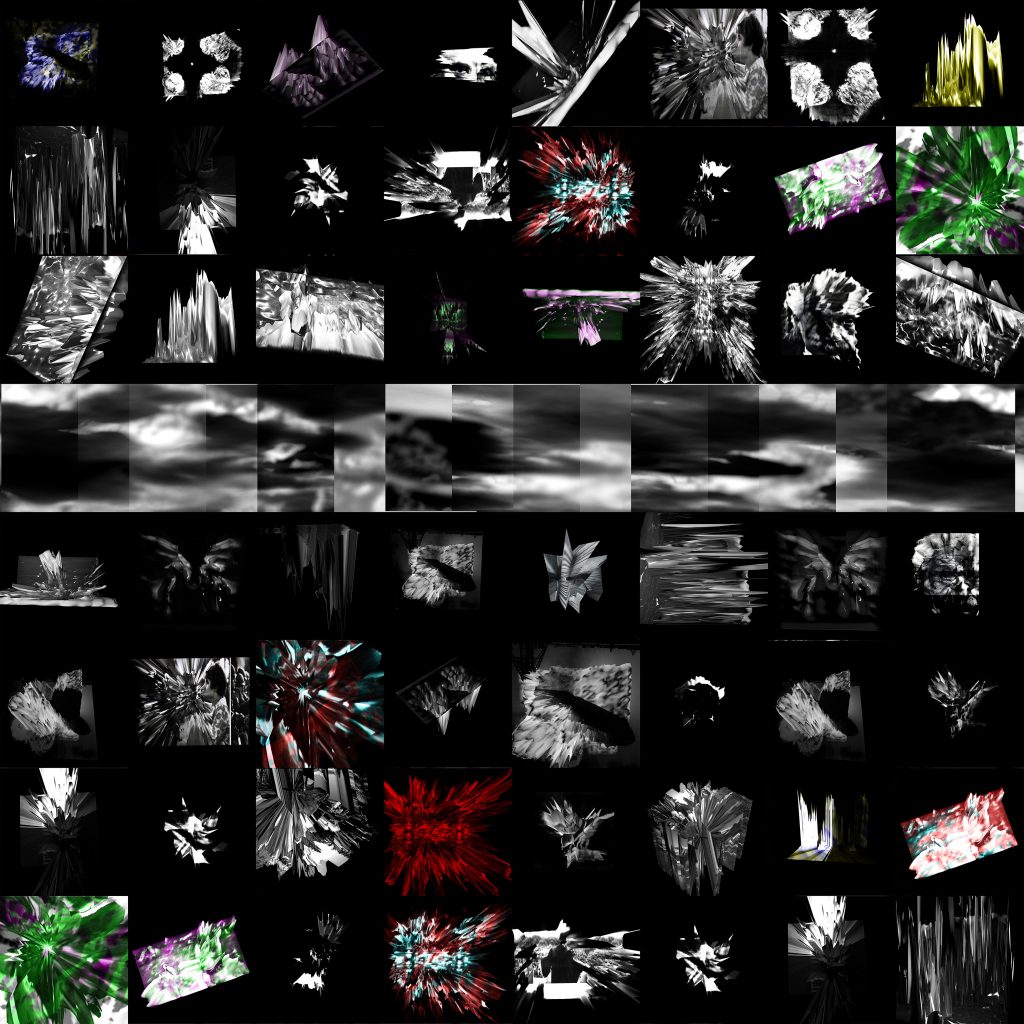
I like the work of Christina “Phazero” Curlee at Eyeo 2019. She has a degree in fine arts and a traditional art background. Phazero is self taught in 3D design and game creation. She began working in game design then later got serious after discovering her passion for it, which shows through in her presentation and work. Phazero says because she is self taught that gives her an edge in game creation because it teaches her to look at concepts differently, applying fine arts to game development creating a unique style. She thinks deeply about symbols and non-verbal communication. This definitely shows through in Phazero’s work “Art-Nouse” and “Artifacts” which is both an art game and an art piece. She uses stories about her past and her roots and also gives context on the game design industry to help people better understand her work and what is unique. She also shows many photographs and videos to help visualize the project and the progression of the project.
http://www.christinazero.com/artifacts.html
Project 7: Curves
Abstract roses using astroids and astroid evolutes. Astroids rotate using mouseX and scale using the minimum of mouseX and mouse Y. Random astroids are added to the canvas. The color of these depends on the mouse’s position on the canvas. If left on canvas they are red, and if on right of canvas they are black. Moving mouse along diagonals creates and in bottom right corner creates best shapes.
// Ana Furtado
// Section E
// Project 7 Composition with Curves
var nPoints = 100;
function setup() {
createCanvas(480, 480);
background(255);
frameRate(10);
}
function draw() {
strokeWeight(3);
//rotates and scales by mouse at top right
//brown/red at left and bottom
push();
translate(width/4, height/4);
scale(mouseX/width);
rotate(radians(min(mouseX,mouseY)));
drawAstroid();
if (mouseX < width/2) {
stroke('brown');
rotate(radians(min(mouseX,mouseY)));
drawAstroid();
}
pop();
//rotates and scales by mouse at bottom left
//brown/red at left and bottom
push();
//translate(width/2, height/2)
translate(width/4 * 3, height/4 * 3);
scale(mouseX/width);
rotate(radians(min(mouseX,mouseY)));
drawAstroid();
if (mouseX < width/2) {
stroke('brown');
rotate(radians(min(mouseX,mouseY)));
drawAstroid();
} if (mouseY > height/2) {
stroke('brown');
rotate(radians(min(mouseX,mouseY)));
drawAstroid();
}
pop();
//rotates and scales by mouse at random location
//move/leve mouse to left of canvas for red atroids
//move/leave mouse to right of canvas for black atroids
//move/leave in top right of canvas to fill with more black atroids
push();
translate(random(0,480), random(0,480));
scale(0.5);
rotate(radians(min(mouseX,mouseY)));
drawAstroid();
if ( mouseX < width/2) {
stroke('brown');
rotate(radians(min(mouseX,mouseY)));
drawAstroid();
}
pop();
//originals that stay in splace
//only show in beginning
//scaled and rotated turns the astroid into an atroid evolute
push();
translate(width/2, height/2);
drawAstroid();
pop();
//stays in place scale 0.5
push();
translate(width/2, height/2);
scale(0.5);
rotate(radians(45));
drawAstroid();
pop();
//stays in place scale 0.25
push();
translate(width/2, height/2);
scale(0.25);
rotate(radians(45));
drawAstroid();
pop();
}
function drawAstroid() {
//Astroid
//https://mathworld.wolfram.com/AstroidEvolute.html
var x;
var y;
var a = 300;
//fill('pink');
noFill();
beginShape();
for (var i = 0; i < nPoints; i++) {
var t = map(i, 0, nPoints, 0, TWO_PI);
//angleMode(DEGREES);
x = a * (cos(t) * cos(t) * cos(t));
y = a * (sin(t) * sin(t) * sin(t));
vertex(x, y);
}
endShape(CLOSE);
constrain(a, 0, 325);
}
I think the most difficult part of this was getting the shape to be represented properly.
Looking Outwards – 07
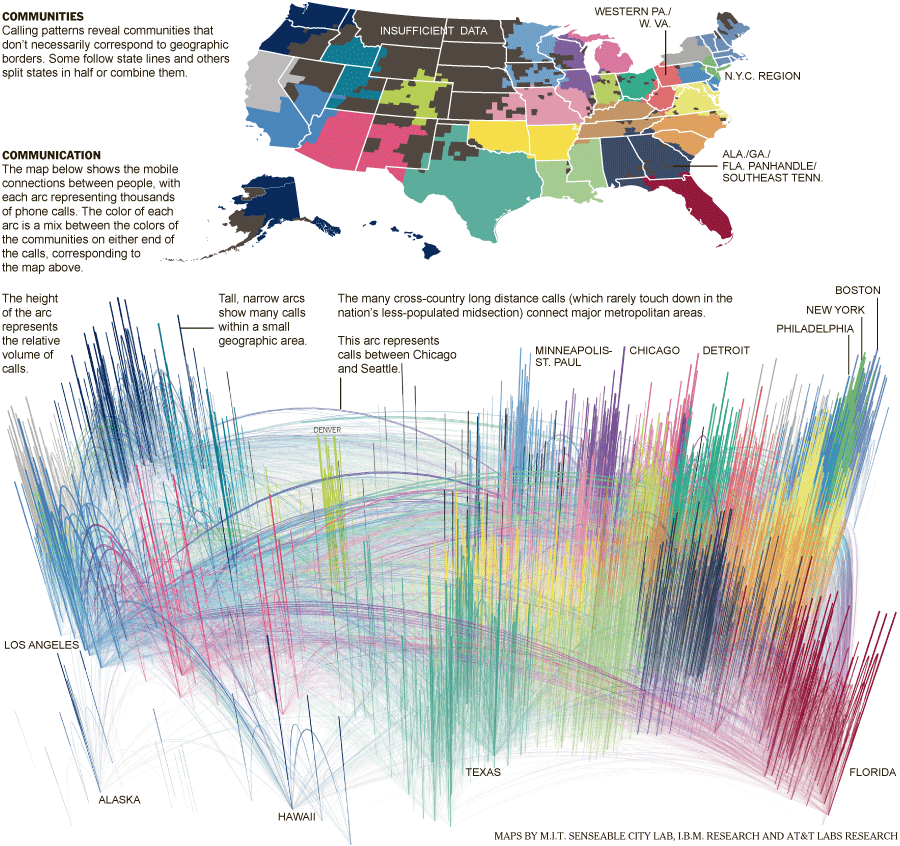
I admire the phone-Call Cartography project by the New York Times in 2011. The aggregate cell phone traffic data from the United States in July of 2010 was analyzed by researchers from M.I.T., AT&T and I.B.M. It shows how cities have become hubs and connect to other parts of the country. These communities shown by different colors on the map have little to do with geographic boundaries. I admire it because it shows patterns of how people are brought together over long or short distances. I think the creators’ artistic sensibilities are shown in the way this enormous amount of data is visualized. For example, the colors used, the areas drawn together, and the focus of the maps. Although, I think it could have been clearer in the second map which lines are connecting different places. Many of the lines are lost because they are too thin, or the colors blend together. Also, it is different to tell where they end because of the angle of the map and because there is no real map underneath, the reader is left with minimal text and shapes as reference.
Looking Outwards – 06
I admire the artwork of Tyler Hobbs called Continuity No. 8 made in 2014. It is from a series of work that is formed by pseudo-random quadrilaterals. The overlap of the quadrilaterals is the negative space, and the positive space is built up by layers. The proximity to the pseudo-random focal point changes the brightness, transparency, and sharpness of the positive space. The first layer helps generate the second layer, helping the work be more cohesive. This entire collection is generated this way, but this piece is my favorite because of its final composition. It reminds me of a subway passing by so fast with the lights bright. It seems never ending and continuous just like the name of the artwork, Continuity. I believe the artist shows their sensibilities in the bias of the pseudo random numbers that are chosen as the focal points of the work and the choice of picking this artwork to be shown. There must have been many iterations made using this process, so I think showing this specific one shows the artist’s sensibilities.
https://tylerxhobbs.com/essays/2014/randomness-in-the-composition-of-artwork
Project 5: Wallpaper
Red Textile Design
The most challenging part of the project was getting the gradients and the for loops to work properly.
// Ana Furtado
// Section E
// Project 5 Textile
function setup() {
createCanvas(570, 600);
background(255); // white background
}
function draw() {
noStroke();
fill(0,0,0);
rect(0,0,600,20);
fill(0,0,0);
rect(0,580,600,20);
long()
lines()
whitecircles()
whitecircles_1()
circles()
noLoop();
}
function long() { //black to red to black ellipses
var red = 20
for (var y = 40; y < 600; y += 40) {
if (y <= 300){
red+=20
} if (y>= 300) {
red -= 20;
}
for (var x = 0; x < 600; x += 95*2) {
//noStroke()
stroke(0);
strokeWeight(7);
fill(red, 0, 0);
ellipse(x,y,190,40);
}
}
}
function circles() { //red to black to red circles and random red smaller circles
var red2 = 255
for (var y = 0; y < 700; y += 40) {
if (y <= 300){
red2-=35;
} if (y>= 300) {
red2 += 35;
}
for (var x = 0; x < 600; x += 95) {
stroke(0);
strokeWeight(1);
fill(red2, 0, 0);
circle(x, y, 30);
fill(random(0,255),0,0);
circle(x,y,15)
}
}
}
function whitecircles() { //white inbetween circles
for (var y = 60; y < 700; y += 40) {
for (var x = 50; x < 600; x += 95) {
stroke(0);
strokeWeight(.75);
fill(255);
circle(x, y, 12);
}
}
}
function whitecircles_1() { //row 1 white inbetween circles
for (var y = 20; y < 60; y += 40) {
for (var x = 50; x < 600; x += 95) {
stroke(0);
strokeWeight(.75);
fill(255);
circle(x, y, 12);
}
}
}
function lines() { //white lines and thin black lines to make grid
for (var x = 50; x < 600; x += 95) {
stroke(255);
strokeWeight(2);
line(x,0, x, 600);
stroke(0);
strokeWeight(.25);
line(x,0, x, 600);
for (var y=60; y<600; y+=40){
//stroke(255);
//strokeWeight(2);
//line(0,20,570,20);
//line(0,y,570,y);
//stroke(0);
//strokeWeight(.25);
//line(0,20,570,20);
//line(0,y,570,y);
}
}
}
Looking Outwards – 05
I admire the Weeping Woman by Carlos Ortega made in 2012. I admire the 3D quality of the character and cloth. The light and shadow are a big part of making this happen. I also admire how the colors blend together to set the mood for the work. The work is based on a version of the Mexican legend of “the weeping woman” and the song called “the weeping woman” by a Mexican band Califanes. I believe the colors, and how the character is posed, and how the ghosts are made reflect the creator’s sensibilities. It was made using Autodesk Mudbox, Autodesk Maya, mental ray, and Adobe Photoshop.
Carlos Ortega Elizalde | CG artist – The Weeping Woman (carlosortega3d.com)
Project 4: String Art
Good luck four leaf clover with abstract land and sky
// Ana Furtado
// Section E
// Project 4 -- String Art
//Q1
var dx1;
var dy1;
var dx2;
var dy2;
var numLines = 40;
//Q2
var bx1;
var by1;
var bx2;
var by2;
//Q3
var ax1;
var ay1;
var ax2;
var ay2;
//Q4
var cx1;
var cy1;
var cx2;
var cy2;
//Right
var ex1;
var ey1;
var ex2;
var ey2;
//Left
var fx1;
var fy1;
var fx2;
var fy2;
function setup() {
createCanvas(400, 300);
background(255); // white background with abstract land and sky
strokeWeight(2);
//Sky
//Q1 lines
stroke(179,243,255); //light blue
line(0, 50, 350, 0);
line(0, 250, 50, 0);
dx1 = (350-0)/numLines;
dy1 = (0-50)/numLines;
dx2 = (50-0)/numLines;
dy2 = (0-250)/numLines;
//Q2 lines
stroke(179,243,255); //light blue
line(350, 0, 400, 250);
line(50, 0, 400, 50);
bx1 = (400-350)/numLines;
by1 = (250-0)/numLines
bx2 = (400-50)/numLines
by2 = (50-0)/numLines
//Land
//Q3 lines
stroke(192,255,135); //light green
line(350, 300, 400, 50);
line(50, 300, 400, 250);
ax1 = (400-350)/numLines;
ay1 = (50-300)/numLines
ax2 = (400-50)/numLines
ay2 = (250-300)/numLines
//Q4 lines
stroke(192,255,135); //light green
line(350, 300, 0, 250);
line(50, 300, 0, 50);
cx1 = (0-350)/numLines;
cy1 = (250-300)/numLines
cx2 = (0-50)/numLines
cy2 = (50-300)/numLines
//Center (4 leaf clover)
//Right
strokeWeight(1.25);
stroke(92,255,92); //green
line(210, 75, 190, 225);
line(275, 140, 125, 160);
ex1 = (190-210)/numLines;
ey1 = (225-75)/numLines
ex2 = (125-275)/numLines
ey2 = (160-140)/numLines
//Left
stroke(92,255,92); //green
line(210, 225, 190, 75);
line(275, 160, 125, 140);
fx1 = (190-210)/numLines;
fy1 = (75-225)/numLines
fx2 = (125-275)/numLines
fy2 = (140-160)/numLines
}
function draw() {
//Sky
//Q1 -- upper left sky
strokeWeight(1);
var x1 = 0;
var y1 = 50;
var x2 = 0;
var y2 = 250;
for (var i = 0; i <= numLines; i += 1) {
stroke(179,243,255); //light blue
line(x1, y1, x2, y2);
x1 += dx1;
y1 += dy1;
x2 += dx2;
y2 += dy2;
}
//Q2 -- upper right sky
var x1 = 350;
var y1 = 0;
var x2 = 50;
var y2 = 0;
for (var i = 0; i <= numLines; i += 1) {
stroke(179,243,255); //light blue
line(x1, y1, x2, y2);
x1 += bx1;
y1 += by1;
x2 += bx2;
y2 += by2;
}
//Land
// Q3 -- bottom right land
var x1 = 350;
var y1 = 300;
var x2 = 50;
var y2 = 300;
for (var i = 0; i <= numLines; i += 1) {
stroke(192,255,135); //light green
line(x1, y1, x2, y2);
x1 += ax1;
y1 += ay1;
x2 += ax2;
y2 += ay2;
}
//Q4 -- bottom left land
var x1 = 350;
var y1 = 300;
var x2 = 50;
var y2 = 300;
for (var i = 0; i <= numLines; i += 1) {
stroke(192,255,135); //light green
line(x1, y1, x2, y2);
x1 += cx1;
y1 += cy1;
x2 += cx2;
y2 += cy2;
}
//Green Center (4 leaf clover)
//Right
strokeWeight(1.25);
var x1 = 210;
var y1 = 75;
var x2 = 275;
var y2 = 140;
for (var i = 0; i <= numLines; i += 1) {
stroke(92,255,92); //green
line(x1, y1, x2, y2);
x1 += ex1;
y1 += ey1;
x2 += ex2;
y2 += ey2;
}
//Left
var x1 = 210;
var y1 = 225;
var x2 = 275;
var y2 = 160;
for (var i = 0; i <= numLines; i += 1) {
stroke(92,255,92); //green
line(x1, y1, x2, y2);
x1 += fx1;
y1 += fy1;
x2 += fx2;
y2 += fy2;
}
//Stem
strokeWeight(3);
stroke(92,255,92); //green
line(200,150, 200, 270)
noLoop();
}
The most challenging part of this project was keeping track of which variables were being used and if the coordinates were right.