![[OLD SEMESTER] 15-104 • Introduction to Computing for Creative Practice](wp-content/uploads/2023/09/stop-banner.png)
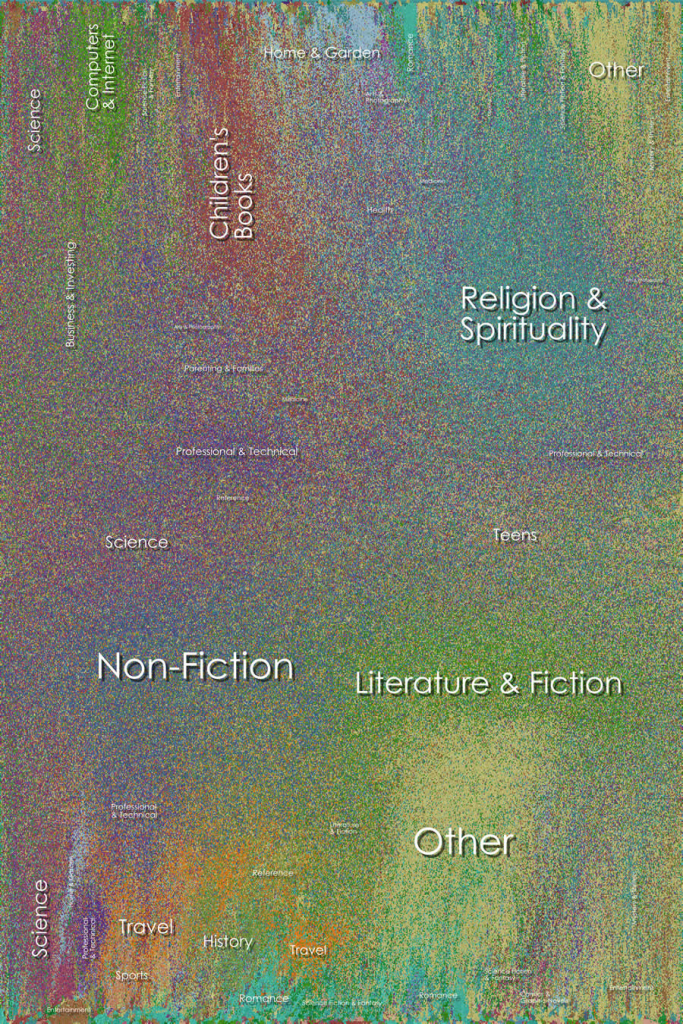
I really admired Chris Harrison’s project named Amazon Book Map. Which is basically a synthesis of the type of book data available on amazon. Every genre of book is color coded and displayed in a map format which looks more or less like a gradient. I really like the fact that the data is clustered on the map in the form of many small mosaics. I also enjoyed reading about the various approaches Harrison took in order to get to his final form, like making mosaics of the book covers. The fact that the map took 140 hours to be generated on wikiviz is also astonishing as it managed to map out more than 700,000 books on Amazon’s interface. The books began to cluster together because of their respective color codes, turning them into clusters of similar natured color dots and binding the entire map together. I do not know much about the algorithms that generated this synthesized piece of art representing a particular data set, but I do admire the intricate details it depicts. In my opinion, the artist himself is confused whether the piece manifested his ideals and motives as he claimed it to be ‘hard to read’ however, I feel that it is a wonderful piece to look at which amalgamates an unconventional data set.