Agenda
- Personal introductions
- Rule-Based Drawing Games (Algorithm Ice-Breaker)
- Web site overview (Deliverables, Daily Notes, login procedure)
- Google calendar & semester grand overview
- Examine Offering #1; Upload & post your Drawing Machine
- Review Drawing Machines
Break (2:50-3:00)
- Drawing Machines, 1950-1970
- Deep Dive: Vera Molnar
- Tools & Resources; Scalable Vector Graphics. Re-Coding Des(Ordres), 1970.
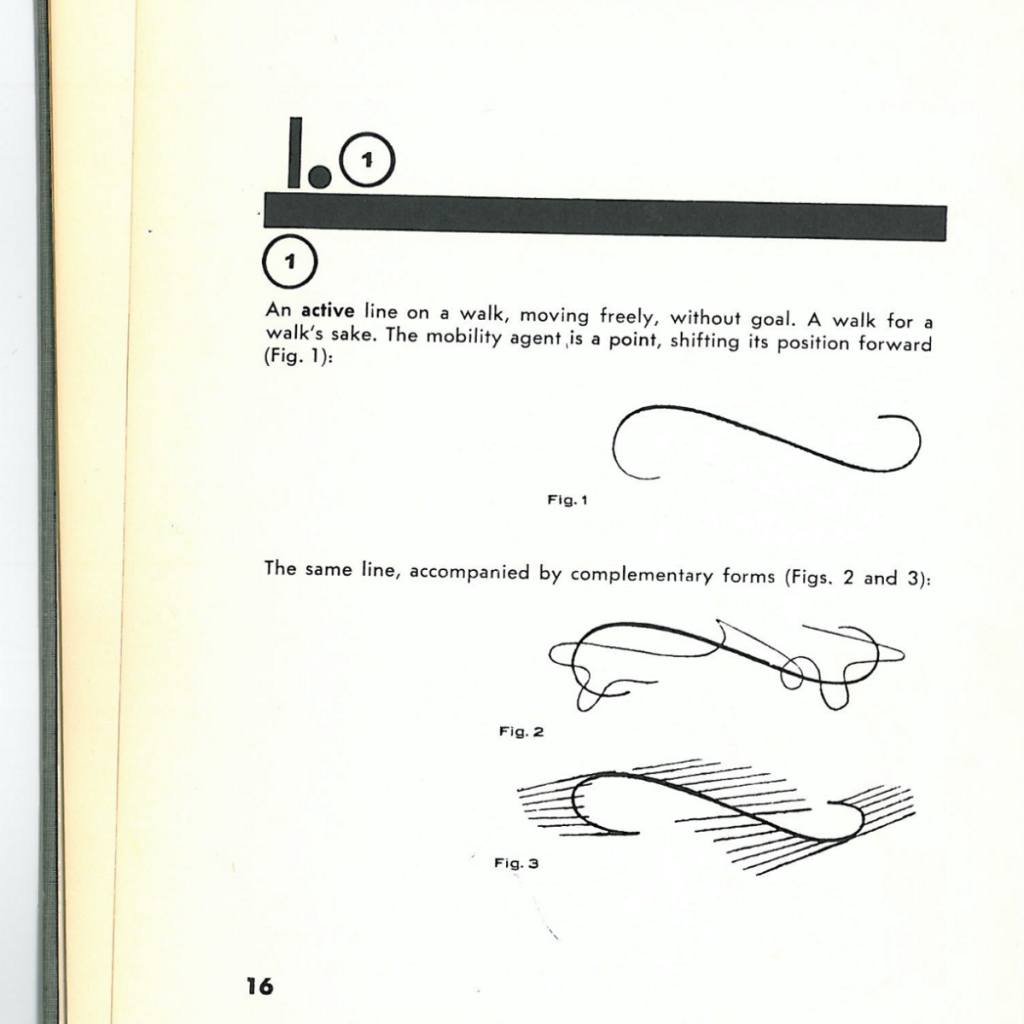
- Lines! A line is a dot that went for a walk.
- Overview, Offerings #2
Drawing Machines, 1950-1970
Ivan Sutherland’s Sketchpad, MIT 1963 (Action starts at 4:20)
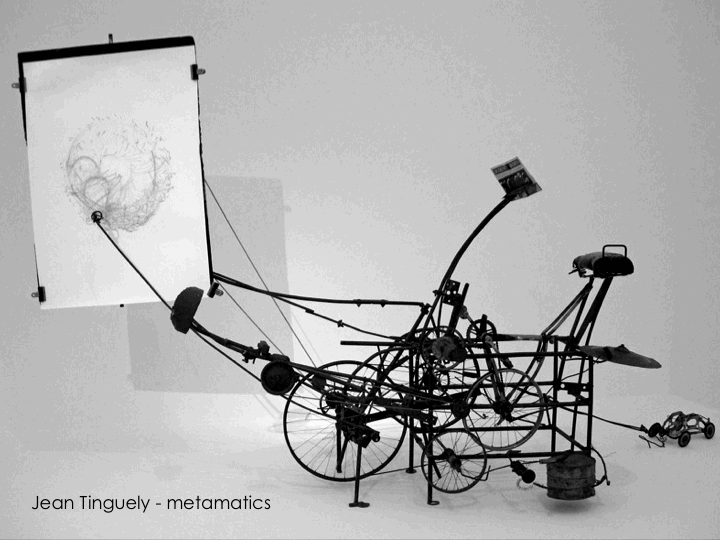
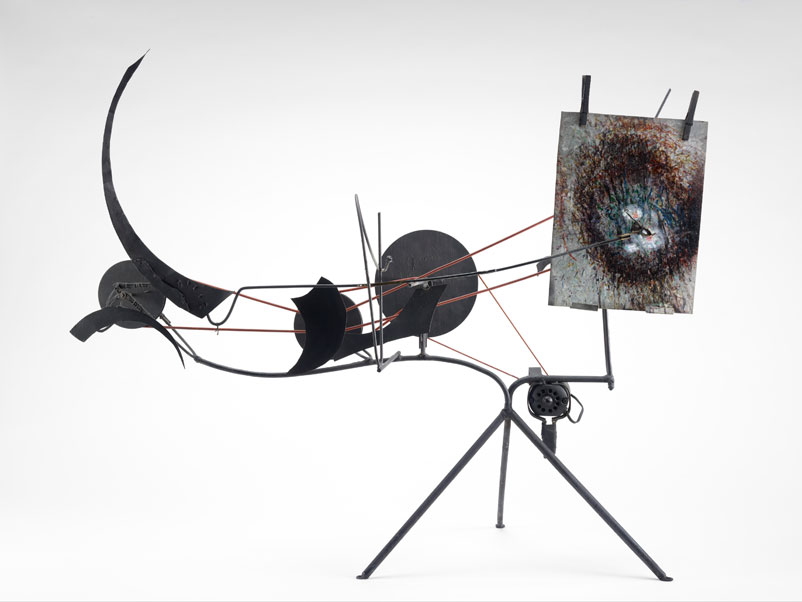
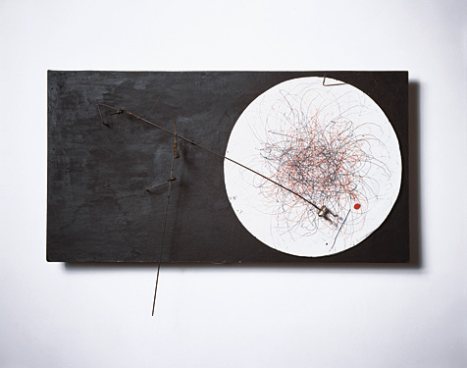
Jean Tinguely, Swiss kinetic sculptor known for the self destructing machine (1960).
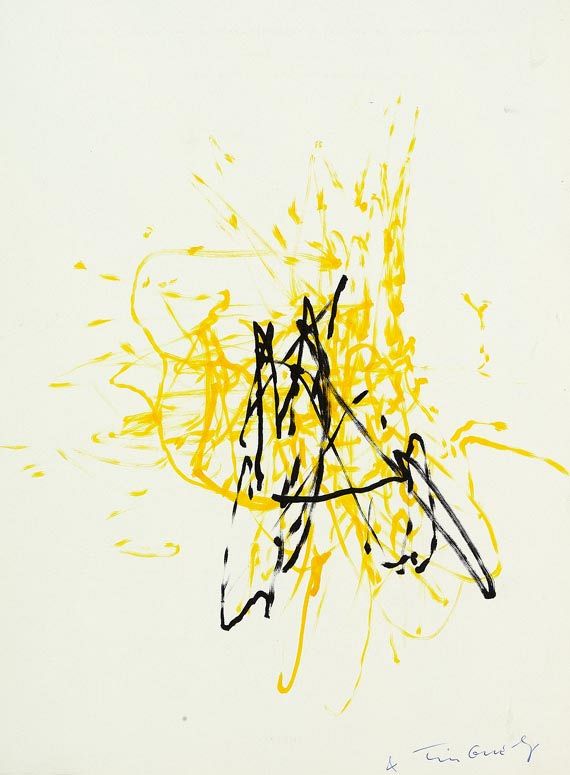
In the 1950s, he produced a body of work known as metamatics. These were a parody of American “action” painting, such as by Jackson Pollock.
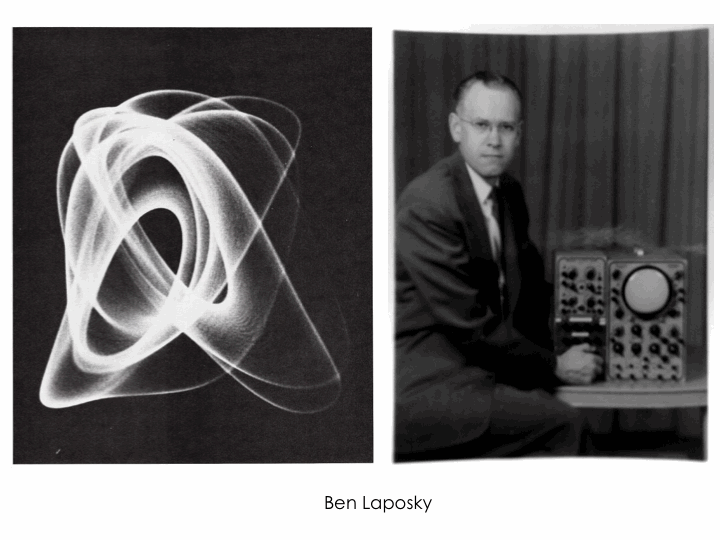
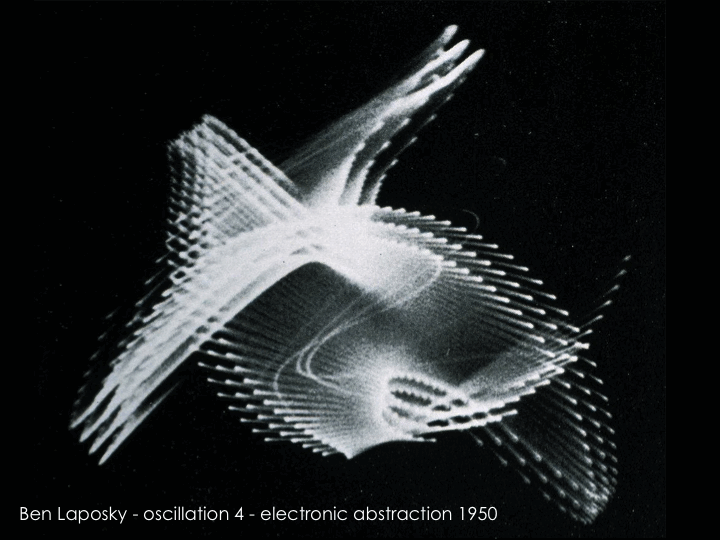
In the early 1950s, American mathematician and artist Ben Laposky made the first images that we would now call computer-generated, photographing the output of an oscilloscope.
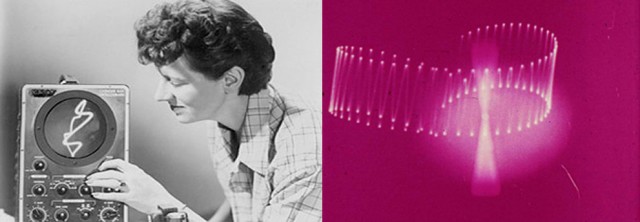
American animator, Mary Ellen Bute used a similar technique in the early 1950s, to produce abstract animated films which she called ‘Abstronic’.
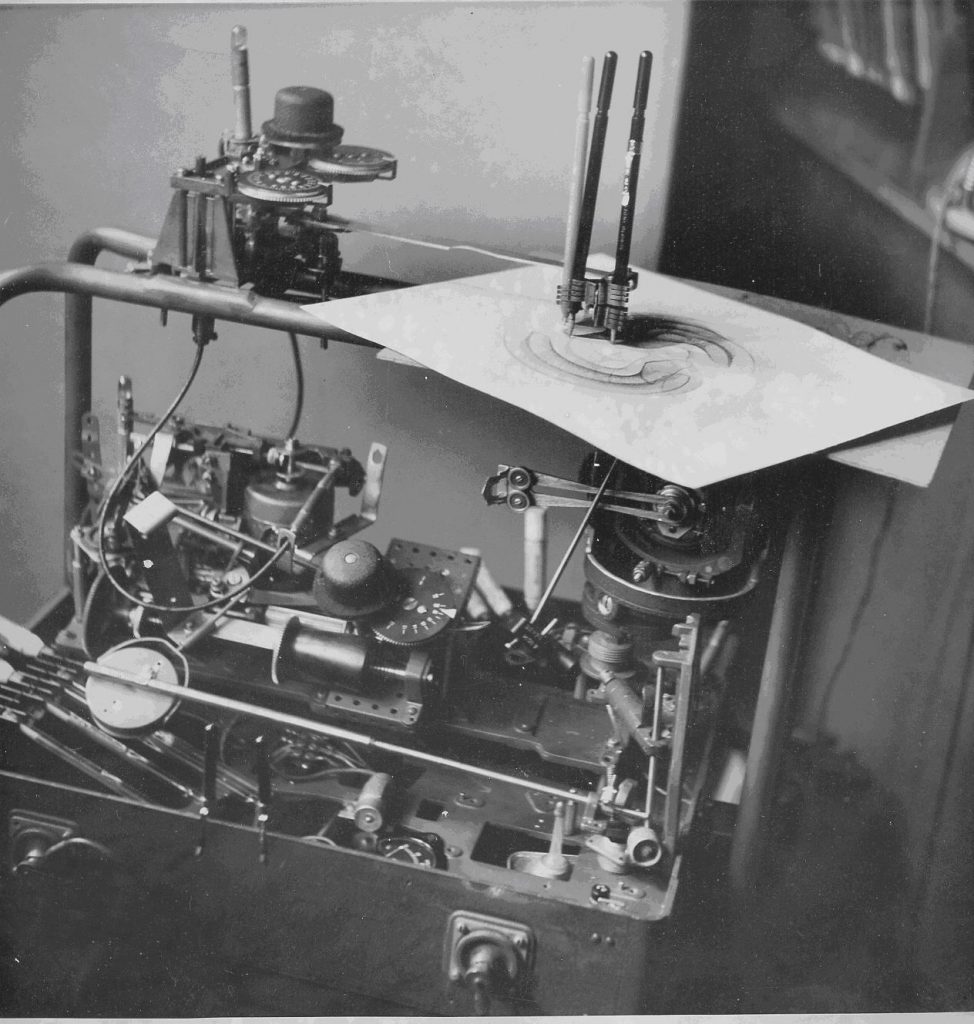
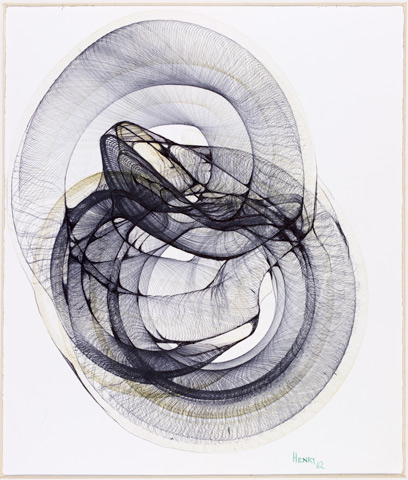
In the 1950s, British artist Desmond Paul Henry created plotter drawings using decommissioned analog/mechanical “bombsight computers” which were employed in World War II bombers to calculate the accurate trajectories of bombs and missiles. (This strategy was also used by American abstract animator, John Whitney.)
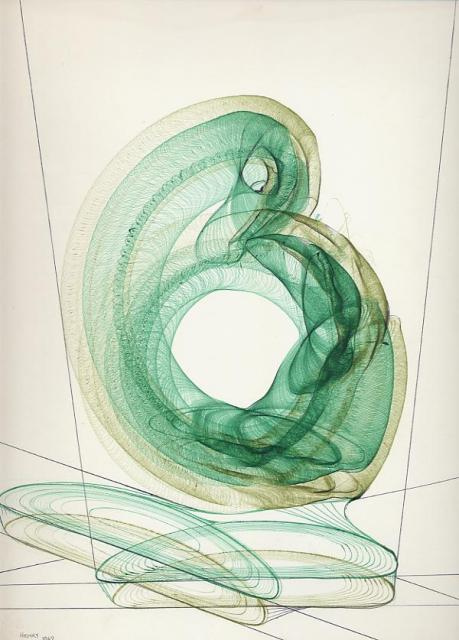
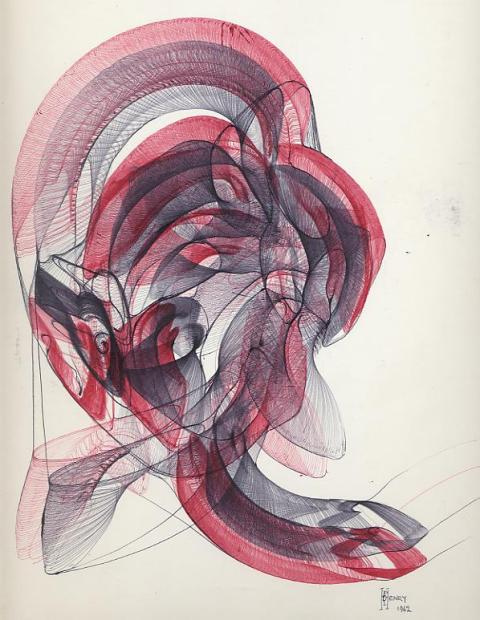
These artists seemed to be fascinated by the apparent randomness (unpredictability) of these machines and let them “do their thing”.
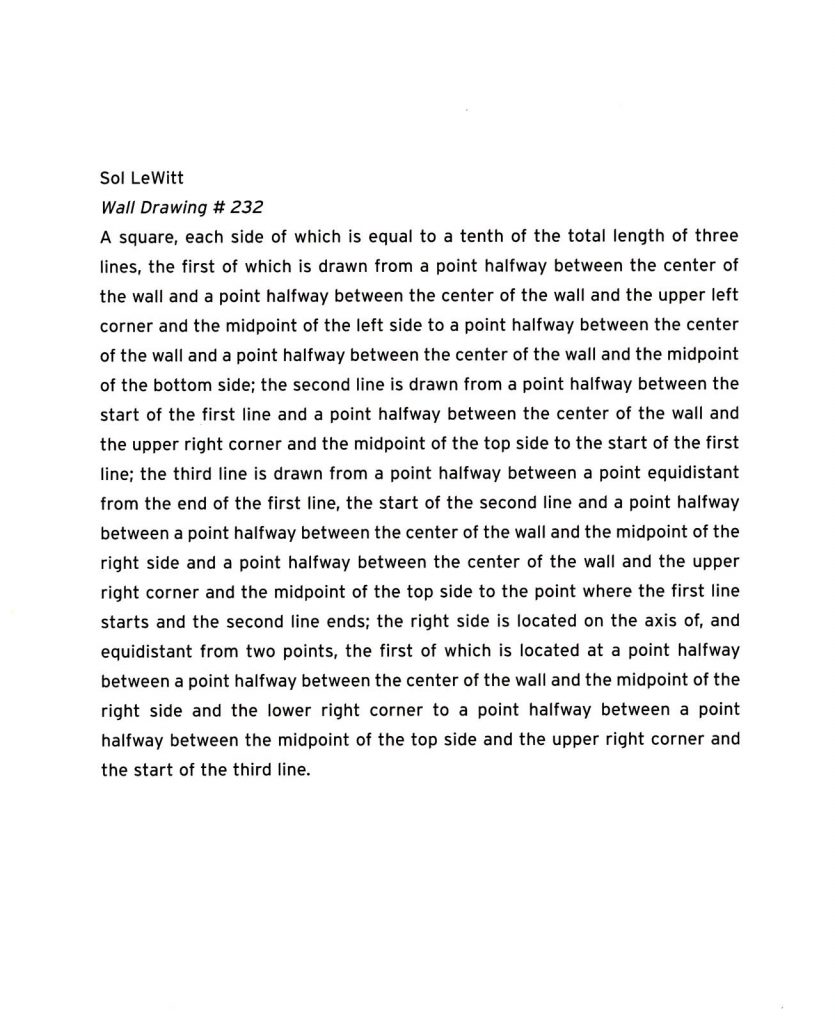
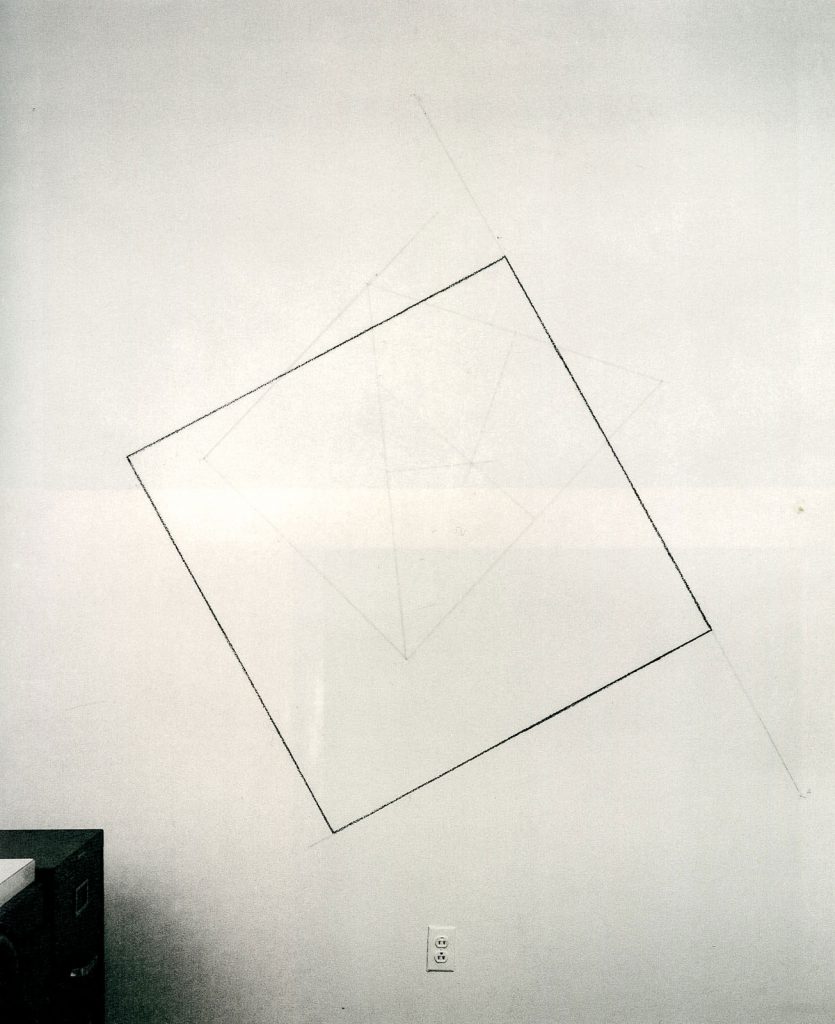
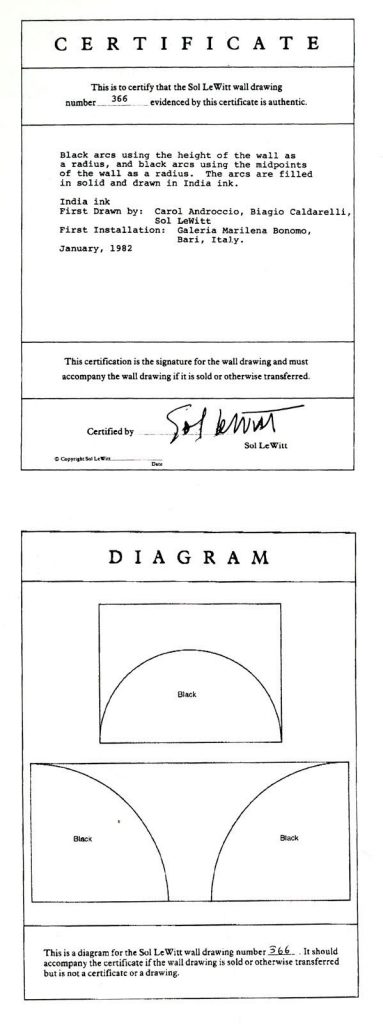
On the opposite side of the algorithmic spectrum, there was Sol LeWitt, who didn’t use computers but conceived many of his works as a series of instructions. In point of fact, they were indeed intended to be created by “machines”: art gallery workers.
This is the result of the sequence of instructions.
What is the status of authorship and ownership when the works are just instructions that anybody can execute?
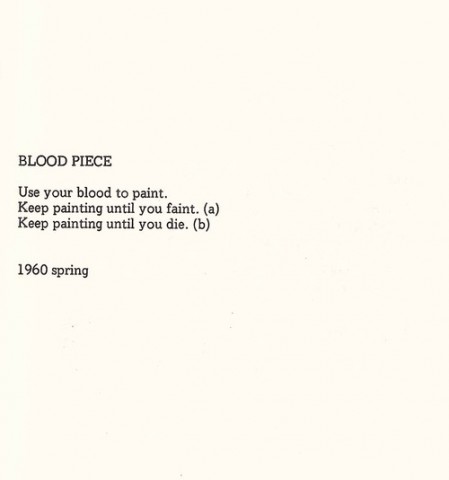
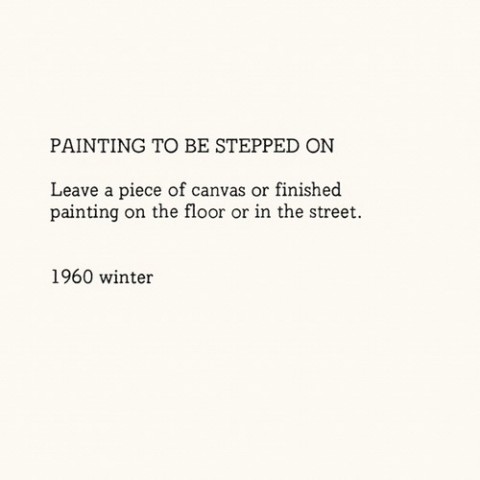
Sol Lewitt was part of the Conceptualist movement. In the 1960s these artists enjoyed provoking the question as to whether an artwork could take the form of a set of instructions, i.e. if the artwork, technically, had no material existence. Another participant in this (and the related Fluxus movement) was Yoko Ono, who created a book of instructional “paintings” called Grapefruit.
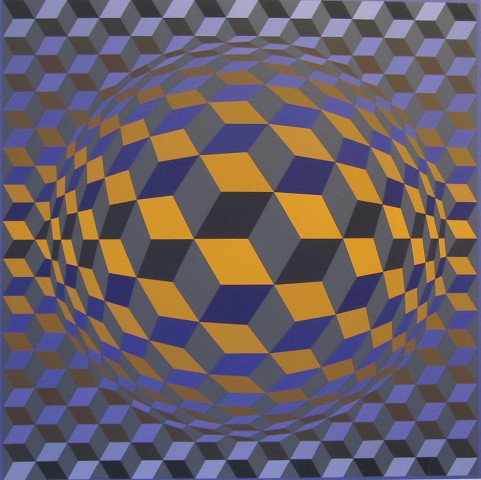
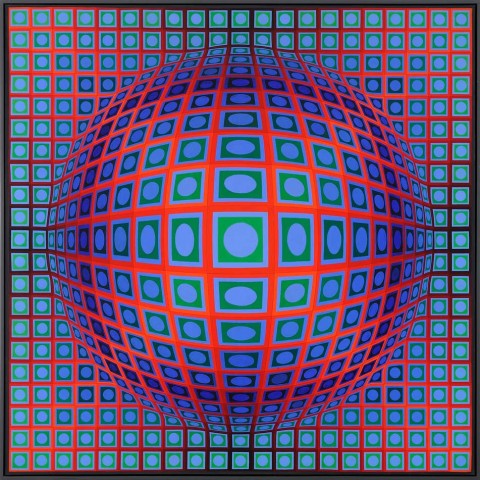
In parallel with conceptual art, another form of procedural or rule-based art evolved around this time as well: Optical Art, or “Op-Art”. A leader of this movement was Hungarian artist, Victor Vasarely:
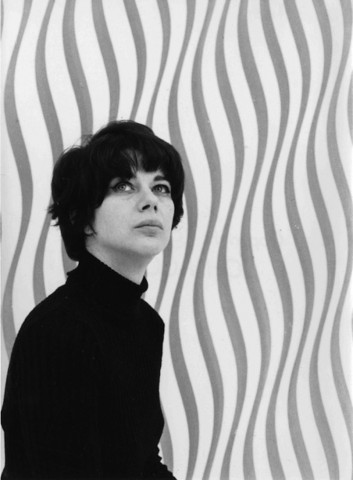
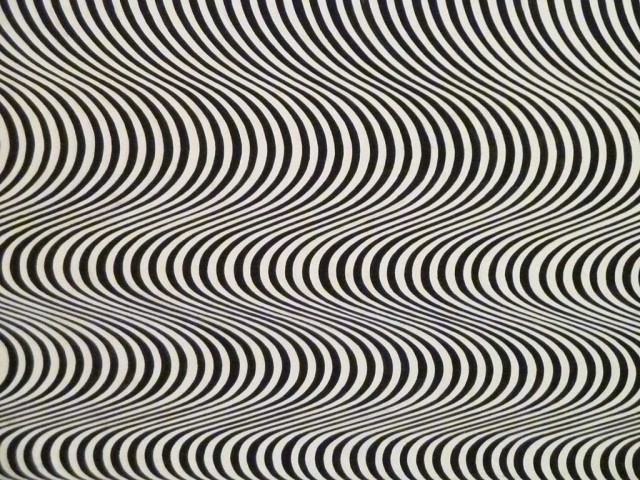
British artist Bridget Riley was another:
There was a major exhibition of Op-Art, “The Responsive Eye” at the MoMA in 1965. (The catalogue is really worth a look.) One important aspect of Op-Art was its “interactive” quality. Often the viewer became very involved in perceiving the work: moving around it, stepping back and forth, and blinking a whole lot.
https://www.youtube.com/watch?v=ek_lQJsU41U
Historic Computer Art
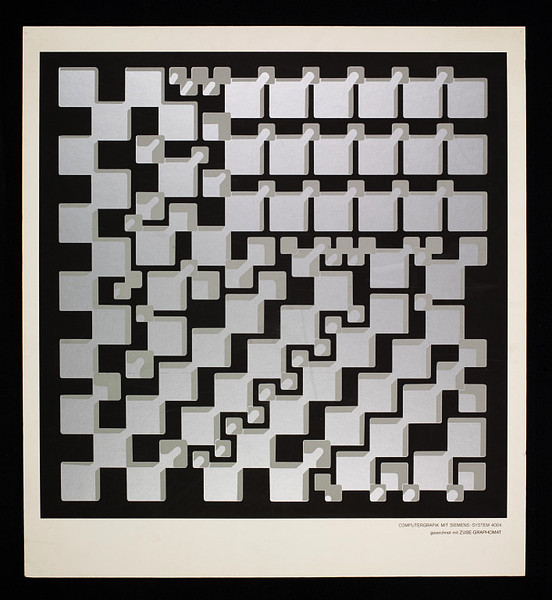
While the Conceptual and Fluxus artists (e.g. Lewitt & Ono) were thinking about rule-based art, and while the Op-Artists were thinking about mathematically-motivated, mind-bending forms, the early computer artists were thinking about both of these things, and how they could use new technologies to create them. It wasn’t long after Ivan Sutherland introduced visually-oriented computing (c. 1963) that artists got involved. The first exhibitions of computer-generated art were held in the spring of 1965. Computer art is older than acrylic paint.
Georg Nees, 1965-1968.
In the mid-60s, as the first image plotters became available, artists began to obtain access to mainframe computers. Usually their access was limited to late nights and weekends.
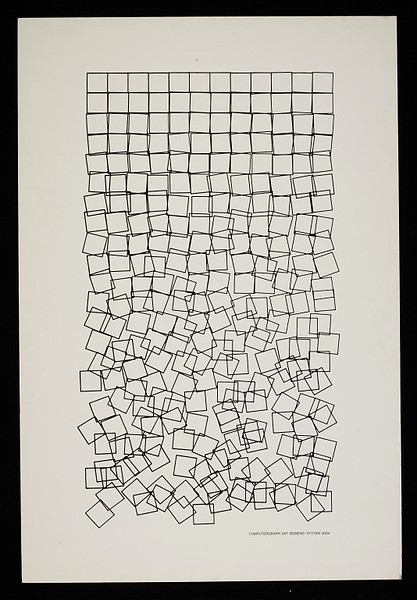
Georg Nees – Schotter, 1968. Like many early computer artists, Nees had to write his own graphics libraries. His works often deals with order vs disorder. He also made the world’s first computer-generated sculpture in 1968 using a computer aided milling machine.
Deep Dive: Vera Molnár
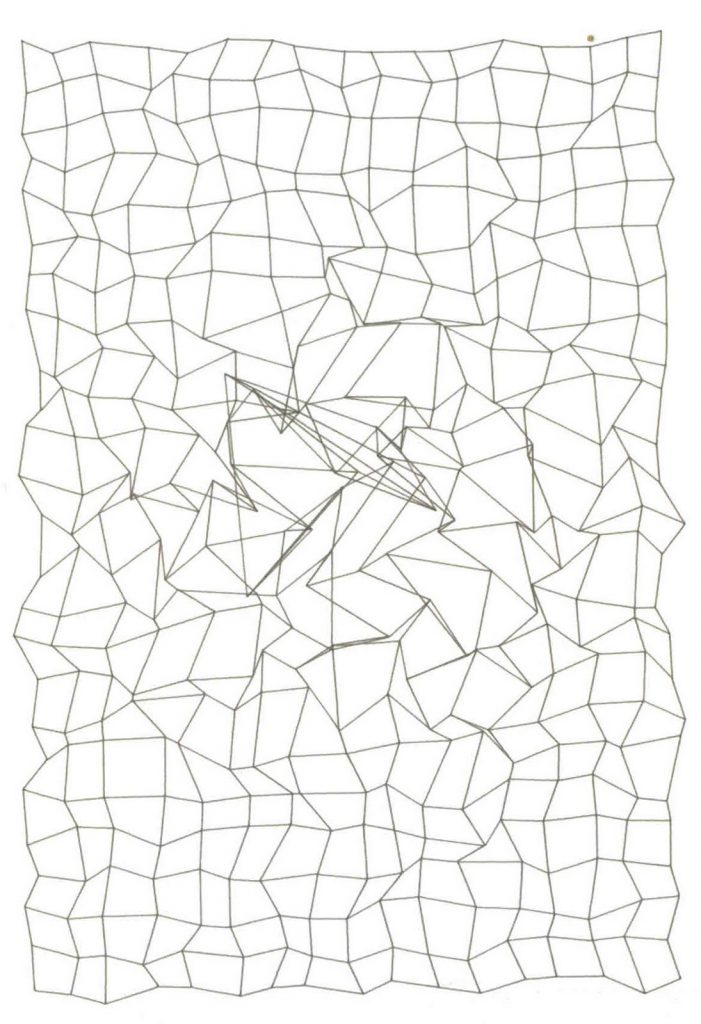
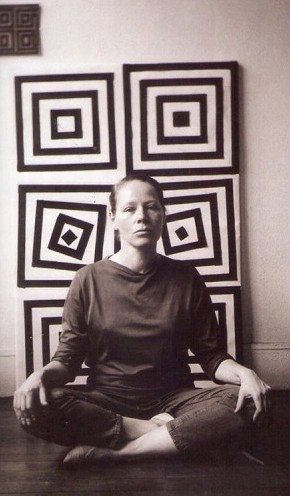
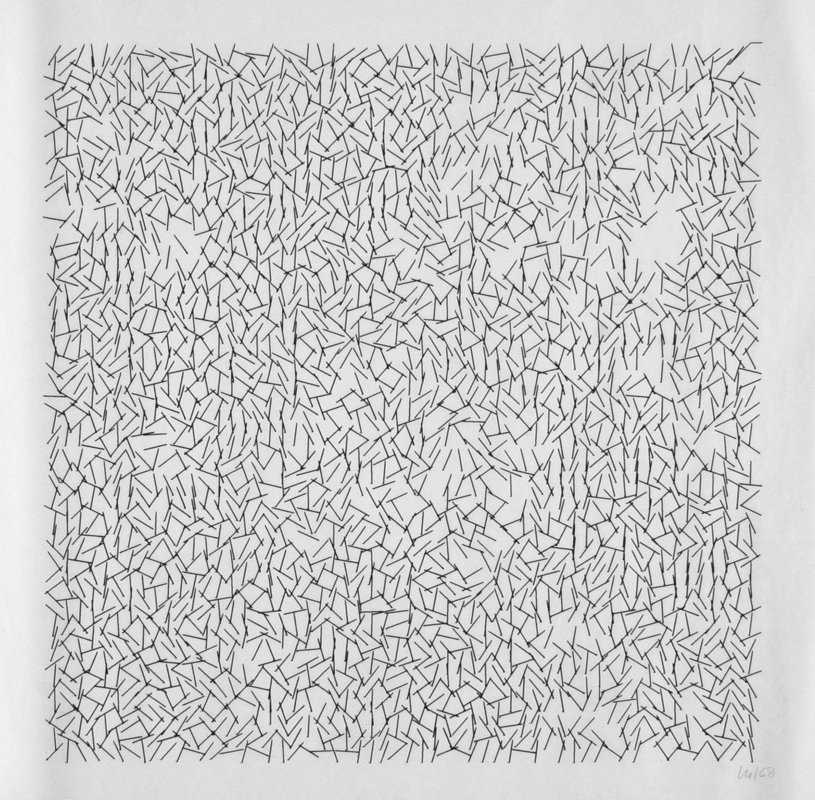
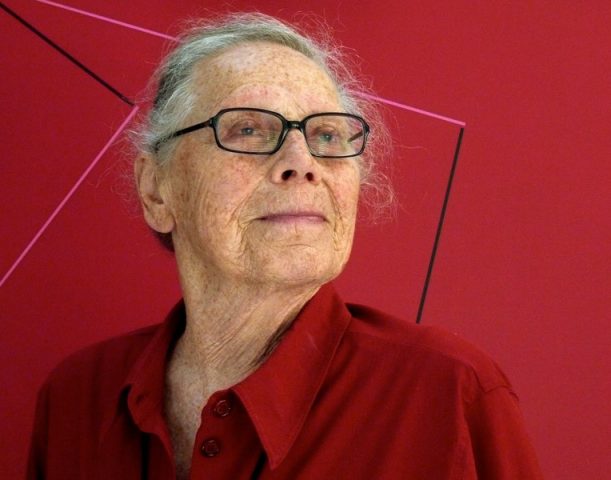
Vera Molnar, born 1924, is a living Hungarian-French artist who was one of the first ten people to make art with a digital computer. She started developing algorithmic images (by hand, with pen on paper) in 1959; in 1968, she started working with a computer at the experimental psychology lab in Sorbonne, where she wrote FORTRAN programs to create her first plotter drawings.
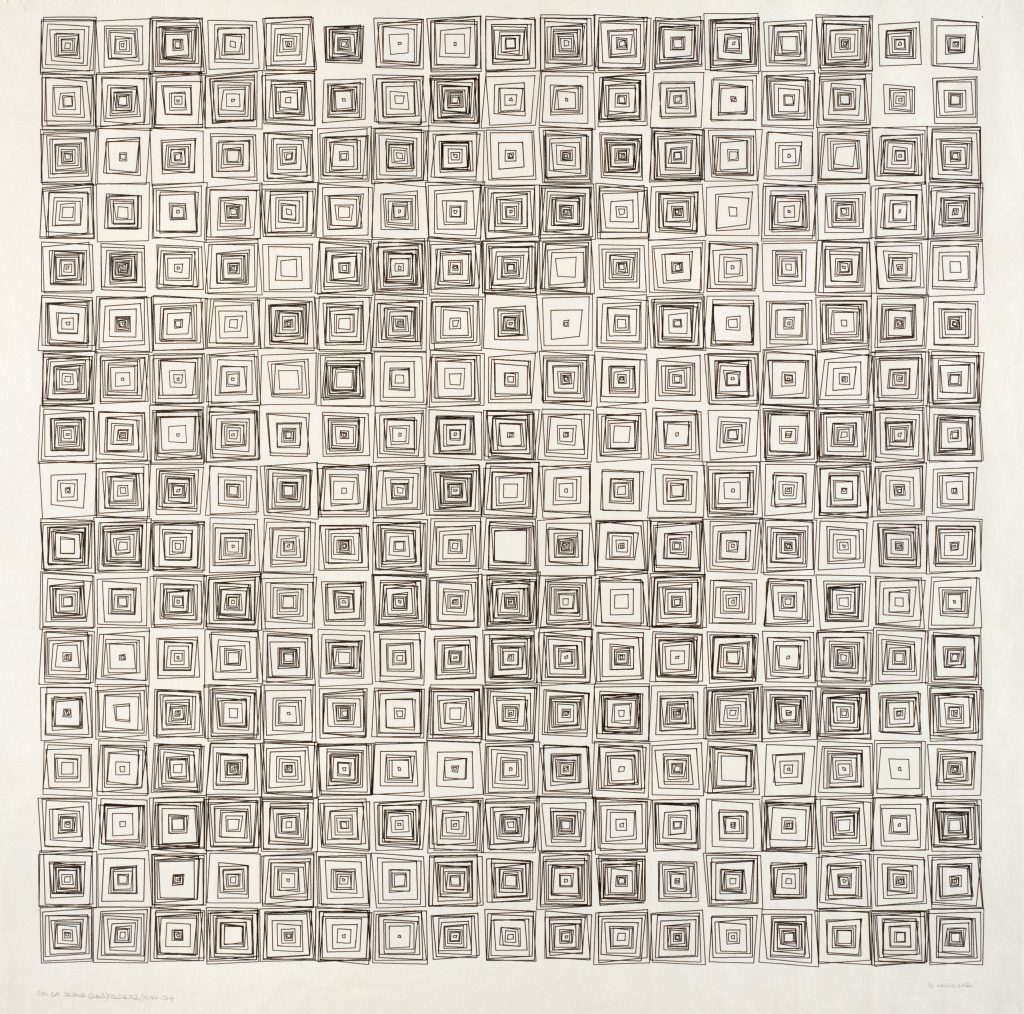
(Above) Vera Molnár, Des(Ordres), 1970.
She wrote: “Thanks to its many possibilities of combination the computer helps to systematically research the visual realm, helps the painter to free herself from cultural ′readymades′ and find combinations in forms never seen before, neither in nature nor at a museum: It helps to create inconceivable images. The computer helps, but it does not ′do′, does not ′design′ or ′invent′ anything. To avoid another misunderstanding I wish to underline something else: The fact that something is new and has not been seen before is no guarantee in any manner for its aesthetic quality. Was the portrayal of a young man with curly hair − Dürer′s self-portrait from around 1500 − new?”
(Watch from 15:10)
Tools & Resources
- p5.js
- Editor.p5js.org and p5 mode
- Processing (Java)
- The Coding Train
Scalable Vector Graphics
- What is an SVG? How can I generate an SVG?
- Demonstration: Re-coding Molnar’s 1974 Des(Ordres)
A line is a dot that went for a walk.
- Shantell Martin follows the line.
- Zach Lieberman’s 2015 Eyeo lecture (7:20 – 18:40)
- CURVES by Masahiko Sato (0:15–6:45; 13:20–19:20). “A line is a miracle that you draw when you throw it.”
Processing code for Des(Ordres) Re-Code
Here’s an SVG version of Molnar’s Des(Ordres) project (1970), and the Processing code that produced it.
import processing.svg.*;

void setup() {
  size(768, 768); // 8x8"
  noLoop(); // Just execute once!
}

void draw() {
  background(255);
  beginRecord(SVG, "desorders-1970-molnar.svg");

  stroke(0);
  noFill(); // Don't create duplicate shapes!

  int nCells = 17;
  rectMode(CENTER);
  for (int row =0; row<nCells; row++) {
    for (int col =0; col<nCells; col++) {
      float rw = (width)/ (float)(nCells+1);
      float rh = rw;
      float rx = rw + map(col, 0, nCells, 0, width-rw);
      float ry = rh + map(row, 0, nCells, 0, height-rh);

      float deviation = 4;
      for (int i=1; i<=10; i++) {
        float frac = map(i, 0, 10, 0, 1);
        if (random(1.0) < 0.6) {

          float x1 = rx - rw*frac/2 + frac*deviation*random(-1,1);
          float y1 = ry - rh*frac/2 + frac*deviation*random(-1,1);
          float x2 = rx + rw*frac/2 + frac*deviation*random(-1,1);
          float y2 = ry - rh*frac/2 + frac*deviation*random(-1,1);
          float x3 = rx + rw*frac/2 + frac*deviation*random(-1,1);
          float y3 = ry + rh*frac/2 + frac*deviation*random(-1,1);
          float x4 = rx - rw*frac/2 + frac*deviation*random(-1,1);
          float y4 = ry + rh*frac/2 + frac*deviation*random(-1,1);

          quad(x1,y1, x2, y2, x3,y3, x4, y4);
        }
      }
    }
  }

  endRecord();
}
