For Next Wednesday, September 15th, this set of prompts has three parts: some skimming, reading, and exercises.
1. Skimming: Other’s Practices
Briefly skim these four articles to learn about how various creators think about and describe their processes of working with code and plotters. These articles are essentially introductory technical walk-throughs, with “tips” and suggestions; you will notice considerable diversity in the artists’ approaches.
- Skim “9 Tips to Execute Generative Art with a Plotter” by Tyler Hobbs
- Skim “300 Days with Plotters” by Licia He
- Skim “Pen Plotter Art & Algorithms,” Part 1 and Part 2 by Matt Deslauriers
- Skim “Pen Plotter Programming: the Basics” by Michael Fogleman
N0w,
- Create a blog post on this site. Categorize your post, 03-PlotterSkimming, and title it Nickname-PlotterSkimming.
- Briefly report on something from one of the above articles that you found interesting and/or helpful. Two sentences should suffice: a description of what you learned, and why you found it interesting or helpful.
2. Reading: Computational Drawing
Carl Lostritto is a professor of Architecture at RISD whose creative practice centers on the use of pen plotters. Read “Chapter 1: Definitions” from his book, Computational Drawing, from the PDF linked here: lostritto_chapter1.pdf. Now,
- Create a blog post on this site. Categorize it 03-LostrittoReading and title it Nickname-LostrittoReading.
- Write 100-150 words of reflection (about a paragraph) on something that struck you from this reading.
3. Line Exercises
The purpose of this set of exercises is to ensure that you have a foundation of basic skills in data management and computational geometry. In your preferred programming environment, please do the following eight exercises. Note that two of them (items G and H) require you to export an SVG. Now:
- Create a blog post on this site. Categorize it 03-LineExercises and title it Nickname-LineExercises.
- Include screenshots of each of your exercises. For the two exercises that request it (G and H), please also include/embed an SVG.
- Embed or link your code.
A. Dashed Line
Write a program that generates a dashed line between two points. (You may not use a “ready-made” dashed line, if it exists in your toolkit.) The dashes that comprise your line should always have a fixed length, such as 10 pixels, so that longer lines require more dashes.
- Hint: You might find the map() and lerp() functions in Processing/p5 to be helpful.
- Extra challenge: can you make a dashed curve? The curvePoint() function could be helpful.
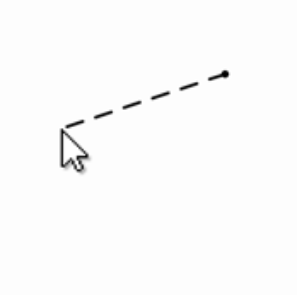 B. Living Line
Create an interaction that stores the past 100 mouse positions, and displays them as a polyline. (The oldest points should disappear as new ones are added.) Please write code to store the mouse data in three different ways: in two 1D arrays (one for X, one for Y); in one 2D array; and in one 1D array of Objects (such as PVectors).
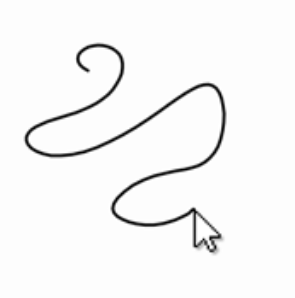
C. Spicy Line
Create a polyline using the past 100 mouse positions, as above. Spice up your polyline by progressively adding some randomness to each point. Over time, the line should become increasingly chaotic. Here’s a hint: p[i].x += random(-1,1);
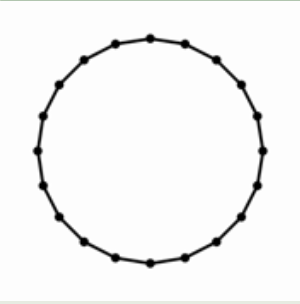
D. One Circle, Two Ways
Plot a circle (from scratch) at least two different ways. For example, you could use the trigonometric functions sin() and cos() to plot a series of points; approximate a circle with four Bézier curves; use the square root relationship [e.g. y = sqrt(r²-x²)….]; or construct a circle with “turtle graphics,” using a series of alternating forward steps and small rotations. You may not use a readymade ellipse(), circle(), or arc() command.
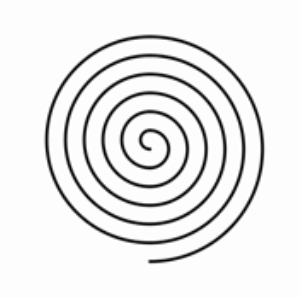
E. Spiral
Write a program that draws a spiral. Before you begin, research different types of spirals (for example at Mathworld), such as Archimedes’s spiral (the radius of which grows arithmetically) and the logarithmic or equiangular spiral (whose radius grows geometrically). Consider different implementations, such as explicitly plotting your spiral using polar equations, implicitly rendering it by summing small differences (e.g., go forward, turn slightly, repeat), or approximating it piecewise with circular arcs. It may be possible to accomplish this project by modifying one of your circles, from above.
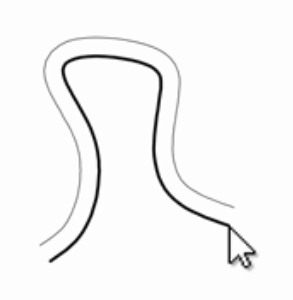
F. Parallel Polyline (Offset Curve)
Write a program that stores cursor points while a user draws. Connect these points with a polyline (shown in black, below). Use geometry to calculate another polyline, which is offset everywhere from the user’s drawing by a distance of 50 pixels. (How does your code manage the condition in which the user draws a sharp concave angle?)
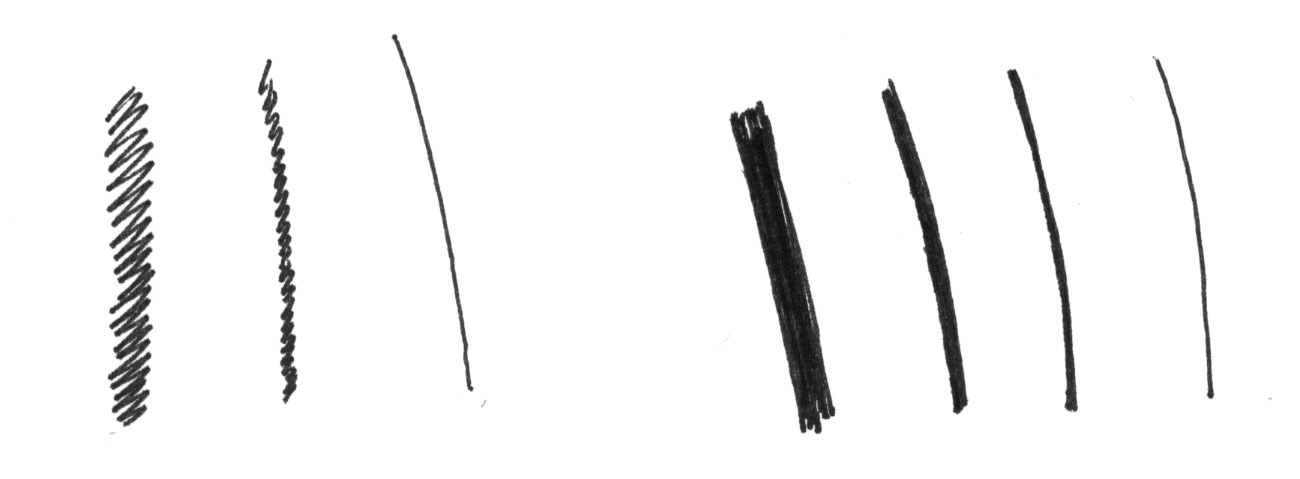
G. Lines of Different Weights
Using your hand, paper, and a pen with a uniform (non-chiseled) nib, draw some lines with different weights. Explore how you did this. Now, create a program that produces lines of different weights. Your program should generate SVGs of those lines, such that the lines will appear to have different weights, when plotted using a pen with a fixed width nib, by an AxiDraw plotter. Note: There’s no one right way to do this, but you will emphatically not be helped by trying to use the Processing/p5 strokeWeight() command! Here are a few (non-exhaustive) suggestions for how you could create lines of different weights:
- Draw a dense zig-zag
- Draw slightly-offset parallel lines that are closely spaced
- Draw a line very slowly or very quickly, with a pen that bleeds ink
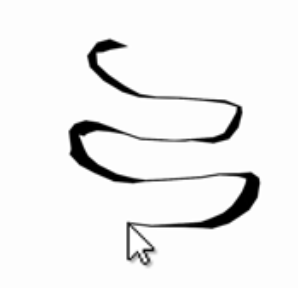
H. Calligraphic Polyline
Create a sketch that stores the past 100 mouse positions. Connect these with a polyline of sorts—but make the apparent thickness (weight) of this polyline inversely proportional to the distance between each pair of recorded cursor points, so that faster movements produce thinner regions of the polyline. Generate an SVG suitable for plotting with an AxiDraw on letter-size paper.
Some helpful Processing (Java) template code:
// Processing (Java) program
// When the user clicks, creates a
// random squiggle and exports an SVG.

import processing.svg.*;
void setup() {
  size(800, 800);
}

void draw() {
  background(250);
  int now = millis();
  randomSeed(now);
  beginRecord(SVG, "foo_" + now + ".svg");
  strokeWeight(3);
  noFill();

  beginShape();
  for (int i=0; i<12; i++) {
    float px = width * random(0.1, 0.9);
    float py = height * random(0.1, 0.9);
    curveVertex(px, py);
  }
  endShape();
  endRecord();
  noLoop();
}

void mousePressed() {
  loop();
}
Some helpful p5.js template code:
// Tester template for interactive SVG export.
// Uses https://github.com/zenozeng/p5.js-svg to export SVG.
function setup() {
  createCanvas(600, 600, SVG);
}

function draw() {
  clear();
  noFill();
  stroke(0);
  strokeWeight(2);

  beginShape();
  for (var i = 0; i < 25; i++) {
    var px = random(0, width);
    var py = random(0, height);
    vertex(px, py);
  }
  endShape();
  noLoop();
}

function keyPressed() {
  var now = nf(hour(),2) + nf(minute(),2) + nf(second(),2);
  saveSVG("random_lines_" + now + ".svg");
}

function mousePressed() {
  loop();
}
—