Final Project – James Katungyi

james-finalproject

//James Katungyi
//Section A 0900
//jkatungy@andrew.cmu.edu
//Project

/* Title: Annual average temperature of a location = Title text showing 
 - location
 - climate  type
 - hour - interactive; to be changed by user. Make a function that returns value for the hour. Hour value changes with slider (make a simple slider)
 ========
 Background: gradient color for canvas pixels from red to blue
 Comfortable band: import data points from excel file;
 connect the data points with red/blue line for upper/lower limit.
 for each month.
 ========
 Temperature bars: low alpha value to show background color
 Height of bars linked to excel data points imported into an array. Height changes with hour value
 Make each bar an object with function to change height 
 ========
 Locate labels outside the colored part of the canvas; left of canvas, above canvas and below canvas???
*/

//var allMonths = [JanTemp, FebTemp, MarTemp, AprTemp, MayTemp, JunTemp, JulTemp, AugTemp, SepTemp, OctTemp, NovTemp, DecTemp];
var Khartoum;
var KhartoumComfortAverages;
var Miami;
var MiamiComfortAverages;
var Pittsburgh;
var PittsburghComfortAverages;
var annualTempAverages = [];//has 12 strings of 24 hourly temperatures each
var comfortTempLimits = [];//has 2 strings of 12 temperatures each
var comfortLimitColors = [];//has two colors - red for upper and blue for lower limit
var counter = 0;//initialize counter at 0;
var myTime = 0;
var myTemp;
var cities = [];
var csvAvTempData = [];
var csvComfLimitData = [];
var cityIndex = 0;

function preload(){
    //load csv file
    Pittsburgh = loadStrings("https://courses.ideate.cmu.edu/15-104/f2016/wp-content/uploads/2016/12/PittsburghAverageTemperatures.csv");
    PittsburghComfortAverages = loadStrings("https://courses.ideate.cmu.edu/15-104/f2016/wp-content/uploads/2016/12/PittsburghComfortLimits.csv");
    Miami = loadStrings("https://courses.ideate.cmu.edu/15-104/f2016/wp-content/uploads/2016/12/MiamiAverageTemperatures.csv");
    MiamiComfortAverages = loadStrings("https://courses.ideate.cmu.edu/15-104/f2016/wp-content/uploads/2016/12/MiamiComfortLimits.csv");
    Khartoum = loadStrings("https://courses.ideate.cmu.edu/15-104/f2016/wp-content/uploads/2016/12/KhartoumAverageTemperatures.csv");
    KhartoumComfortAverages = loadStrings("https://courses.ideate.cmu.edu/15-104/f2016/wp-content/uploads/2016/12/KhartoumComfortLimits.csv");
}

//+++++ canvas & background color ++++++
function setup(){
    createCanvas(700 * 0.8, 400);//scale canvas to fit wordpress
    pixelDensity(1);//regular density
    loadPixels();
    var lowerLimitColor = color(0, 0, 255);
    var upperLimitColor = color(255, 0, 0);
    comfortLimitColors.push(lowerLimitColor);
    comfortLimitColors.push(upperLimitColor);
    //csvAvTempData is an array with average temperatures for 3 cities
    csvAvTempData.push(Khartoum);
    csvAvTempData.push(Miami);
    csvAvTempData.push(Pittsburgh);
    //println(csvAvTempData);
    csvComfLimitData.push(KhartoumComfortAverages);
    csvComfLimitData.push(MiamiComfortAverages);
    csvComfLimitData.push(PittsburghComfortAverages);
    
    //titles array
    cities.push("KHARTOUM");
    cities.push("MIAMI");
    cities.push("PITTSBURGH");
}
function draw(){
    scale(0.8, 1);//scale canvas to fit wordpress
    //change canvas color from pixel array
    for (var y = 50; y < height - 50; y++){//exclude 100 pixels above and below canvas for labels
        for (var x = 80; x <  width; x++){//exclude 100 pixels to left of canvas for labels
            var index = (x + y * width) * 4;//locate each pixel
            pixels[index + 0] = map(y, 0, height, 255, 0);//decrease red down the canvas
            pixels[index + 1] = 0;
            pixels[index + 2] = map(y, 0, height, 0, 255);//increase blue down the canvas
            pixels[index + 3] = 255;
        }
    }
    updatePixels();
    //+++++graph labels++++++
    //graph title
    stroke(0);
    fill(0);
    strokeWeight(1);
    textSize(18);
    textAlign(RIGHT);
    text(("AVERAGE HOURLY TEMPERATURES IN " + cities[cityIndex]), 400, 0, 300, 50);
    textSize(10);
    strokeWeight(0.5);
    textAlign(LEFT, TOP);
    text("click to change time", 100, 0);
    //legend comfort temperature limit
    for (var i = 0; i < comfortLimitColors.length; i++) {
        noFill();
        stroke(comfortLimitColors[i]);
        line(100 + (i * 200), 390, 150 + (i * 200), 390);
        ellipse(100 + (i * 200), 390, 8, 8);
        ellipse(150 + (i * 200), 390, 8, 8);
    }
    stroke(0);
    strokeWeight(1);
    textAlign(LEFT, CENTER);
    text(("Lower Comfort Limit"), 160, 390);
    text(("Upper Comfort Limit"), 360, 390);
    //time check at top of the graph
    
    fill(0);
    textAlign(LEFT);
    textSize(14);
    var timeCheck = ("TIME: " + nf(myTime, 2, 0) + ":" + "00");
    text(timeCheck, 100, 30);
    //y scale from 0 to 120 degrees fahrenheight
    for (var t = 0; t < 121; t+=20){
        var tempScale = map(t, 0, 120, 350, 50);
        textAlign(RIGHT);
        stroke(0);
        text(t, 80, tempScale);
        //y scale grid lines
        stroke(255, 100);//lower alpha value for the grid lines
        //strokeWeight(0.5);
        line(100, tempScale, 700, tempScale);
    }
    //x scale Jan to Dec at bottom of graph
    var monthNames = ["Jan", "Feb", "Mar", "Apr", "May", "Jun", "Jul", "Aug", "Sep", "Oct", "Nov", "Dec"];
    for (var i = 0; i < monthNames.length; i++){
        var xPosText = 125 + i * 50;
        stroke(0);
        textAlign(CENTER, BOTTOM);
        text(monthNames[i], xPosText, 375);
    }
    //call function to parse csv data into monthly arrays
    csvDataToArray(csvAvTempData[cityIndex], annualTempAverages);
    csvDataToArray(csvComfLimitData[cityIndex], comfortTempLimits);

    //bar graphs: loop through the 12 months and plot the temperature of each month
    //depending on the hour.
    var LimitsForEachCity = comfortTempLimits;
    // var TempAveragesForEachCity = cityAverageTemp[cityIndex];

    var lowerLimitValues = LimitsForEachCity[0];
    var upperLimitValues = LimitsForEachCity[1];
    for (var i = 0; i < annualTempAverages.length; i++){
        var monthlyMin = lowerLimitValues[i];
        var monthlyMax = upperLimitValues[i];
        drawTemperatureBar(annualTempAverages[i], i, monthlyMin, monthlyMax);
    }

    //loop through the 2 sets of limits and plot the max and minimum comfort temperature
    //for each month
    
    for (var i = 0; i < LimitsForEachCity.length; i++){
        stroke(comfortLimitColors[i]);
        TemperatureBoundary(LimitsForEachCity[i]);
    }
}

/*increase the time whenever mouse clicks; increase upto 23;
may integrate a sliding scale to determine the time*/
function mousePressed(){
    counter++;
    myTime = counter%24;//myTime is an integer between 0 and 23
}

//parse csv data into strings and create 12 arrays with 24 data points each
function csvDataToArray(csvFile, myArray){
    for (var i = 0; i < csvFile.length; i++){
        myArray[i] = csvFile[i].split(",");
    }
}
/*drawTemperatureBar is a function that draws one bar for all temperatures of a given month. 
The height of the monthly bar depends on the time of day*/
function drawTemperatureBar(monthlyvalues, monthIndex, MinTemp, MaxTemp){
    stroke(255);
    strokeWeight(2);
    var BarWidth = 50;//bar width distributed evenly across width
    var xPos = 100 + (monthIndex * 50);//x position of bar is determined by month number
    myTemp = monthlyvalues[myTime];//use myTime value as index for Temperature values array
    var barHeight = map(myTemp, 0, 120, 0, 300);//scale temperature value to screen size
    var yPos = height - 50 - barHeight;

    
    //if monthly temperature exceeds comfort temperature limits, highlight the bar with red tint
    //if monthly temperature falls below comfort temperature limit, highlight the bar with blue tint
    if (float(myTemp) > float(MaxTemp)){
        fill(255, 0, 0, 100);
    } else
    if (float(myTemp) < float(MinTemp)){
        fill(0, 0, 255, 100);
    } else {
        fill(255, 50);
    }
    rect(xPos, yPos, BarWidth, barHeight);
    //println("monthIndex" monthIndex myTemp 100 MaxTemp 84 MinTemp 74);
}

/*Comfortable temperature limits differ from one month to the other;
draw upper boundary and lower boundary */
function TemperatureBoundary(LimitValues){
    for (var i = 0; i < LimitValues.length; i++){
        strokeWeight(2);
        noFill();
        var xPos = 125 + (i * 50);//scale x values to fit screen
        var xPos1 = 125 + ((i + 1) * 50);
        var yPos = map(LimitValues[i], 0, 120, 350, 50);//scale temperature value to screen size
        var yPos1 = map(LimitValues[i + 1], 0, 120, 350, 50);
        ellipse(xPos, yPos, 10, 10);
        line(xPos, yPos, xPos1, yPos1);
    }
}
//press keys to change from one city to another
function keyTyped(){
    // if (key == k){
    //     cityIndex = 0;
    //} else 
    if (key === 'm'){
        cityIndex = 1;
    } else if (key === 'p'){
        cityIndex = 2;
    } else if (key === 'k'){
        cityIndex = 0;
    }
}

Introduction

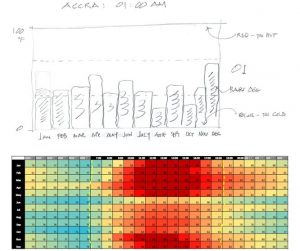
For the final project, I explored weather data visualization for three cities in different climates (Pittsburgh, Miami and Khartoum). Data visualization can make technical information intelligible to the non-technical. This can be useful for convincing building occupants to use less energy. If building occupants can be shown how to use less energy without compromising comfort, they can be instrumental in reducing energy consumption.

khartoum0600hrsmiami1500hrspittsburgh1100hrs

Description

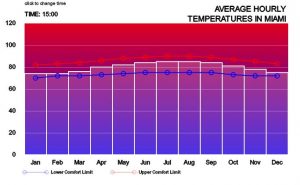
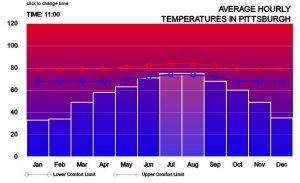
The project consists of an interactive platform that graphs the average hourly temperatures for each month against a blue to red scaled background – blue for cold and red for hot. A comfort band in the middle of the graph represents the narrow range of comfortable temperatures based on the adaptive comfort model (de Dear and Brager, 1998). The upper limit of the comfort band is marked in red while the lower limit is marked in blue. The bars show the outdoor temperature at any given hour for each of the 12 months. When the temperature is below the lower limit, the bar is blue. When it is above the limit, the bar is red. When it is within the limit, the bar is a translucent white. Temperature values were obtained from weather files that are freely available online at https://energyplus.net/weather. The files in epw format were processed in Microsoft Excel to obtain average hourly data which was then saved as csv files. The csv files were then loaded into p5.js. The program runs smoothly in firefox but not in chrome because of the link to the csv files.

Interactivity/Operation

There are two levels of interactivity:

  1. The user, by clicking the mouse, can incrementally advance the hour by 1 from midnight (00:00 hrs) to 23:00 hrs. At each hour, the average temperature is displayed for each month.
  2. The user can also choose one of three cities by pressing the key corresponding to the first letter of the city – ‘m’, ‘p’ or ‘k’.

I hope to enrich it by incorporating humidity and wind speed in the input data. This would better portray human indoor comfort against outdoor weather conditions.

de Dear, R.J., and G.S. Brager, 1998. Towards an adaptive model of thermal comfort and preference. ASHRAE Transactions, Vol 104 (1), pp. 145-167

James Katungyi – Project 12 Proposal

GRAPHICAL REPRESENTATION OF COMFORT AGAINST TEMPERATURE VARIATION ACROSS THE YEAR

How can climate data be packaged to make a visual impact, for example, in determining when to use air conditioning in a building? In this project, I propose to represent temperature variations by the hour for each month of the year for a location. At a glance, a comparison of average temperatures at a given hour of each month will be comparable. This will be an example of climate data representation limited to temperature variations and comfort. Other templates could be made for relative humidity and comfort and so on.

The temperature variations will be set against a background that is calibrated from extreme hot (red) to extreme cold (blue). A horizontal band in the middle of the platform will mark the range of temperatures where comfort is possible.

The coloured image below shows an attempt to project this information by excel in my earlier research work. It is a static image that requires elaborate explanation. I intend for the project to improve of the presentation technique.

I propose to use 12 bar objects with a functions that relate their height to a temperature. I hope to be able to link the temperature data into the file without time consuming retyping – this is one area that I am not yet sure about.

projectsketch


James Katungyi – Looking outwards 12

I chose two projects that make data accessible to the non-technical minded. One, the most interesting, is Nathan Yau’s ‘A day in the life of Americans‘. In it, he uses dots to simulate how each of 1000 Americans occupy themselves within a 24 hour period. The source data is based on 2014 American Time Use Survey, made accessible by ATUS Extract Builder. The project represents each person as a dot whose color is determined by the activity of the moment. Dots of the same color congregate to the same spot on a circular clock-like canvas with activities located around it. Each activity records the percentage of dots at the location. The dots are in constant motion; they become frantic in rush hour then settle into work or sleep depending on the time of day.

nathanyausketch

nathanyaufinal

The second one is Ekene Ijeoma’s ‘The Refuge Project‘. It is an animated world map that shows the country of origin of refuges for each year from 1975 – 2015.  At the earliest, the project was done in 2015. The circular illustrations are scaled to represent the number of refugees. At a glance, one is able to tell where the largest number of refugees came from for a given year. When the mouse is positioned at the circle of origin, the destinations of the refugees are shown by arrows and numbers. A side screen narrates key events contributing to the largest refugee numbers for each year.

ijeomamapinteractivity

ijeoma2015

I admire the two projects because they turn numbers into intriguing representations that are easily apprehended. One of the challenges of our times is how to make meaningful use of the enormous quantities of data that is available. Making the data easily apprehended is an important step in analyzing and using the data.

As to the algorithms, Nathan’s work suggests that each circle is an object that stores properties and functions which change its color and drive its movement across the screen. Even though Ekene’s work is static for each year, it also probably relies on an array of objects with properties and functions. The map at the back is also interactive because it is linked to the circles.

For my project, I wish to make a platform that graphically presents a location’s climate data – one unlike the common weather apps. The two projects inspired this idea which I also hope to use in later work.

Turtle Graphics

james-turtlegraphicscompostion

//James Katungyi
//Section A 0900
//jkatungy@andrew.cmu.edu
//Assignment-Project-11

var timer = 0.01;
var inc = 0.001;
//turtle graphics
function turtleLeft(d) {
    this.angle -= d;
}


function turtleRight(d) {
    this.angle += d;
}


function turtleForward(p) {
    var rad = radians(this.angle);
    var newx = this.x + cos(rad) * p;
    var newy = this.y + sin(rad) * p;
    this.goto(newx, newy);
}


function turtleBack(p) {
    this.forward(-p);
}


function turtlePenDown() {
    this.penIsDown = true;
}


function turtlePenUp() {
    this.penIsDown = false;
}


function turtleGoTo(x, y) {
    if (this.penIsDown) {
      stroke(this.color);
      strokeWeight(this.weight);
      line(this.x, this.y, x, y);
    }
    this.x = x;
    this.y = y;
}


function turtleDistTo(x, y) {
    return sqrt(sq(this.x - x) + sq(this.y - y));
}


function turtleAngleTo(x, y) {
    var absAngle = degrees(atan2(y - this.y, x - this.x));
    var angle = ((absAngle - this.angle) + 360) % 360.0;
    return angle;
}


function turtleTurnToward(x, y, d) {
    var angle = this.angleTo(x, y);
    if (angle < 180) {
        this.angle += d;
    } else {
        this.angle -= d;
    }
}


function turtleSetColor(c) {
    this.color = c;
}


function turtleSetWeight(w) {
    this.weight = w;
}


function turtleFace(angle) {
    this.angle = angle;
}


function makeTurtle(tx, ty) {
    var turtle = {x: tx, y: ty,
                  angle: 0.0, 
                  penIsDown: true,
                  color: color(200),
                  weight: 1,
                  left: turtleLeft, right: turtleRight,
                  forward: turtleForward, back: turtleBack,
                  penDown: turtlePenDown, penUp: turtlePenUp,
                  goto: turtleGoTo, angleto: turtleAngleTo,
                  turnToward: turtleTurnToward,
                  distanceTo: turtleDistTo, angleTo: turtleAngleTo,
                  setColor: turtleSetColor, setWeight: turtleSetWeight,
                  face: turtleFace};
    return turtle;
}
//using turtle graphics to draw cloudy sin curve using perlin noise
function setup(){
    createCanvas(600, 400);
    background(250, 50);
}

function draw(){
    var amplitude = 50 + timer * noise(inc);
    var startVal = 50 + timer * noise(inc);
    var myTurtle = makeTurtle(0, startVal);
    for (var x = 0; x < width; x++){
        //restrict sin curve within the canvas edges
        var angle = map(x, 0, width, 0, TWO_PI);
        //sin curve
        var yLoc = startVal + sin(angle) * amplitude;
        myTurtle.goto(x, yLoc);
    }
    timer++;
    inc++;

    if (frameCount%400 == 0){
        background(250);
    }
}

I wanted to use the turtle to draw a sin curve that gently distorts over time leaving a soft mesh in its wake similar to the image below. I lost control of the turtle stroke and perlin noise, then ran out of time. Will explore more after.

cloudy

JamesKatungyi – Looking outwards 11

Artist: Robert Henke

Title: Deep Web

Date: 2016

In Looking Outwards 4, I looked at music. This is about sound art. Robert Henke’s ‘laser orchestra’ together with Christopher Bauder’s ‘luminous kinetics’ come together in a phenomenal visual, acoustic 3d experience titled ‘The Web‘. The setting is a large hall rigged with motorised spheres and laser systems. The stage is the space above the audience where the multicoloured laser beams trace out the suspended spheres in colourful blasts synchronised to a musical score.

It seems that the laser beams are activated by the music. I would imagine that depending on the musical note or note combination, laser beams of a certain colour are activated in a given direction to a target sphere which illuminates when the beams strike it. The visual effect closely matches the audio. This, in my opinion, is the main artistic computational aspect of the show. The laser beams and sphere illuminations are mechanically driven.

In his bio, Robert Henke’s interests include space, technical objects. computer generated sound and images. Deep Web shows how he successfully synthesises all these in an artistic audio-visual experience.

deepweb1

Project 10 – Generative Landscape – James Katungyi

james-generativelandscape

//James Katungyi
//Section A 0900
//jkatungy@andrew.cmu.edu
//Assignment-Project-10

//2d varying terrain
//draw terrain with ground and trees, sky and sun and moon
//move terrain from left to right - OMITTED THIS STEP
//insert walking man? - OMIT THIS STEP
//when sun sets, sky color is dark blue, moon moves from left to right
//when sun rises, sky color is light blue

var trees = [];
//divide time into two - night and day; different sky color for each
var dayTime;
var timer = 0; //declare a timer variable for day and night variation

function setup() {
    createCanvas(640, 400); 
    // create an initial collection of trees
    for (var i = 0; i < 10; i++){
        var treeX = random(width);
        trees[i] = makeTree(treeX);
    }
    frameRate(10);
}

function draw() {
    var skyColor = color(0, 191, 255);//deep blue sky
    background(skyColor);
    if (dayTime = false){
        skyColor = color(0, 51, 102);//midnight blue
    } else {
    }

    println(dayTime);
    timer++;//increment timer per frame
    
    terrainDisplay();
    dayOrNight();
    updateAndDisplayTrees();
    removeTreesThatHaveSlippedOutOfView();
    addNewTreesWithSomeRandomProbability();
}
//alternate between night and day across the canvas
//cycle twice across the canvas
//first time for day
//second time for night
function dayOrNight(){
    if (timer > 1279){
        timer = 0;
    }
    //daytime
    if ((timer > 0) & (timer < 640)){
        dayTime = true;
        //draw sun
        noStroke();
        fill(253, 184, 19); //yellow orange sun
        //derive y value from circle equation
        //(x-a)2 - (y-b)2 = r2;
        var yTimerLoc = (356 - sqrt(sq(356) - sq(timer - 320)));
        //sun
        ellipse(timer, yTimerLoc, 75, 75);
        // print(yLoc);
    }
    //nightime
    if (timer > 640){
        dayTime = false;
        //draw moon
        noStroke();
        fill(192, 192, 240); //blue moon
        //follow sun path with y from the circle equation
        //(x-a)2 - (y-b)2 = r2;
        //moon
        ellipse(timer, yTimerLoc, 40, 40);
    }
}

function updateAndDisplayTrees(){
    for (var i = 0; i < trees.length; i++){
        trees[i].move();
        trees[i].display();
    }
}

function removeTreesThatHaveSlippedOutOfView(){
    //FROM ASSIGNMENT NOTES - kept for revision purposes
    // If a tree has dropped off the left edge,
    // remove it from the array.  This is quite tricky, but
    // we've seen something like this before with particles.
    // The easy part is scanning the array to find trees
    // to remove. The tricky part is if we remove them
    // immediately, we'll alter the array, and our plan to
    // step through each item in the array might not work.
    //     Our solution is to just copy all the trees
    // we want to keep into a new array.
    var treesToKeep = [];
    for (var i = 0; i < trees.length; i++){
        if (trees[i].x > 0) {
            treesToKeep.push(trees[i]);
        }
    }
    trees = treesToKeep; // remember the surviving trees
}

function addNewTreesWithSomeRandomProbability() {
    // With a very tiny probability, add a new tree to the end.
    var newTreeLikelihood = 0.007; 
    if (random(0,1) < newTreeLikelihood) {
        trees.push(makeTree(width));
    }
}

function treeMove() {
    this.x += this.speed;  
}

function treeDisplay() {
    var treeHeight = 50;
    push();
    translate(this.x, this.y);
    //trunk
    stroke(98, 78, 44);//tree bark color
    strokeWeight(10);
    line(0, treeHeight, 0, -treeHeight);
    //foliage
    noStroke();
    fill(154, 255, 47);//green yellow tree foliage
    ellipseMode(CENTER);
    ellipse(0, -treeHeight, treeHeight * 2, treeHeight * 1.5);
    pop();
}

function makeTree(xTreeLoc) {
    var tree = {x: xTreeLoc,
                y: 300,
                speed: -1,
                move: treeMove,
                display: treeDisplay}
    return tree;
}

//thick strokes in the terrain for depth gradient
function terrainDisplay(){
    strokeWeight(20);
    for (var i = 0; i < 6; i++){
        var g = (158 - (i * 5));
        var yLoc = (height - (20 * i));
        stroke(77, g, 58);
        line(0, yLoc, width, yLoc);
    }
}

I wanted day and night to be part of the landscape. The trees were to be of different height, growing from different locations; the horizon was to be rugged and the foliage was to be more varied. I started out with a big plan, then got bogged down in the details  – the syntax. There are lessons there too, I guess. And perhaps this is not the place for photo-realism.

Looking Outwards 10 – Female Artists

Artist: Karolina Sobecka

Project: Wildlife

Karolina Sobecka’s ‘wildlife’ caught my interest. The project places ‘wildlife’ in the city center thereby uniting two antithetical concepts – cities and wildlife. A tiger projected onto building facades by the sidelights of a moving car, runs alongside the car, picking up speed when the car accelerates, slowing down, stopping and even looking towards the viewer when the car stops. The tiger’s speed is modelled on the wheel rotation of the car which is picked by a sensor. The tiger can be seen panting when the car stops. The project is surreal but brings excitement to the boring monotony of a city night. It seems to me that the tiger is a 3d animation whose movement is then tagged to the sensor on the car wheels through computational algorithms.

Karolina Sobecka is an independent artist.  According to her linkedin webpage, she earned her Bachelor of Fine Arts at the School of Art Institute of Chicago, went on for a Master of Fine Art at California Institute of Arts and a Doctor of Philosophy, DXARTS Digital and Experimental Art at the University of Washington. She is an adjunct professor at Rhode Island School of Design. She is the director of Flightphase, a creative agency in science communication and consultancy that uses art to craft messages on climate, emerging technology and synthetic biology.

wildlife1

James Katungyi – Project 09 – Custom Pixel

james-custompixel

//James Katungyi
//Section A 0900
//jkatungy@andrew.cmu.edu
//Assignment-Project-09

var me;
//declare first point of hatchline 
var xLoc;
var yLoc;
//declare brushtip size
var brushtip;
//preload image
function preload(){
    me = loadImage("http://i.imgur.com/o3DFass.jpg");
}

function setup(){
    createCanvas(400, 400);
    background(135, 206, 250);//sky blue background
    //scale the image to fit canvas width; maintain aspect ratio
    me.loadPixels(); //load image pixels
}
function draw(){
    //image(me, 0, 0);
    var brushLength = random(10, 30);//hatch length
    //second point of hatch line
    var x2Loc = xLoc + brushLength;
    var y2Loc = yLoc + brushLength;
    //locate middle of hatch
    var midXLoc = (xLoc + x2Loc) / 2;
    var midYLoc = (yLoc + y2Loc) / 2;
    //pick image pixel at middle of hatch
    var pickCol = me.get(midXLoc, midYLoc);
    
    //use picked pixel color for hatch
    stroke(pickCol);
    strokeWeight(brushtip);
    //draw hatch
    
    line(xLoc, yLoc, x2Loc, y2Loc);
    line(x2Loc, yLoc, xLoc, y2Loc);
    //touch up the painting with the mouse
    //when mouse is in the canvas, detail image aspects
    if ((mouseX > 0) & (mouseX < width) && 
        (mouseY > 0) && (mouseY < height)){
        xLoc = mouseX; 
        yLoc = mouseY;
        brushtip = 2; //smaller brushtip for fine finishing
    } else {//when mouse is outside canvas draw faster with larger strokes
        xLoc = random(width);
        yLoc = random(height);
        brushtip = 5; //larger brushtip to fill up canvas
    }
    
}

The canvas quickly fills up with color and form except when the artist focuses the drawing pencil on one aspect or other.

me-unfinished

Looking outwards – 09

Artist: Stephen Malinowski

Title: Fantasy-Impromptu by Fredrick Chopin

From Simin Li’s Looking outwards 04.

Malinovsky’s work is beautiful and exciting. It is an example of how using computational capabilities can enrich our experience of music. It also hints at how these capabilities can be art in themselves.

Simin’s assessment of the work is a revelation to me too. Malinovsky’s work reminds Simin of dance and she likens it to choreography. Beautiful music seeks expression and dance is the natural response. When the music can be ‘seen’, the impulse to dance is perhaps even stronger. I can also appreciate how this work makes it easier to teach music.

What struck me, was how the work enables visual experience of sound – in this case, beautiful sound. The work opens up a myriad of vistas – what if we could not only ‘see’ but also touch sound? Would being able to perceive beautiful sounds through our other senses – the eyes and hands (or even smell and taste) enrich our experience of music? On the other hand, could we reciprocate the process by creating music from art? What about making a single piece of art that produces a simultaneous experience of visual, audio and tactile beauty – art that one experience by looking at, listening to and touching?

It would be interesting to integrate a richer colour and image palette into the Malinovsky’s work. Perhaps this could evoke deeper feelings in the visual field alone. There is an unresolved tension between the motion of music and stillness of images, the 2D and the 3D.

James Katungyi – Looking Outwards – 08

Artist: Patricio Gonzalez Vivo
Title: Point Cloud City

Patricio started his professional career as a pyschologist in Brazil. He specialized in what he called ‘expressive art therapy’ – using art as a medium to express a person’s ‘interior landscape’. He then trained as programmer in Argentina.  He now works in New York with Mapzen – a company that develops open source tools to visualize data. He describes his work as using code and light to animate data. He credits ‘shaders’ for the effectiveness of his work.

Patricio combines engineering and art – an difficult mix in my opinion. He combines engineering’s cold, hard data with the artist’s organic expressiveness. He makes data aesthetically appealing by bridging ‘science’ and ‘art’.  Among his most interesting projects is Point Cloud City (shown above) where he takes depth data from Google Street View images and recreates an animation of the scenes in point clouds with light.

His command of the tools of his work and the mesmerizing results make his presentations captivating. The lessons I took are not so much how to present my work as what possibilities there are in using code to visualize data.

He talks about his latest project on how to visualize the effects of sea level rises in San Francisco and New York at Eyeo 2016 ‘What are the chances?’