![[OLD – FALL 2016] 15-104 • COMPUTING for CREATIVE PRACTICE](https://courses.ideate.cmu.edu/15-104/f2016/wp-content/uploads/2020/08/stop-banner.png)
//Victor Tavarez
//Section D
//vtavarez@andrew.cmu.edu
//Project-07-CompositionWithCurves
function setup() {
createCanvas(500,500);
}
function draw() {
background(60);
push();
translate(width/2, height/2);
plotMiceProblem();
pop()
}
function plotMiceProblem(){
var nPoints = map(mouseY, 0, height, 0 ,1000);
var x;
var y;
var n = map(mouseX, 0, width,0,10); // will be used to draw more itterations
beginShape();
//nPoint influenced by y value to give "drawing" effect
for (var i=0; i < nPoints; i++){
var t = map(i,0,nPoints,0,TWO_PI*n);
noFill();
var clrR = map(mouseX, 0, width,100,255);
var clrG = map(mouseX, 0, width,200,230);
var clrB = map(mouseX,0,width,230,255);
strokeWeight(4);
stroke(clrR,clrG,clrB); //
//equations as listed on mathworld.wolfram.com/ButterflyCurve.html
x = Math.sin(t) * (Math.pow(Math.E,Math.cos(t))
- 2*Math.cos(4*t)
+ Math.pow(Math.sin(t/12),5));
y = Math.cos(t) * (Math.pow(Math.E,Math.cos(t))
- 2*Math.cos(4*t)
+ Math.pow(Math.sin(t/12),5));
vertex(x*70,y*50); //wider than tall
}
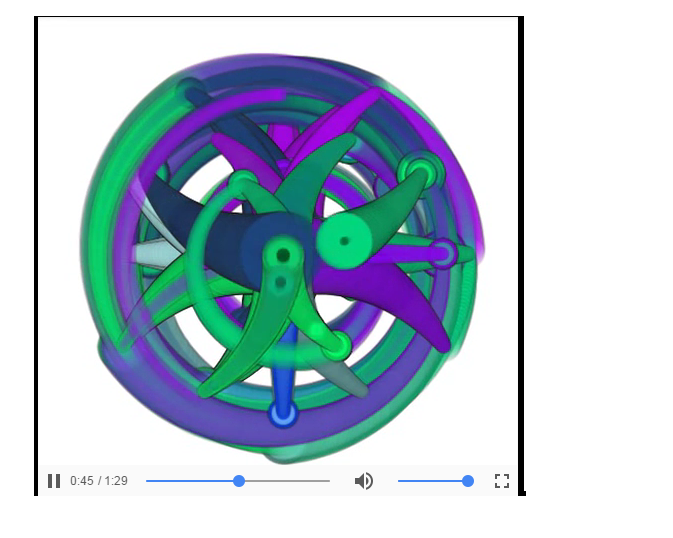
endShape(CLOSE);
}For this project, I decided to represent the drawing of a Butterfly curve. To do so, I decided to link the draw function to a the mouseX value to give it the appearance of it ‘drawing’. The most difficult part of this was writing down the x and y equations because it involved Math operators I was unfamiliar with. Once I got the curve to draw, I implemented the changes that the mousex and mouseY would do. MouseX draws and colors the curve. MouseY also draws but smoothens the curve.