![[OLD FALL 2018] 15-104 • Introduction to Computing for Creative Practice](https://courses.ideate.cmu.edu/15-104/f2018/wp-content/uploads/2020/08/stop-banner.png)
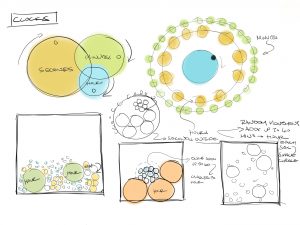
sketch
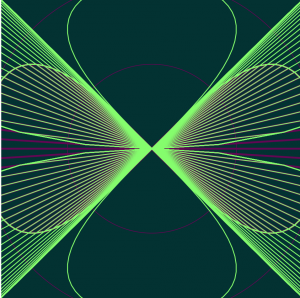
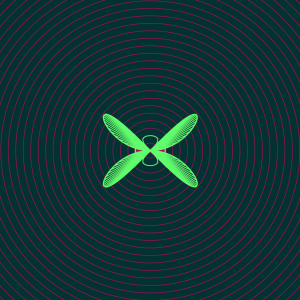
This project was quite difficult for me to execute. With the link provided I was able to look at different algebraic functions and graphs; however, once I looked at the mathematical
functions themselves I got really confused. Overall, I am not really proud of this project and hope to be able to incorporate mathematical functions into my code in the future.
/*Elena Deng
Section E
  edeng1@andrew.cmu.edu
  Project-07
}
*/

var nPoints=100

function setup() {
    createCanvas(480, 480);
}

function draw() {
    background(0,50,50);
    var mX = mouseX; //establishes mouseX and mouseY function
    var mY = mouseY;
    noFill();
    strokeWeight(1);


//mouse position is constrained to the canvas size
    mouseX=constrain(mX, 0, width);
    mouseY=constrain(mY, 0, height);

    mPos=dist(mX,mY,width/2,height/2);
    a= map(mPos,0,width,0,480);

    eight(); //draws first eight loop
    circleOne(); //draws ellipse

//draws second eight loop
    push();
    rotate(HALF_PI);
      for(var i=0;i<nPoints;i++){
        var r = map(mouseX,0,width,100,255);
        var g = map(mouseX,0,width,100,200);
        var b = map(mouseY,0,height,100,100);
        stroke(r/2,g*3,b)
        // stroke(r,g,b)
          strokeWeight(1.5);

          var t = map(i,0,nPoints,0,TWO_PI);

          x=a*sin(t);
          y=a*sin(t)*cos(t);

          rotate(PI); //rotates figure
          x2=a*sin(t*2)*PI;
          y2=a*sin(t*2)*cos(t)*PI;

        vertex(x2,y2)

      endShape(CLOSE);
    pop();
    }
}
function eight(){ //draws first eight loop
  var r = map(mouseX,0,width,255,100); //changes color based on where mouseX and Y is
  var g = map(mouseX,0,width/10,200,100);
  var b = map(mouseY,0,height,80,100);
  stroke(r,g,b)

    strokeWeight(3);
    // stroke(r,g,b)
    var x;
    var y;

    beginShape();

      translate(width/2,height/2);

      for(var i=0;i<nPoints;i++){
        var t = map(i,0,nPoints,0,TWO_PI);

        x=a*sin(t);
        y=a*sin(t)*cos(t);
      vertex(x,y);

    endShape(CLOSE);
}
}
function circleOne(){ //draws the circle
  strokeWeight(1)
  var r = map(mouseX,0,width/4,100,300);
  var g = map(mouseX,0,width/4,180,200);
  var b = map(mouseY,0,height*6,100,200);
  for(var i=0;i<nPoints;i++){ //draws the loop of ellipse
    ellipse(0,0,a*i,a*i)
  }
}