Austin Treu – Project 07

atreu-proj-07

/*Austin Treu
    atreu@andrew.cmu.edu
    Section B
    Project 07*/

var cX = 0, cY = 0, nPoints = 100,
    t = 0, up = 0, bot = 0, a = 0, b = 0;

function setup() {
    createCanvas(480, 480);
    frameRate(10);
}

function draw() {
    //fade the background
    background(255,255,0,20);

    //actual shape
    //shape is based upon the devil's curve
    //http://mathworld.wolfram.com/DevilsCurve.html
    fill('orange');
    push();
    //center the shape
    translate(width/2, height/2);
    //scale down to half size
    scale(0.5);

    //create the shape
    beginShape();
    //utilize mouse values for a and b
    a = mouseX;
    b = mouseY;
    for (var i = 0; i < nPoints; i++) {
        //map t around a full circle
        t = map(i, 0, nPoints, 0, TWO_PI);
        //calculate points
        up = pow(a,2)*pow(sin(t),2)-pow(b,2)*pow(cos(t),2);
        bot = pow(sin(t),2) - pow(cos(t),2);
        cX = cos(t)*(sqrt(up/bot));
        cY = sin(t)*(sqrt(up/bot));
        vertex(cX, cY);
    }
    endShape(CLOSE);
    pop();

    //accidental spiky thing
    stroke('red');
    push();
    //center the shape
    translate(width/2, height/2);
    //increase size
    scale(25);

    //create the shape
    beginShape();
    //utilize mouse values for a and b
    a = mouseX;
    b = mouseY;
    for (var i = 0; i < nPoints; i++) {
        //map t around a full circle
        t = map(i, 0, nPoints, 0, TWO_PI);
        //calculate points
        up = pow(a,2)*pow(sin(t),2)-pow(b,2)*pow(cos(t),2);
        bot = pow(sin(t),2) - pow(cos(t),2);
        //an incorrect parenthesis can change EVERYTHING!!
        cX = cos(t*(sqrt(up/bot)));
        cY = sin(t*(sqrt(up/bot)));
        vertex(cX, cY);
    }
    endShape(CLOSE);
    pop();
}

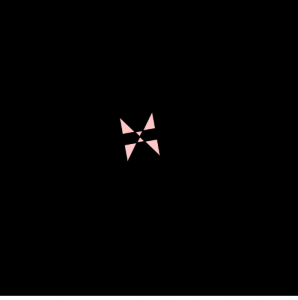
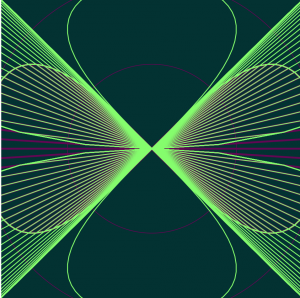
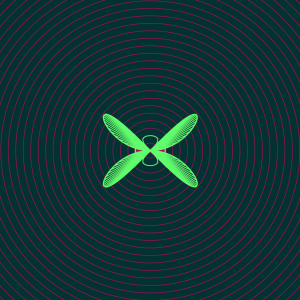
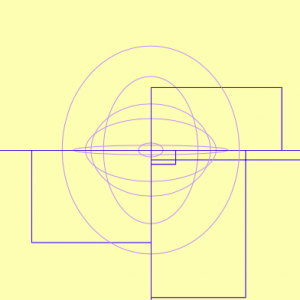
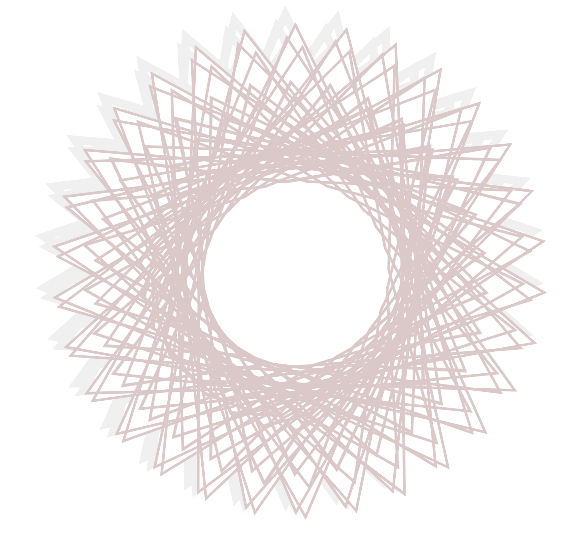
The devil’s curve is what I based this project on. I struggled through this project at the beginning, dealing with a variety of issues that prevented the program from functioning correctly. This was mainly due to two parentheses that were out of place in my math.

costsqrt((a^2sin^2t-b^2cos^2t)/(sin^2t-cos^2t))

I mistakenly read this as cosine of the quantity of t times the square root as opposed to cosine of t times the quantity of the square root. I did the same for both x and y values. This created the red ‘starburst’ that appears in the middle of the drawing. Once I corrected this, I made a shape correctly based upon the devil’s curve but decided to leave the starburst, as it adds some interesting randomness to the image. Believe it or not, both of the things you see on screen were created with the same equation, only differing by two parentheses and scale.

Lan Wei-Project -07-Curves

my-sketch.js

//Lan Wei
//Section D
//lanw@andrew.cmu.edu
//Project-07

function setup() {
    createCanvas(450, 450);
    strokeWeight(2);
    noFill();
}

//http://mathworld.wolfram.com/LogarithmicSpiral.html
var nPoints = 1000;
function draw() {
    background(0);
    push();
    var red = map(mouseX, 0, width, 255, 0);
    var green = map(mouseX, 0, width, 20, 150);
    var blue = map(mouseX, 0, width, 0, 150)
    var col = color(red, green, blue); //change the color
    stroke(col);
    translate(mouseX, mouseY); //draw  with the mouse
    logarithmicSpiral();
    pop();
    push();//another logarithmicSpiral
    var red = map(mouseX, 0, width, 0, 200);
    var green = map(mouseX, 0, width, 100, 50);
    var blue = map(mouseY, 0, width, 0, 150)
    var col = color(red, green, blue); //change the color
    stroke(col);
    translate(width - mouseX, height - mouseY); //draw  with the mouse
    logarithmicSpiral();
    pop();
    stroke(255);
}

function logarithmicSpiral(){
    var a = 0.1;
    var b = 0.1;
    beginShape();
    for (var i = 0; i < nPoints; i++) {
        var t = map(i, 0, nPoints, - 16 * PI, 8 * PI);
        var x = 1000 * a * cos(t) * pow(Math.E, b * t);
        var y = 1000 * a * sin(t) * pow(Math.E, b * t);
        vertex(x, y);
        rotate(atan(mouseY/mouseX)); //rotate with the tangent of the mouse
    }
    endShape();
}

In the project I try to create rotating spirals that change angles and color with mouse movement. I struggled with it at first, having problems figuring out the relationships between the parameters. But finally it works.

Xiaoying Meng – Project 07 Curves

sketch

//Xiaoying Meng
//xiaoyinm@andrew.cmu.edu
//Project 7
function setup(){
    createCanvas(480,480);
    frameRate(10);
}

function draw(){
    background(220);
//top curve
    push();
    translate(width/3,height/3);
    rotate(PI - mouseY/40);
    drawCurve();
    pop();
//middle curve
    push();
    translate(width/2,height/2);
    rotate(PI + mouseY/40);
    drawCurve2();
    pop();
//bottom curve
    push();
    translate(width- width/3, height- height/3);
    rotate(PI - mouseY/40);
    drawCurve3();
    pop();

   
}

//regular Crv
function drawCurve(){
    var nPoints = 200;
    var a = (mouseX-100)/3*2;
    var b = (mouseY-100)/3*2;
    fill(0);
    noStroke();
    beginShape();
    for (var i=0; i < nPoints; i++ ){
        var angle = map ( i, 0, mouseX, 0, 2*PI);
        var x = a* (1/cos(angle));
        var y = b * tan(angle);
        vertex(x,y);
    }
    endShape();
}

//wiggly Crv
function drawCurve2(){
    var nPoints = 200;
    var a = (mouseX-100)/3*2;
    var b = (mouseY-100)/3*2;
    fill(255);
    noStroke();
    beginShape();
    for (var i=0; i < nPoints; i++ ){
        var angle = map ( i, 0, mouseX, 0, 2*PI);
        var x = a* (1/cos(angle));
        var y = b * tan(angle);
        vertex(x + random(-5,5),y + random(-5,5));
    }
    endShape();
}
//dotted Crv
function drawCurve3(){
    var nPoints = 200;
    var a = (mouseX-100)/3*2;
    var b = (mouseY-100)/3*2;
    fill(150);
    noStroke();
    beginShape();
    for (var i=0; i < nPoints; i++ ){
        var angle = map ( i, 0, mouseX, 0, 2*PI);
        var x = a* (1/cos(angle));
        var y = b * tan(angle);
        ellipse(x, y, 10, 10);
    }
    endShape();
}


I chose hyperbola curves. I created three different type of representation of the curves as surfaces and lines. By rotating them to different directions, interesting abstract composition start to occur.

Robert Oh- Project 07 – Curves

curves

//Robert Oh
//Section C
//rhoh@andrew.cmu.edu
//Project-07-Curves

//assigning variables
var nPoints = 100;
var angle1 = 0;
var adj1 = 10;
var angle2 = 0;
var adj2 = 0;
var angle3 = 0;
var adj3 = 0;

function setup() {
    createCanvas(400, 400);
    frameRate(60);
}

function draw() {
    background(0);
    
    //drawing the white circle
    ellipse(mouseX, mouseY, 170, 170);

    //drawing the red Quadrifolium 
    push();
    fill(255, 0, 0);
    translate(mouseX, mouseY + 45);
    rotate(radians(angle1));
    drawQuadrifolium();
    angle1 = (angle1 + adj1) % 360;
    pop();

    //drawing the green Quadrifolium
    push();
    fill(0, 255, 0);
    translate(mouseX + 39, mouseY - 20);
    rotate(radians(angle2));
    drawQuadrifolium();
    angle2 = (angle2 + adj2) % 360;
    pop();

    //drawing the blue Quadrifolium
    push();
    fill(0, 0, 255);
    translate(mouseX - 39, mouseY - 20);
    rotate(radians(angle3));
    drawQuadrifolium();
    angle3 = (angle3 + adj3) % 360;
    pop();

    //adjusting speed of rotation for only blue and green Quadrifoliums
    adj2 = (15 * (mouseX / width)) + (15 * (mouseY / height));
    adj3 = (15 * (width - mouseX) / width) + (15 * (width - mouseY) / height);
}

//formula taken from: http://mathworld.wolfram.com/Quadrifolium.html
function drawQuadrifolium() {
    var a = 40;
    
    beginShape();
    for (var i = 0; i < nPoints; i++) {
        var t = map(i, 0, nPoints, 0, TWO_PI);
        r = a * sin(2 * t);
        x = r * cos(t);
        y = r * sin(t);
        vertex(x, y);
    }
    endShape(CLOSE);
    
}

When I first started this assignment, I was looking around for inspiration. One morning, when I started shaving with my electric razor, I realized that my blades were in the shape similar to that of a quadrifolium. Thus, I created the three quadrifoliums in the same shape as my razor. I adjusted the speed of the top two “razors” to speed up/slow down if they are near the edges of the canvas.

my attempt to make a quadrifolium

Elena Deng-Project 7-Curves

sketch
This project was quite difficult for me to execute. With the link provided I was able to look at different algebraic functions and graphs; however, once I looked at the mathematical
functions themselves I got really confused. Overall, I am not really proud of this project and hope to be able to incorporate mathematical functions into my code in the future.

/*Elena Deng
Section E
  edeng1@andrew.cmu.edu
  Project-07
}
*/

var nPoints=100

function setup() {
    createCanvas(480, 480);
}

function draw() {
    background(0,50,50);
    var mX = mouseX; //establishes mouseX and mouseY function
    var mY = mouseY;
    noFill();
    strokeWeight(1);


//mouse position is constrained to the canvas size
    mouseX=constrain(mX, 0, width);
    mouseY=constrain(mY, 0, height);

    mPos=dist(mX,mY,width/2,height/2);
    a= map(mPos,0,width,0,480);

    eight(); //draws first eight loop
    circleOne(); //draws ellipse

//draws second eight loop
    push();
    rotate(HALF_PI);
      for(var i=0;i<nPoints;i++){
        var r = map(mouseX,0,width,100,255);
        var g = map(mouseX,0,width,100,200);
        var b = map(mouseY,0,height,100,100);
        stroke(r/2,g*3,b)
        // stroke(r,g,b)
          strokeWeight(1.5);

          var t = map(i,0,nPoints,0,TWO_PI);

          x=a*sin(t);
          y=a*sin(t)*cos(t);

          rotate(PI); //rotates figure
          x2=a*sin(t*2)*PI;
          y2=a*sin(t*2)*cos(t)*PI;

        vertex(x2,y2)

      endShape(CLOSE);
    pop();
    }
}
function eight(){ //draws first eight loop
  var r = map(mouseX,0,width,255,100); //changes color based on where mouseX and Y is
  var g = map(mouseX,0,width/10,200,100);
  var b = map(mouseY,0,height,80,100);
  stroke(r,g,b)

    strokeWeight(3);
    // stroke(r,g,b)
    var x;
    var y;

    beginShape();

      translate(width/2,height/2);

      for(var i=0;i<nPoints;i++){
        var t = map(i,0,nPoints,0,TWO_PI);

        x=a*sin(t);
        y=a*sin(t)*cos(t);
      vertex(x,y);

    endShape(CLOSE);
}
}
function circleOne(){ //draws the circle
  strokeWeight(1)
  var r = map(mouseX,0,width/4,100,300);
  var g = map(mouseX,0,width/4,180,200);
  var b = map(mouseY,0,height*6,100,200);
  for(var i=0;i<nPoints;i++){ //draws the loop of ellipse
    ellipse(0,0,a*i,a*i)
  }
}

mouse X and mouse Y at the maximum width/height of canvas
mouse X and mouse Y at the minimum width and height of canvas

Nina Yoo – Project 07 – Curves

sketch
I was really intrigued by the hypotrochoid curve and how it was drawn the site itself. Through this project I was able to play around with the functions of cos and sin which I havent been able to delve into before. It was interesting to play with the numbers and see what different shapes appeared because of the repetitively drawn lines.

/* Nina Yoo
Section E
nyoo@andrew.cmu.edu
Project-07 Composition with Curves*/

var nPoints = 200
function setup() {
    createCanvas(480, 480);
    		frameRate(15);

    
}

function draw() {
	background(200,34,164);
	push();
	//into middle
	translate(width/2, height/2);
	drawHypotrochoidCurve();
	pop();
}


function drawHypotrochoidCurve(){
		//Hyptotrochoid
		//Link: http://mathworld.wolfram.com/Hypotrochoid.html

		var x;
		var y;
		
		var h = 15;
	

		var a = map(mouseX, 0,width,100,300); // (wat u want to effect, orginal range, new range) makes the variables interactive
		var b = map(mouseY, 0, height, 100,300);

		stroke(210,36,117);
		strokeWeight(2);

		beginShape();
			for(var i = 0; i <nPoints; i ++){

				// set variable t within the for loop so it keeps on looping (this acts as the angle for mouse)
				var t = map (i, 0, nPoints, 0 , 330 );

					// equation for the curve
				x = (a - b) * cos(t) + h * cos((a - b) * t); 
				y = (a - b) * sin(t) - h * sin((a - b) * t);
				vertex(x,y); // setting the patternn in the middle

			}
		endShape(CLOSE);


}


Project 7 rrandell

sketch

/* Rani Randell
rrandell@andrew.cmu.edu
Section A
Project 7 */

function setup() {
    createCanvas(400, 400);
}

function draw() {
    background(255, 250, 180) //pastel pallette

    x = constrain(mouseX, 0, width);
    y = constrain(mouseY, 0, height);

    push();
    translate(width, height);
    drawHypotrochoid();
    pop();
}

function drawHypotrochoid() {

    for (var i = 0; i < TWO_PI; i ++) { 
       var a = map(y, 0, mouseX, 0, height); 
       var b = map(x, 0, mouseY, 0, width); 

        x = (a - b) * cos(i) + 200 * cos(((a-b)/b) * i); //equations
        y = (a - b) * sin(i) - 200 * sin(((a-b)/b) * i); // cited at bottom

        noFill();
        stroke(180, 150, 255); 
        strokeWeight(1);
        ellipse(-200, -200, x, y); //lavendar ellipse
        stroke(0, 0, 255);
        rect(-200, -200, x, y); //blue rectangles
        stroke(255, 250, 0) //clear yellow
        ellipse(-100, -100, x / .5, y / .5)
        stroke(255, 100, 240); //hot pink concentric circles
        ellipse(-300, -300, x * .5, x * .5)

    }
    //link to eq: http://mathworld.wolfram.com/Hypotrochoid.html
}

I really wanted this project to feel like an explosion of lines and color, so i mainly experimented with the various ellipses and rectangles after implementing the equations for a hypotrochoid. I included a process pic below:


Yoo Jin Shin-Project-07-Curves

Place mouse on canvas!

// Yoo Jin Shin
// Section D
// yoojins@andrew.cmu.edu
// Project-07-Curves


function setup() {
    createCanvas(480, 480);
}

function draw() {
	background(255);

	// Stroke color and weight based on mouseX
	var R = map(mouseX, 0, width, 170, 250);
	var W = map(mouseX, 0, width, 0.3, 1.5);

	push();
	translate(mouseX, mouseY);

	// Gray shadow curve properties
	stroke(240);
	strokeWeight(4); 
	drawCurve2();

	// Colored curve properties
	stroke(R, 200, 200);
	strokeWeight(W);
	drawCurve1();

	pop();
}

// Hypocycloid Pedal Curve (HPC)
function drawCurve1() { 
	var x;
	var y;
	var t = PI;
	var a = map(mouseX, 0, width, 0, 200);
	var n = map(mouseY, 0, height, 0, 10);

	beginShape();
		for(var i = 0; i < width; i++) {
			// HPC equations from Wolfram
			x = a * ((n - 1) * cos(t) + cos((n - 1) * t)) / n
			y = a * ((n - 1) * sin(t) - sin((n - 1) * t)) / n
			vertex(x, y);
			t += 1.3;
		}
	endShape();
}

// HPC Gray Shadow
function drawCurve2() { 
	var x;
	var y;
	var t = PI;
	var a = map(mouseX, 0, width, 0, 200);
	var n = map(mouseY, 0, height, 0, 10);

	beginShape();
		for(var i = 0; i < width; i++) {
			// Same as Curve1, but shifted slightly left/down
			x = a * ((n - 1) * cos(t) + cos((n - 1) * t)) / n - 5;
			y = a * ((n - 1) * sin(t) - sin((n - 1) * t)) / n - 5;
			vertex(x, y);
			t += 1.3;
		}
	endShape();
}

I looked through several different curves on the Wolfram website and ended up choosing the Hypocycloid Pedal Curve. I really liked the range of patterns that it produced when I mapped its properties to the mouse position. I decided to also gradually alter the color and stroke weight (based on the position) for more variety. I tried creating more depth by adding a slightly shifted and faded duplicate of the colored curve, similar to a shadow. Few of the different curves are shown below: 

carley johnson curves

sketch

/*Carley Johnson
Section E
cbjohnso@andrew.cmu.edu
Project 07
*/

let x = 0;
let y = 0;
let ang = 90;
let col = 0;
let moveC = 1;

function setup() {
  createCanvas(480, 480);
  angleMode(DEGREES);
}

function draw() {
  background(random(100, 255), random(200, 50), random(0, 255), 5);
  stroke(100, 100, 40);

  //moving the color value
  col += moveC;
  fill(col + 50, 20, 20);
    if (col >= 100 || col < 0) {
      moveC = moveC * -1;
  }

  //rotate around the center
  translate(width/2, height/2);
  //rotation increments
  rotate(x);
  x+=1;
  //draws ellipse
  for (i = 0; i < 360; i += 13) {
  ellipse(-mouseX + cos(i++) * width / (400 / 72), width / 20 + sin(i++) * width / (400 / 72), width / 20 + mouseX, width / 20 -mouseY);
  }


}

I was not a fan of this project, the curves were all so daunting and cos/sin is really something that confuses me. I’m satisfied with the spiral the circles rotate around according to your mouse, but this was not a great project for me. Hopefully next week I can produce something more aesthetically pleasing.

Victoria Reiter – Project 07 – Curves

sketch

/*
Victoria Reiter
Section B
vreiter@andrew.cmu.edu
Project-07-Curves
*/

// initial angle of rotation for the shape
var angle = 0;

function setup() {
    // establishes canvas size
    createCanvas(480, 480);
}

function draw() {
    // sets background color
    // the same one as from my ptoject 3... I really like it:)
    // the opacity gives it a cool fading effect!
    background('rgba(255,187,203,0.05)');
    // C's get DEGREES
    angleMode(DEGREES);
    // declares variables that will be used in the mathy-math later on
    var x;
    var y;
    var radius1;
    var radius2;
    var ratio1;
    var ratio2;
    // center x and center y points
    var cx = width / 2;
    var cy = height / 2;
    // color of shape's line will change as mouse moves from right to left
    var strokeColor = map(mouseX, 0, width, 0, 255);
    // color of shape's fill will change as mouse moves from right to left
    var fillColor = map(mouseX, 0, width, 255, 0);
    // makes that angle of rotation will change as mouse moves up and down
    var increment = map(mouseY, 0, height, 0, 7);

    beginShape();
    stroke(strokeColor);
    fill(fillColor);
    push();
    // draws at center of canvas
    translate(cx, cy);
    rotate(angle);
    // math *bows*
    for (var theta = 0; theta < 360; theta +=1) {
        radius1 = 70;
        radius2 = 30;
        ratio1 = map(mouseX, 0, width, 10, 200);
        x = (radius1 * cos(theta) + radius2 * cos(theta * ratio1));
        y = (radius1 * sin(theta) + radius2 * cos(theta * ratio1));
        vertex(x, y);
    }
    // makes the shape rotate
    angle = angle + increment;
    endShape(CLOSE);
    pop();
}

So doing this project, I struggled a bit because, uh, I haven’t had to use cos or sin since highschool….
Anyway. I got inspiration from Spirographs, since I think they’re cool and vintage-y and nostalgic and remind me of being little and stories my parents have told me. But how does one draw a Spirograph??? I took to the internet to find out. I found many very unhelpful resources, and one most-helpful one, here. It listed the equations x = cx + radius1 × cos(θ) + radius2 × cos(θ) and y = cy + radius1 × sin(θ) + radius2 × cos(θ), which I used to design my curve.

I have interactive elements for the shape fill, shape color, density(?) of curves comprising the shape, and speed of rotation.

And I made the background pretty pink with the opacity toyed with for a cool effect, stolen from my own Project 3 assignment because I like this effect so much.

Very trippy, this project. Quite trippy.