JasonZhu-Project-07-Curves

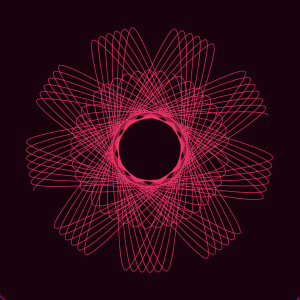
I liked this project a lot because it began to delve into more abstract realms. While the execution was difficult, I had a lot of fun in the process exploring various types of graphing functions and applications. In trying to determine how to build my proposed idea, I was able to rekindle a long held interest in computational art as well as explore the mathematical side of computing. I believe this project has a host of potential applications that will bode well for me in future projects and courses.

sketch

/* Jason Zhu
jlzhu@andrew.cmu.edu
Section E
Project 07-Curves
*/

function setup() {
    createCanvas(480, 480);
}

function draw() {
	// define constrain variables
	var cx = constrain(mouseX, 0, 480);
	var cy = constrain(mouseY, 0, 480);
	// define color variables
  	var red = cx * .3
  	var green = cy * .3
  	var blue = 100
  	// define additional variables and draw shapes
	background(red * .3 - 15, green * .3 - 15, blue * .3 - 15);
	drawhypotrochoid();
	drawhypotrochoid2();
	drawflowerellipse();
	drawflowerellipse2();
	frameRate(999);
}

function drawhypotrochoid() {
	push();
	translate(width / 2, height / 2);
	noFill();
	// define constraint function
    var cy = constrain(mouseY, 0, 480);
	var cx = constrain(mouseX, 0, 480);
	// define draw variables
	var r1 = 360;
    var a1;
    var b1;
	// define color variables
  	var red = cx * .25
  	var green = cy * .25
  	var blue = 100
  	// define stroke
    strokeWeight(10);
	stroke(red, green, blue);
  	// define shape parameters
    // define alternation parameters
    var a1 = map(cx, 0, width, 0, 25);
    var b1 = map(cy, 0, height, 0, 1);
    // define shape parameters
    beginShape();
    rotate(radians(angle));
		for(var t = 0; t < 360; t += 2) {
			var angle = map(t, 0, 360, 0, 360);
        // equation
			var x = (a1 - b1) * cos(angle) + r1 * cos((a1 - b1) * angle);
			var y = (a1 - b1) * sin(angle) - r1 * sin((a1 - b1) * angle);
			curveVertex(x, y);
			}
		endShape();
    pop();
}
function drawflowerellipse(){
	translate(width / 2, height / 2);
	noFill();
  	// define constrain variables
	var cx = constrain(mouseX, 0, 480);
	var cy = constrain(mouseY, 0, 480);
	// define draw variables
  	var angle = map(cx, 0, width, 0, 360);
  	var a2 = 100 + (.2 * cx);
  	var b2 = 100 + (.2 * cx);
  	// define color variables
  	var red = cx * .6
  	var green = cy * .6
  	var blue = 100
  	// define stroke
    strokeWeight(1);
	stroke(red, green, blue);
  	// define shape parameters
  	beginShape();
	rotate(radians(angle));
  	for (var t = 0; t < 160; t +=2.8){
	    var x = a2 * (cos(t));
	    var y = b2 * (sin(t));
	    curveVertex(x,y);
		}
	endShape();
}

function drawflowerellipse2(){
	noFill();
  	// define constrain variables
	var cx = constrain(mouseX, 0, 480);
	var cy = constrain(mouseY, 0, 480);
	// define draw variables
  	var angle = map(cx, 0, width, 0, 360);
  	var a2 = 30 + (.2 * cx);
  	var b2 = 30 + (.2 * cx);
  	// define color variables
  	var red = cx * .6
  	var green = cy * .6
  	var blue = 100
  	// define stroke
    strokeWeight(1);
	stroke(red, green, blue);
  	// define shape parameters
  	beginShape();
	rotate(radians(angle));
  	for (var t = 0; t < 160; t +=3.8){
	    var x = a2 * (cos(t));
	    var y = b2 * (sin(t));
	    curveVertex(x,y);
		}
	endShape();
}

function drawhypotrochoid2(){
	push();
	translate(width / 2, height / 2);
	noFill();
	// define constraint function
    var cy = constrain(mouseY, 0, 480);
	var cx = constrain(mouseX, 0, 480);
	// define draw variables
	var r1 = 360;
    var a1;
    var b1;
	// define color variables
  	var red = cx * .3
  	var green = cy * .3
  	var blue = 100
  	// define stroke
    strokeWeight(5);
	stroke(red * .3 - 15, green * .3 - 15, blue * .3 - 15);
  	// define shape parameters
    // define alternation parameters
    var a1 = map(cx, 0, width, 0, 25);
    var b1 = map(cy, 0, height, 0, 1);
    // define shape parameters
    beginShape();
    rotate(radians(angle));
		for(var t = 0; t < 360; t += 2) {
			var angle = map(t, 0, 360, 0, 360);
        // equation
			var x = (a1 - b1) * cos(angle) + r1 * cos((a1 - b1) * angle);
			var y = (a1 - b1) * sin(angle) - r1 * sin((a1 - b1) * angle);
			curveVertex(x, y);
			}
		endShape();
    pop();
}


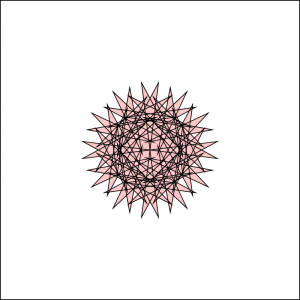
screenshot at the maximum width and minimum height of the canvas.
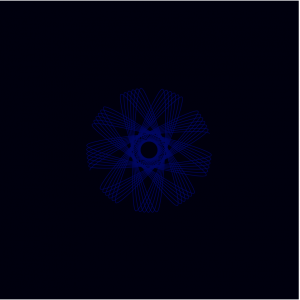

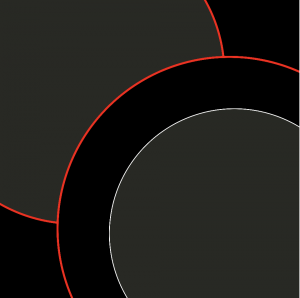
mouse X and mouse Y at the minimum width and height of the canvas.
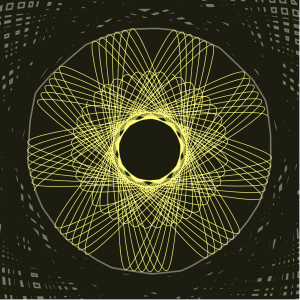

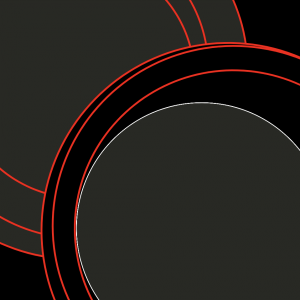
mouse X and mouse Y at the maximum width and height of the canvas.

Sean Meng – Project 7

sketch

function setup() {
    createCanvas(480, 480);
    frameRate(10);
}


function draw () {
    background(0)
    noFill()
    stroke(255)
    var nPoints = 20;
    var radius = 50;
    var separation = 125;
    var R1 = mouseX/2
    var R2 = mouseY/2

//the color of the pattern changes slowly from bluee to red as the mouse moves along the diagnal of canvas  
//the first set of rectangle loop
    stroke(mouseX, 10, 10)
    push();
    translate(2*separation, height / 2);
    for (var i = 0; i < nPoints; i++) {
        var theta = map(i, 0, nPoints, 0, TWO_PI);
        var px = R1 * cos(theta);
        var py = R2 * sin(theta);
        rect(px - 5, py - 5, 10, 10);
    }
    pop();

//the second set of rectangle loop
    stroke(mouseX, 30, 30)
    push();
    translate(2*separation, height / 2);
    for (var i = 0; i < nPoints; i++) {
        var theta = map(i, 0, nPoints, 0, TWO_PI);
        var px = R1 * cos(theta);
        var py = R2 * sin(theta);
        rect(px - 10, py - 10, 20, 20);
    }
    pop();

//the third set of rectangle loop
    stroke(mouseX, 50, 50)
    push();
    translate(2*separation, height / 2);
    for (var i = 0; i < nPoints; i++) {
        var theta = map(i, 0, nPoints, 0, TWO_PI);
        var px = R1 * cos(theta);
        var py = R2 * sin(theta);
        rect(px - 15, py - 15, 30, 30);
    }
    pop();

//the fourth set of rectangle loop
    stroke(mouseX, 70, 70)
    push();
    translate(2*separation, height / 2);
    for (var i = 0; i < nPoints; i++) {
        var theta = map(i, 0, nPoints, 0, TWO_PI);
        var px = R1 * cos(theta);
        var py = R2 * sin(theta);
        rect(px - 30, py - 30, 60, 60);
    }
    pop();

//the fifth set of rectangle loop
    stroke(mouseX, 90, 90)
    push();
    translate(2*separation, height / 2);
    for (var i = 0; i < nPoints; i++) {
        var theta = map(i, 0, nPoints, 0, TWO_PI);
        var px = R1 * cos(theta);
        var py = R2 * sin(theta);
        rect(px - 50, py - 50, 100, 100);
    }
    pop();

//the sixth set of rectangle loop
    stroke(mouseX, 110, 110)
    push();
    translate(2*separation, height / 2);
    for (var i = 0; i < nPoints; i++) {
        var theta = map(i, 0, nPoints, 0, TWO_PI);
        var px = R1 * cos(theta);
        var py = R2 * sin(theta);
        rect(px - 90, py - 90, 180, 180);
    }
    pop();

//the seventh set of rectangle loop
    stroke(mouseX, 140, 140)
    push();
    translate(2*separation, height / 2);
    for (var i = 0; i < nPoints; i++) {
        var theta = map(i, 0, nPoints, 0, TWO_PI);
        var px = R1 * cos(theta);
        var py = R2 * sin(theta);
        rect(px - 95, py - 95, 190, 190);
    }
    pop();

//the eighth set of rectangle loop
    stroke(mouseX, 170, 170)
    push();
    translate(2*separation, height / 2);
    for (var i = 0; i < nPoints; i++) {
        var theta = map(i, 0, nPoints, 0, TWO_PI);
        var px = R1 * cos(theta);
        var py = R2 * sin(theta);
        rect(px - 100, py - 100, 200, 200);
    }
    pop();

//the nineth set of rectangle loop
    stroke(mouseX, 220, 220)
    push();
    translate(2*separation, height / 2);
    for (var i = 0; i < nPoints; i++) {
        var theta = map(i, 0, nPoints, 0, TWO_PI);
        var px = R1 * cos(theta);
        var py = R2 * sin(theta);
        rect(px - 105, py - 105, 210, 210);
    }
    pop();

}    

In this project, I wanna design a floral pattern that can change colors using repeating geometries. The flower’s color changes to blue to read as the mouse moves diagonally on the canvas. The change of color also represents blossom.

Katherine Hua – Project-07 – Curves

sketch

/* Katherine Hua
Section A
khua@andrew.cmu.edu
Project-07-Curves */

function setup() {
    createCanvas(480, 480);
    frameRate(10);
}

function draw() {

	var r1 = map(mouseX, 0, width, 230, 250); // making variables to make the background dependent on mouseX or mouseY
	var g1 = map(mouseY, 0, height, 220, 230);
	var b1 = map(mouseX, 0, width, 225, 250);
    background(r1, g1, b1); // setting background color
    var nPoints = 200; // setting number of points on shape
    var radius;

// legs
	strokeWeight(5); 
	bezier(random(195, 205), 320, 150, 320, 240, 400, random(165, 175), 400); // left leg
	bezier(random(275, 285), 320, 320, 320, 240, 400, random(300, 310), 400); // right lelg

// body
	strokeWeight(5);
	fill(50, 50, 50);
	push();
    translate(width/2, height/2);
    beginShape();
    radius = 200;
    for (var i = 0; i < nPoints; i++) {
        var theta = map(i, 0, nPoints, 0, TWO_PI);
        var a = map(mouseX, 0, 480, 90, 110); //body will change sizes based on position of mouseX
        var n = map(mouseX, 0, 480, 40, 90);
        var px = (a/n)*(((n-1)*cos(theta))-(cos((n-1)*theta)));
        var py = (a/n)*(((n-1)*sin(theta))-(sin((n-1)*theta)));
        vertex(px + random(-5, 5), py + random(-5, 5));
    } endShape(CLOSE);
    pop();

// eyes	
	strokeWeight(1);
	fill(255);
	nPoints = 10;
	// whites of left eye
    push();
    translate(width/2 - 40, height/2 + 10);
    beginShape();
    radius = 30;
    for (var i = 0; i < nPoints; i++) {
        var theta = map(i, 0, nPoints, 0, TWO_PI);
        var px = radius * cos(theta);
        var py = radius * sin(theta);
        vertex(px + random(-5, 5), py + random(-5, 5));
    } endShape(CLOSE);
    pop();
    // whites of right eye
    push();
    translate(width/2 + 40, height/2 + 10);
    beginShape();
    radius = 30;
    for (var i = 0; i < nPoints; i++) {
        var theta = map(i, 0, nPoints, 0, TWO_PI);
        var px = radius * cos(theta);
        var py = radius * sin(theta);
        vertex(px + random(-5, 5), py + random(-5, 5));
    } endShape(CLOSE);
    pop();
    // pupil of left eye
    fill(0);
    nPoints = 4;
    push();
    translate(width/2 - 40, height/2 + 10);
    beginShape();
    radius = 10;
    for (var i = 0; i < nPoints; i++) {
        var theta = map(i, 0, nPoints, 0, TWO_PI);
        var px = radius * cos(theta);
        var py = radius * sin(theta);
        vertex(px + random(-5, 5), py + random(-5, 5));
    } endShape(CLOSE);
    pop();
    // pupil of right eye
    push();
    translate(width/2 + 40, height/2 + 10);
    beginShape();
    radius = 10;
    for (var i = 0; i < nPoints; i++) {
        var theta = map(i, 0, nPoints, 0, TWO_PI);
        var px = radius * cos(theta);
        var py = radius * sin(theta);
        vertex(px + random(-5, 5), py + random(-5, 5));
    } endShape(CLOSE);
    pop();
    
//arms
	noFill();
	strokeWeight(5);
	//making arms grabbing hand curve different depending if arms are reaching below or above the midpoint
	if (mouseY > width/2) {
		bezier(random(145, 155), 240, random(115, 125), 240, mouseX - 80, mouseY + 40, mouseX-50, mouseY-50); //left arm
		bezier(random(325, 335), 240, 360, random(235, 245), mouseX + 80, mouseY - 40, mouseX+50, mouseY-50); //right arm
	} else if (mouseY < width/2) {
		bezier(150, 240, 120, 240, mouseX - 80, mouseY + 40, mouseX-50, mouseY+50); //left arm
		bezier(330, 240, 360, 240, mouseX + 80, mouseY - 40, mouseX+50, mouseY+50);	//right arm
	}

	//star
	rectMode(CENTER);
	push();
	translate(mouseX, mouseY); //star will follow position of the mouse
	var r2 = map(mouseY, 0, height, 200, 230);
	var g2 = map(mouseY, 0, height, 150, 180);
	var b2 = map(mouseX, 0, width, 125, 175);
	fill(r2, g2, b2);
	stroke(r2, g2, b2);
    rect(0, 0, 20, 20);
    push();
    rotate(PI/4);
    rect(0,0, 20, 20);
    pop();
	pop();
}

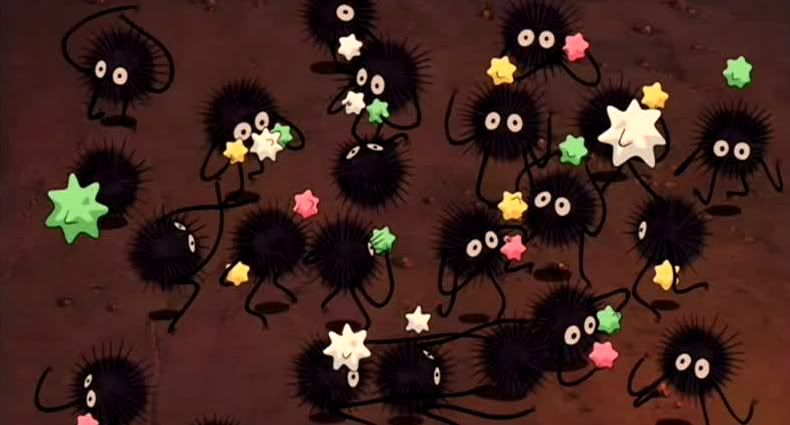
My design is based off of one of my favorite childhood movies, “Spirited Away.” The character I created is supposed to be one of the coal spirit (or soot ball). Below is an image of how they look like:

Spirited Away coal spirits

These sootballs are constantly moving and really like to eat these star candies so made a star candy follor the mouse and the sootball’s arms try to reach for the candy.

Alessandra Fleck – Project 07

sketch

//Name: Alessandra Fleck 
//Class Section : B
//Email: afleck@andrew.cmu.edu
//Project-07


var Points = 500; //more points makes smoother curves
var Epitrochoid = 0; 

var x;
var y;


function setup() {
    createCanvas(480, 480);
    frameRate(40); //more frames = clearer motion
}

function draw() {
    background(0); // set background to black
    // draw the Epitrochoid

    push();
    translate(300, height / 2); //locate at upper left corner
    drawEpitrochoidCurve_01();
    //move second curve to lower right corner
    translate(width / 10, height/10);
    drawEpitrochoidCurve_02();
    //move second curve to lower right corner
    translate(width / 60, height/60);
    drawEpitrochoidCurve_03();
    pop();
}


function drawEpitrochoidCurve_01() { // for the curve on the top left corner
    
    
    var a =  40.0;
    var b = a / 0.2;
    var h = constrain(mouseY / 10.0, 0, b);
    var t;
    var mX = mouseX / 100.0; // mouse move over moves shape slower as value is larger
    var r = map(mouseX,0,width/0.8,0,1); //pulsing movement
    
    beginShape();
    fill(40,41,35);
    for (var i = 0; i < Points; i++) {

        stroke('red'); //add red to vibration lines
        strokeWeight(3);
        vertex(x, y);
        var t = map(i, 0, Points, 0, TWO_PI*3); // mess with curves within shapes

        //Parametric equations for Epitrochoid Curve
        x = r* ((a + b) * cos(t) - h * cos((t * (a + b) / b) + mX));
        y = r* ((a + b) * sin(t) - h * sin((t * (a + b) / b) + mX));
        
    }
    endShape(CLOSE);
    
}

function drawEpitrochoidCurve_02() { //for the curve on the bottom corner


    var a =  55.0;
    var b = a / 0.25; //degree of displacement
    var h = constrain(mouseY / 20.0, 0, b);
    var t;
    var mX = mouseX / 50.0;
    
    
    beginShape();
    fill(0);
    for (var i = 0; i < Points; i++) {
        stroke('red'); //add red to vibration lines
        strokeWeight(3);
        vertex(x+200, y+200);//set center point for the epitrochoid
        var t = map(i, 0, Points, 0, TWO_PI*3); // mess with curves within shapes
        
        //Parametric equations for Epitrochoid Curve

        x = (a + b) * cos(t) - h * cos((t * (a + b) / b) + mX);
        y = (a + b) * sin(t) - h * sin((t * (a + b) / b) + mX);
        
    }
    endShape(CLOSE);
    
}

function drawEpitrochoidCurve_03() { //for the curve on the bottom corner
    
    //light white line curves
    
    var a =  40.0;
    var b = a / 0.25; //degree of displacement
    var h = constrain(mouseY / 10.0, 0, b);
    var t;
    var mX = mouseX / 50.0;
    
    
    beginShape();
    fill(40,41,35);
    for (var i = 0; i < Points; i++) {
        stroke(255); //add red to vibration lines
        strokeWeight(1);
        vertex(x+200, y+200);
        var t = map(i, 0, Points, 0, TWO_PI*3); // mess with curves within shapes
        
        //Parametric equations for Epitrochoid Curve

        x = (a + b) * cos(t) - h * cos(mX + ((a + b) / b) + mX);
        y = (a + b) * sin(t) - h * sin(mX + ((a + b) / b) + mX);
        
    }
    endShape(CLOSE);
    
}

//http://mathworld.wolfram.com/Epitrochoid.html

For this project I just wanted to play with using the “b” variable in the parametric equation for an epitrochoid and using that variable as the axis for the degree of change in the movement. I did struggle a bit with the vertex parameter so if I continue this project that is what I would look to refine.

project 07

sketch,js

/* Arden Wolf
Section B
ardenw@andrew.cmu.edu
Project 07
*/


var nPoints = 20;
var radius = 50;
var separation = 125;

function setup() {
    createCanvas(480, 480);
    frameRate(10);
}

function draw() {
    background(0);
    noStroke();
    //magenta
    fill (50);
    ellipse(125,120,100,100);
    fill (80);
    ellipse(125,120,80,80);
    fill (100);
    ellipse(125,120,50,50);
    fill (120);
    ellipse(125,120,30,30);


    //yellow
    fill (50);
    ellipse(377,240,100,100);
    fill (80);
    ellipse(377,240,80,80);
    fill (100);
    ellipse(377,240,50,50);
    fill (120);
    ellipse(377,240,30,30);


    //calls light beam
    LightBeam(); 
    //calls wiggle
     wiggle();
    //call square
     square();


}

function LightBeam() {
  for(var h = 0; h < 100; h++) //allows for thicker lines
    {
        //yellow
         push();
        translate(3 * separation, height / 2);
        for (var i = 0; i < nPoints; i++) {
        var theta = map(i, mouseX, nPoints, mouseY, TWO_PI);
        var px = radius * cos(theta);
        var py = radius * sin(theta);
        stroke (255,255,0);
        line(-375, 238, px, py);
        }
        pop();

         push();
        translate(3 * separation, height / 2);
        for (var i = 0; i < nPoints; i++) {
        var theta = map(i, mouseX, nPoints, mouseY, TWO_PI);
        var px = radius * cos(theta);
        var py = radius * sin(theta);
        stroke (255,255,0);
        line(0, 238, px, py);
        }
        pop();


        //magenta
         push();
        translate( separation, height / 4);
        for (var i = 0; i < nPoints; i++) {
        var theta = map(i, mouseX, nPoints, mouseY, TWO_PI);
        var px = radius * cos(theta);
        var py = radius * sin(theta);
        stroke (255,0,255);
        line(360, 365, px, py);
        }
        pop();

         push();
        translate( separation, height / 4);
        for (var i = 0; i < nPoints; i++) {
        var theta = map(i, mouseX, nPoints, mouseY, TWO_PI);
        var px = radius * cos(theta);
        var py = radius * sin(theta);
        stroke (255,0,255);
        line(360, 0, px, py);
        }
        pop();
    }

}
function wiggle(){
    stroke(4);

    //first
    fill(255,165,0);
    push();

    translate(separation, height/1.7);
    beginShape();
    for (var i = 0; i < nPoints; i++) {
        var theta = map(i, mouseX, nPoints, mouseY, TWO_PI);
        var px = radius * cos(theta);
        var py = radius * sin(theta);
        vertex(px + random(-5, 5), py + random(-5, 5));
    }
    endShape(CLOSE);
    pop();

    //second
    fill(255,100,10);
    push();
    translate(separation, height/1.7);
    beginShape();
    for (var i = 0; i < nPoints; i++) {
        var theta = map(i, mouseX, nPoints, mouseY, TWO_PI);
        var px = radius * cos(theta)/2;
        var py = radius * sin(theta)/2;
        vertex(px + random(-5, 5), py + random(-5, 5));
    }
    endShape(CLOSE);
    pop();

}

function square(){
//first
    fill(255,100,10);
    push();
    translate(2*separation+40, height/1.18);
    beginShape();
    for (var i = 0; i < nPoints; i++) {
        var theta = map(i, mouseX, nPoints, mouseY, TWO_PI);
        var px = radius * cos(theta);
        var py = radius * sin(theta);
        vertex(px + random(-5, 5), py + random(-5, 5));
    }
    endShape(CLOSE);
    pop();

//second
    fill(255,165,0);
      push();
    translate(2*separation+40, height/1.18);
   beginShape();
    for (var i = 0; i < nPoints; i++) {
        var theta = map(i, mouseX, nPoints, mouseY, TWO_PI);
        var px = radius * cos(theta)/2;
        var py = radius * sin(theta)/2;
        vertex(px + random(-5, 5), py + random(-5, 5));
    }
    endShape(CLOSE);
    pop();
}

I was inspired by commits and stars in space and used the equations, mouseX and mouseY to make it interactive.

Sophie Chen – Project 07 – Curves

sketch

var x;
var y;

function setup() {
    createCanvas(480, 480);
    frameRate(25);
}

function draw() {
	background(0, 0, 0, 57);
	noFill();
	drawDeltoid();
	drawDeltoid2();
	drawDeltoid3();
}

// Outermost circle
function drawDeltoid(){

    var nPoints = 50;
	var radius = 50;
	var separation = 60;
	strokeWeight(1);
	stroke(150, 205, 255);
    push();
    translate(4 * separation, height / 2);
    beginShape();
    for (var i = 0; i < nPoints; i++) {
        var range = map(mouseX, 0, width, 0, 200)
        var px = range * cos(i) + cos(2 * i);
        var py = range * sin(i) - sin(2 * i);
        vertex(px + random(-mouseX / 30, mouseX / 80), py + random(-mouseX / 30, mouseX / 80));
    }
    endShape(CLOSE);
    pop();
}

// Middle circle
function drawDeltoid2(){

    var nPoints = 50;
    var radius = 50;
    var separation = 60;
    push();
    translate(4 * separation, height / 2);
    beginShape();
    for (var i = 0; i < nPoints; i++) {
        var px = mouseX / 4 * cos(i + mouseY / 50) + cos(2 * i);
        var py = mouseX / 4 * sin(i) - sin(2 * i);
        vertex(px + random(-5, 5), py + random(-5, 5));
    }
    endShape(CLOSE);
    pop();
}

// Inner circle

function drawDeltoid3(){

	var nPoints = 50;
    var radius = 50;
    var separation = 60;
    
    push();
    translate(4 * separation, height / 2);
    beginShape();
    for (var i = 0; i < nPoints; i++) {
        var px = mouseX / 4 * cos(i + mouseY / 50) + cos(2 * i);
        var py = mouseX / 4 * cos(i) - sin(2 * i);
        vertex(py + random(-5, 5), px + random(-5, 5));
    }
    endShape(CLOSE);
    pop();

}

At first I was a bit overwhelmed by all the mathematical equations for different curves, but once I settled on one and started playing around with it everything made a lot more sense. I really enjoyed the process of this project and changing every value in the equations to see and understand what they did.

Kevin Thies – Project 7 – Curves

sketch
Pretty early on I went through the site of curves, and I found the heart curves and decided I anted to do one. Conveniently, the one I thought looked best was straightforward to make. I was interested if JavaScript would take unicode as strings, and fortunately it does. Unfortunately, it’s plagued by an issue shared with many unicode sets – emoji. I had to make sure the unicode I wanted wouldn’t render as an emoji, because that just doesn’t look as crisp. In hindsight, it ould have been cool if I had used the function to generate a path for a moving heart like Lab 6, but there’s time for that in the future.

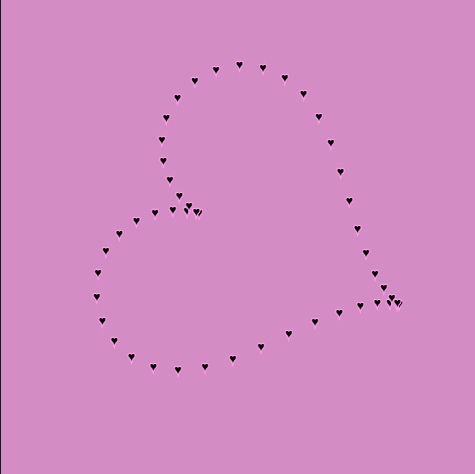
This was when I first got the points to work with the unicode
// Kevin Thies
// kthies@andrew.cmu.edu
// Section C
// Project 07 - Curve Composition

var pointNum = 100; // number of points in the heart
var bigScale = 20; // scale value of the largest heart
var smallScale = 2; // scale step of the iterations
var rotAngle = 1; // rotation angle of hearts
var rotIncrement = .02; // increment of rotation per frame in radians
var xScale; // mouse X - dependant scaling value of heart
var yScale; // mouse y - dependant scaling v alue of heart
var iterations = 10; // number of hearts drawn


function setup() {
  createCanvas(480,480);
}


function draw() {
    // style
    background(211,141,196);
    stroke(255,155,233);
    fill(0);

    // constrain the scaling of the X and Y of hearts
    xScale = constrain(map(mouseX, 0, width, 0, 1), .2, 1);
    yScale = constrain(map(mouseY, 0, height, 0, 1), .2, 1);

    // increment rotation
    rotAngle = rotAngle += rotIncrement;

    push();
    // move hearts to center of canvas
    translate(width/2, height/2);
    // rotate around center of canvas by the rotation angle
    rotate(rotAngle);

    // draw heart iterations
    for(var i = 0; i < iterations; i++) {
        // sizes decrease based on iteration number
        textSize(2 * (iterations - i));
        strokeWeight(.2 * (iterations - i));
        heartPoints(bigScale - i * smallScale, xScale, yScale);
    }
    pop();
}


function heartPoints(s, xS, yS) {
    // from http://mathworld.wolfram.com/HeartCurve.html
    // x = 16sin^3(t)
    // y = 13cos(t) - 5cos(2t) - 2cos(3t)- cos(4t)
    var x;
    var y;

    // grab x and y coords for pointNum amount of points
    for(var j = 0; j < pointNum; j++) {
        var t = map(j, 0, pointNum, 0, TWO_PI);

        // calculate x and y of asterisks
        x = xS * s * (16 * pow(sin(t), 3));
        y = yS * s * (13 * cos(t) - 5 * cos(2 * t) - 2 * cos(3 * t) - cos(4 * t));

        // place a unicode heart at the point, counter-rotate it
        push();
        translate(x, y);
        rotate(-rotAngle);
        text("♥", 0, 0);
        pop();
    }
}

Project 07 – Curves

sketch

function setup() {
    createCanvas(480, 480);
    frameRate(15);
}

function draw() {
	background(255, 200, 200);
    fill(255, 255, 255, 64);
    var nPoints = 30;
    var radius = 30;

    //fire body
    //red fire
    push();
    translate(width / 2 - 30, height / 2);
    beginShape();
    noStroke();
    fill(201, 75, 56);
    beginShape();
    for (var i = 0; i < nPoints ; i++) {
        var theta = map(i, 0, nPoints, 0, TWO_PI);
        var px = 5.5 * radius * cos(theta);
        var py = 5.5 * radius * sin(theta);
        if (i > 15 & i < 24) {
        	vertex(px + random(-2, 2), py + random(-2, 2) - 50);
        } else {
        	vertex(px + random(-2, 2), py + random(-2, 2));
        }
    }
    endShape();
    pop();

    //red-orange fire
    push();
    translate(width / 2 - 30, height / 2);
    beginShape();
    noStroke();
    fill(230, 112, 84);
    beginShape();
    for (var i = 0; i < nPoints ; i++) {
        var theta = map(i, 0, nPoints, 0, TWO_PI);
        var px = 5 * radius * cos(theta);
        var py = 5 * radius * sin(theta);
        if (i > 15 & i < 24) {
        	vertex(px + random(-2, 2), py + random(-2, 2) - 50);
        } else {
        	vertex(px + random(-2, 2), py + random(-2, 2));
        }

    }
    endShape();
    pop();

    //orange fire
    push();
    translate(width / 2 - 30, height / 2);
    beginShape();
    noStroke();
    fill(235, 173, 78);
    beginShape();
    for (var i = 0; i < nPoints; i++) {
        var theta = map(i, 0, nPoints, 0, TWO_PI);
        var px = 3.5 * radius * cos(theta);
        var py = 3.5 * radius * sin(theta);
        if (i > 13 & i < 22) {
        	vertex(px + random(-4, 4), py + random(-4, 4) - 40);
        } else {
        	vertex(px + random(-4, 4), py + random(-4, 4));
        }

    }
    endShape();
    pop();

    //yellow fire
    push();
    translate(width / 2 - 30, height / 2);
    beginShape();
    noStroke();
    fill(240, 209, 90);
    beginShape();
    for (var i = 0; i < nPoints; i++) {
        var theta = map(i, 0, nPoints, 0, TWO_PI);
        var px = 1.5 * radius * cos(theta);
        var py = 1.5 * radius * sin(theta);
        if (i > 14 & i < 24) {
        	vertex(px + random(-5, 5), py + random(-5, 5) - 30);
        } else {
        	vertex(px + random(-5, 5), py + random(-5, 5));
        }

    }
    endShape();
    pop();

    //left cheek
    beginShape();
    smooth();
    noFill();
    curveVertex(width / 4 + 5 + random(-2, 2), height / 2 + 60 + random(-2, 2));
    curveVertex(width / 4 + 5 + random(-2, 2), height / 2 + 50 + random(-2, 2));
    curveVertex(width / 4 + 10 + 10 + random(-2, 2), height / 2 + 50 - 10 + random(-2, 2));
    curveVertex(width / 4 + 10 + 20 + 5 + random(-2, 2), height / 2 + 50 - 5 + random(-2, 2));
    curveVertex(width / 4 + 10 + 20 + 8 + random(-2, 2), height / 2 + 50 + 14 + random(-2, 2))
    curveVertex(width / 4 + 10 + 20 + random(-2, 2), height / 2 + 50 + 20 + random(-2, 2))
    endShape();

    //right cheek
    beginShape();
    smooth();
    noFill();
    curveVertex(width / 2 + 60 + random(-2, 2), height / 3 + 40 + random(-2, 2));
    curveVertex(width / 2 + 40 + random(-2, 2), height / 3 + 20 + random(-2, 2));   
    curveVertex(width / 2 + 40 - 12 + random(-2, 2), height / 3 + 20 + 15 + random(-2, 2));
    curveVertex(width / 2 + 40 + random(-2, 2), height / 3 + 20 + 30 + random(-2, 2));
    curveVertex(width / 2 + 40 + 10 + random(-2, 2), height / 3 + 20 + 30 + random(-2, 2))
    curveVertex(width / 2 + 80 + random(-2, 2), height / 3 + 30 + random(-2, 2))
    endShape();

    //mouth
    beginShape();
    smooth();
    noFill();
    curveVertex(width / 4 + 10 + 20 + 5 + random(-2, 2) - 20, height / 2 + 50 - 5 + random(-2, 2) + 50);
    curveVertex(width / 4 + 10 + 20 + 5 + random(-2, 2), height / 2 + 50 - 5 + random(-2, 2));
    curveVertex(width / 4 + 10 + 20 + 30 + random(-2, 2), height / 2 - 25 + random(-2, 2));
    curveVertex(width / 2 + random(-2, 2) - 20, height / 2 - 30 + random(-2, 2));
    curveVertex(width / 2 + 40 - 12 + random(-2, 2), height / 3 + 20 + 15 + random(-2, 2));
    curveVertex(width / 2 + 40 - 12 + random(-2, 2) + 30, height / 3 + 20 + 15 + random(-2, 2));
    endShape();

	//left eye
    push();
    fill(255);
    translate(width / 4, height / 2);
    beginShape();
    for (var i = 0; i < nPoints; i++) {
        var theta = map(i, 0, nPoints, 0, TWO_PI);
        var px = radius * cos(theta);
        var py = radius * sin(theta);
        vertex(px + random(-1, 1), py + random(-1, 1));
    }
    endShape(CLOSE);

    //left pupil

    push();
    fill(0);
    var mouseXeyes = map(mouseX, 0, 1000, -10, 10);
    var mouseYeyes = map(mouseY, 0, 800, -10, 10);
    ellipse(mouseXeyes, mouseYeyes, 20, 20);
    pop();

   	//right eye
    translate(width / 4,  -height / 6);
    beginShape();
    for (var i = 0; i < nPoints; i++) {
        var theta = map(i, 0, nPoints, 0, TWO_PI);
        var px = radius * cos(theta);
        var py = radius * sin(theta);
        vertex(px + random(-1, 1), py + random(-1, 1));
    }
    endShape(CLOSE);

    //right pupil
    push();
    fill(0);
    var mouseXeyes = map(mouseX, -500, 1000, -10, 10);
    var mouseYeyes = map(mouseY, -500, 1000, -10, 10);
    ellipse(mouseXeyes, mouseYeyes, 20, 20);
    pop();

    pop();

  	//bottom text
  	stroke(0);
  	fill(0);
  	textFont("Georgia");
  	textSize(22);
  	text("calcifer.", width / 2 - 30, height / 10 * 9 + 10);

    //egg
    push();
    noStroke();
    fill(255);
    beginShape();
    smooth();
    ellipse(mouseX, mouseY, 50, 60)
  	endShape(CLOSE);
  	stroke(0);
  	beginShape();
  	vertex(mouseX - 23, mouseY - 10)
   	vertex(mouseX - 15, mouseY - 2)
	vertex(mouseX - 5, mouseY - 10)
  	vertex(mouseX + 5, mouseY - 2)
	vertex(mouseX + 15, mouseY - 10)
	vertex(mouseX + 25, mouseY - 2)
	endShape();
  	pop();

}

For this project, I was inspired by the moving circle in the example given. I used this to attempt to recreate one of my favorite characters from Studio Ghibli, Calcifer. The moving points give Calcifer the feel of a live fire.

Miranda-Luong-Project-07-Curves

sketch

/* Miranda Luong
Section E
mluong@andrew.cmu.edu
Project-07
*/


var nPoints = 100;


function setup() {
    createCanvas(400, 400);
    frameRate(10);
}


function draw() {
    background(255);
    
    // draw the frame
    fill(0); 
    noStroke();

    stroke(0);
    noFill(); 
    rect(0, 0, width-1, height-1); 
    
    translate(width / 2, height / 2);
    drawEpicycloidCurve();
}

//--------------------------------------------------
function drawEpicycloidCurve() {
    // Epicycloid:
    // http://mathworld.wolfram.com/Epicycloid.html
    
    var x;
    var y;
    
    var a = 80.0;
    var b = a / 2.0;

    //Uses mouseX and mouse Y to define the number of petals and overall scale of curve
    var n = round(dist(mouseX,mouseY,width/2,height/2)/5);
    
    fill(255, 200, 200);
    beginShape();
    for (var i = 0; i < nPoints; i++) {
        var t = map(i, 0, nPoints, 0, TWO_PI);
        
        x = (n + 2) * (cos(t) - cos((n + 1) * t));
        y = (n + 2) * (sin(t) - sin((n + 1) * t));

        vertex(x, y);
    }
    endShape(CLOSE);    
}

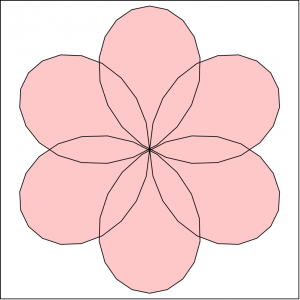
This was a really hard project to complete. It was hard translating the functions into code, seeing as I don’t really know much math anymore. It took lots of trial and error trying to navigate which variables controlled what in my function. I’m quite happy with the results though, I think it is a very pretty display.

Jessica Timczyk – Project 07 – Curves

Curves

// Jessica Timczyk
// Section D
// jtimczyk@andrew.cmu.edu
// Project-07-Curves

// Global Variables
var z;
var colorR;
var colorG;
var colorB;


function setup() {
    createCanvas(480, 480);
    z = -width / 4;
}

function draw() {
    background(255, 215, 250);
    translate(width / 2, height / 2, z);
    rotate(map(mouseX, 0, width, 0, TWO_PI)); // allow curve to rotate
    colorR = map(mouseY, 0, height, 0, 100); // variables for color transition
    colorG = map(mouseY, 0, height, 70, 100);
    colorB = map(mouseY, 0, height, 100, 220);
    drawLoxodrome(0.4, map(mouseX, 0, 400, 0, 480)); // draw curves and change size as mouse moves
}

function drawLoxodrome(b, scal) { // equations for drawing the curves of the loxodrome
    for (var a = 0.4; a < 4; a += 0.2) {
        noStroke();
        fill(colorR, colorG, colorB); // fill of the curves change
        beginShape(QUAD_STRIP); // establish the begining of the curve shape
        var w = 0.1 / sqrt(a + 1);
        for (var t = -20; t < 20; t += 0.1) {
            var q = 4 + a * a * exp(2 * b * t);
            vertex(scal * 4 * a * exp( b * t) * cos(t) / q, scal * 4 * a * exp( b * t) * sin(t) / q);
            var c = a + w;
            q = 4 + c * c * exp(2 * b * t);
            vertex(scal * 4 * c * exp(b * t) * cos(t) / q, scal * 4 * c * exp(b * t) * sin(t) / q);
        }
        endShape();
    }
}

I really enjoyed doing this project, it allowed me to experiment with a bunch of different curves and shapes. Although it took a while to decide what shape to do and as well figure out the different equations and what each one does, the ending results are very interesting and intricate curves. I liked being able to manipulate and explore what each of the different parameters control. After messing with the different variables and trying to change different ones with the movements of the mouse, I  decided on having the mouse movement control the scale of the shape rather than one of the other parameters so that it would keep the main structure of the curve intact as it moved. Overall, I really enjoyed this project because it allowed me to explore more things and aspects of the code than other previous projects have allowed us.