Yingyang Zhou-Project-07-Curves

Curves

//Yingyang Zhou
//Section A
//yingyanz@andrew.cmu.edu
//Project-07


function setup() {
  createCanvas(480, 480);
}

function draw() {
  background(250);
  drawAstroid();
  drawEpispiral();
  drawRadialCurve();
  frameRate(20);

function drawAstroid(){
  push();
  translate(width/2, height/2);
  var a = 200;
  var b = 200;
  for(r = 0; r < 5; r++){
    rotate(r);
    noFill();
    strokeWeight(0.1);
    var red = map(r, 0, 3.14, 0, 255);
    stroke(red,0,255-red);
    beginShape();
    for (var t = 0; t < mouseX; t++){
      x = a*cos(t)*cos(t)*cos(t);
      y = a*sin(t)*sin(t)*sin(t);
      curveVertex(x + random(0, 1),y + random(0, 1));
    }
    endShape();
  }
  pop();
}
}

function drawEpispiral(){
  push();
  translate(width/2, height/2);
  var a = 60;
  var b = 20;
  var h = constrain(mouseX/2, 0, width/2);
  var r = mouseX/50;
  noFill();
  strokeWeight(0.5);
  stroke("red");
  beginShape();
  for (c = 0; c < 200; c++){
    var t = map(c, 0, 180, 0, TWO_PI);
    x = (a+b)*cos(t)-h*cos(c+t*(a+b)/b);
    y = (a+b)*sin(t)-h*sin(c+t*(a+b)/b);
    curveVertex(x, y);
  }
  endShape();
  pop();
}

function drawRadialCurve(){
  push();
  translate(width/2, height/2);
  beginShape();
  var angle = map(mouseX,0, width, 0, 360);
  rotate(radians(angle));
  var a = 50;
  for (var t = 0; t < 200; t +=2){
    stroke(t, 0, 0);
    strokeWeight(0.5);
    var x = 1/3*a*(2*cos(t)+cos(2*t));
    var y = 1/3*a*(2*sin(t)-sin(2*t));
    curveVertex(x,y);
  }
  endShape();
  pop();

}

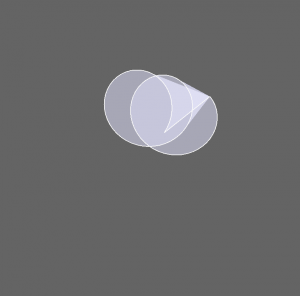
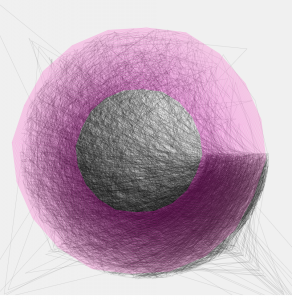
In this project, I start using functions which make the code more readable and easier to revise if needed. I use three types of curves in this project all involving sin and cos but different from each other and have different movement along the changes of mouse position.

Han Yu Project 07 Curves

sketch

// Han Yu
// Section D
// hyu1@andrew.cmu.edu
// Project 07

var nPoints = 200;

function setup() {
    createCanvas(400, 400, WEBGL); // create a 3D canvas
    frameRate(100);
}

function draw() {
    background(100);   
    fill(250); 
    rotateZ(millis() / 8000);
    stroke(250);    
    drawFlower();
}

function drawFlower() {
    // http://mathworld.wolfram.com/Slinky.html   
    var x;
    var y;
    var z;
    // variables inside the formula
    var p = constrain((mouseX / width), 0.0, 400);
    var q = constrain((mouseY / height), 0.0, 400.0);
    
    fill(200, 200, 255, 100.5);
    beginShape();
    stroke(250);
    for (var i = 0; i < nPoints; i++) {
        var t = map(i, 0, nPoints, 0, TWO_PI);
        
        // Flower(slinky):
        x = (PI+100*cos(10*q*t))*cos(t);
        y = (PI+100*cos(10*q*t))*sin(t);
        z = 1/2*p*t + 100*sin(10*p*t);    

        vertex(x, y, z);
    }
    endShape(CLOSE);
}

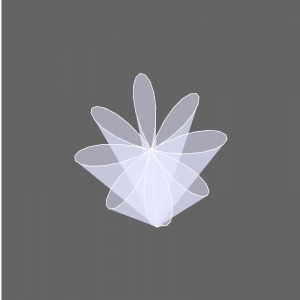
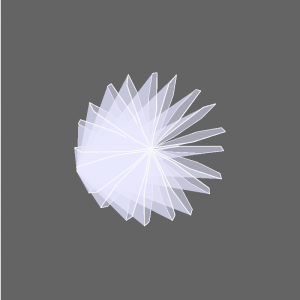
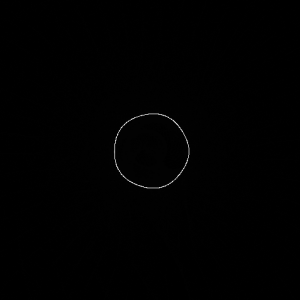
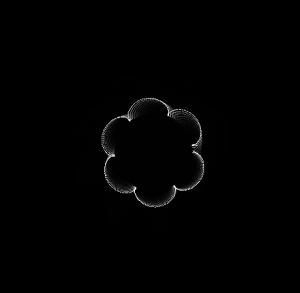
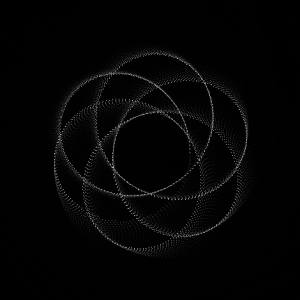
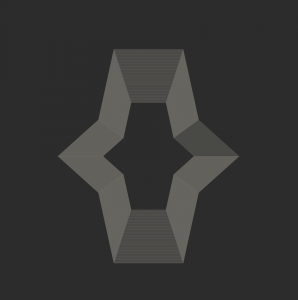
I used a slinky curve for my project. A slinky curve is a space curve which consists of a spiral wound around a helix. I altered it in order to show the formation of a flower. Overall I found this project is helpful with familiar with 3D plane and curves. Below are some screenshots of different stages of my project.

Start stage. Mouse at top left corner.
Flower in formation.
Final stage complex flower. Mouse at bottom right corner.

Jacky’s Project 07

sketch

//Yinjie Tian
//Section B
//yinjiet@andrew.cmu.edu
//Assignment-07-A
function setup() {
    createCanvas(480, 480);
    frameRate(10);
}

function draw() {
    background(0);
    noFill();
    stroke(255, random(150,255), 255)
    var nPoints = 20;
    var radius = width / 2 - mouseX;
    var radius2 = width / 2 - mouseX * random(0.4, 0.9)
    var radius3 = width / 2 - mouseX * random(0.4, 0.9)
    var radius4 = width / 2 - mouseX * random(0.4, 0.9)
    var radius5 = width / 2 - mouseX * random(0.4, 0.9)
    var radius6 = width / 2 - mouseX * random(0.4, 0.9)


    // draw the circle as a wiggly circle
    push();
    
    translate(width / 2, height / 2);
    beginShape();

    for (var a = 0; a < nPoints; a++) { //circle 1
        var theta = map(a, 0, nPoints, 0, TWO_PI);
        var px = radius * cos(theta);
        var py = radius * sin(theta);
        vertex(px + random(-5, 5), py + random(-5, 5));
    }
        noFill();
        stroke(random(150,255), 255, 255)
     for (var b = 0; b < nPoints; b++) {    //circle 2
        var theta = map(b, 0, nPoints, 0, TWO_PI);
        var px = radius2 * cos(theta);
        var py = radius2 * sin(theta);
        vertex(px + random(-5, 5), py + random(-5, 5));
    }
    noFill();
        stroke(random(150,255), random(150,255), random(150,255))
     for (var c = 0; c < nPoints; c++) {    //circle 3
        var theta = map(c, 0, nPoints, 0, TWO_PI);
        var px = radius3 * cos(theta);
        var py = radius3 * sin(theta);
        vertex(px + random(-5, 5), py + random(-5, 5));
    }
     for (var d = 0; d < nPoints; d++) {    //circle 4
        var theta = map(d, 0, nPoints, 0, TWO_PI);
        var px = radius4 * cos(theta);
        var py = radius4 * sin(theta);
        vertex(px + random(-5, 5), py + random(-5, 5));
    }
        noFill();
        stroke(random(150,255), 255, 255)
     for (var e = 0; e < nPoints; e++) {    //circle 5
        var theta = map(e, 0, nPoints, 0, TWO_PI);
        var px = radius5 * cos(theta);
        var py = radius5 * sin(theta);
        vertex(px + random(-5, 5), py + random(-5, 5));
    }
    noFill();
        stroke(random(150,255), random(150,255), random(150,255))
     for (var f = 0; f < nPoints; f++) {    //circle 6
        var theta = map(f, 0, nPoints, 0, TWO_PI);
        var px = radius6 * cos(theta);
        var py = radius6 * sin(theta);
        vertex(px + random(-5, 5), py + random(-5, 5));
    }
    endShape(CLOSE);
    pop();


}

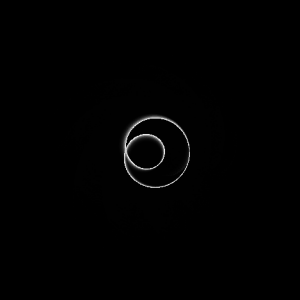
For this project, I first choose the ellipse as the base geometry. Then I use vertex to make each of the ellipse to wiggle. The radius for the ellipse are selected randomly based on the mouseX position. Colors for the curves are also selected randomly.

Justin Yook- Project 07

curves

// Justin Yook
// jyook@andrew.cmu.edu
// Section C
// Project 07

var nPoints = 250; // number of points drawn to create shape

function setup() {
    createCanvas(480, 480);
}

function draw() {
    background(0);
    fill(255);
    text("Modified Quadrifolum", 20, 40);

    // draw the curve
    push();
    translate(width / 2, height / 2);
    drawQuadrifoliumMod();
    pop();
}

function drawQuadrifoliumMod() {
    // http://mathworld.wolfram.com/Quadrifolium.html
    // Polar equation is in form: r = a * sin(2 * theta), but I modified 2 to 6 to create a flower

    var x;
    var y;
    var r;
    var a = constrain(mouseX, 60, 220);

    beginShape();
    for (var i = 0; i < nPoints; i++) {
        var theta = map(i, 0, nPoints, 0, TWO_PI);

        // Modified Quadrifolium
        if (mouseX > width / 2) {
        fill(0, 191, 255);
        r = a * sin(6 * theta);
        x = r * cos(theta);
        y = r * sin(theta);
        vertex(x + random(-2, 2), y + random(-2, 2));
        }

        // Original Quadrifolium
        if (mouseX < width / 2) {
        fill(0, 191, 255);
        r = a * sin(3 * theta);
        x = r * cos(theta);
        y = r * sin(theta);
        vertex(x + random(-2, 2), y + random(-2, 2));
        }
    }
    endShape(CLOSE);
}

In this project, I used modified versions of the quadrifolium to create flower-like shapes. I was inspired by the way fire appears on gas stoves, so I made the shapes jiggle slightly. The parameter that is interactive is the size of the curves, and the number of flower petals. When the mouse moves to the right, more petals show up, and the size increases. When the mouse moves to the left, fewer petals show up, and the size decreases.

Hannah Cai—Project 07—Curves

(click to reset.)

/* Hannah Cai
Section C
hycai@andrew.cmu.edu
Project-07-Curves
*/


var ra = 50; //radius of base circle
var rb = 10; //radius of revolving perimeter circle
var h = 0; //height of curve from the center of rb
var t; //time
var o; //opacity of background
var x;
var y;
var v; //velocity


function setup() {
    createCanvas(480,480);
    background(0);
    stroke(255);
    strokeWeight(1);
    frameRate(30); //.5x animation
}

function draw() {
    o = map(mouseY, 0, height, 100, 25); //maps mouseY to background opacity
    mouseY = constrain(mouseY, 0, height); //constrains mouseY to canvas
    background(0, o);
    v = map(mouseX, 0, width, 1, -1); //maps velocity of ra and h to mouseX 
    ra += v; 
    h += v;

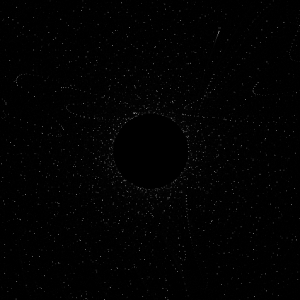
    for (t = 0; t < TWO_PI; t += .01) { 
        push();
        translate(width / 2, height / 2); //moves origin to center
        //epitrochoid equation
        x = (ra + rb) * cos(t) - h * cos(((ra + rb) / rb) * t); 
        y = (ra + rb) * sin(t) - h * sin(((ra + rb) / rb) * t);
        point(x, y); //draws points on the curve
        pop();
    }
}

//resets animation when mouse is clicked
function mouseClicked() {
    ra = 50;
    h = 0;
    t = 0;
}


inverted
starting point
opening
expanding
expanded (mouse in center)
expanded (mouse in bottom left or right)

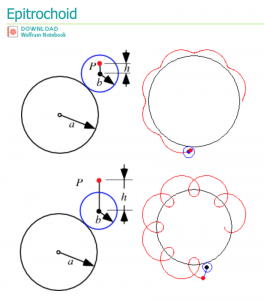
For my project, I chose the epitrochoid:

When writing the code for it, I felt more interested by the particle patterns formed by the curve rather than the curve itself, so I chose to focus on those. While I didn’t enjoy the math involved (there were some really interesting/beautiful curves that I wanted to try creating, but just couldn’t understand), I do think it’s cool that you can basically plug equations straight into code and generate visual effects with them. Overall, I enjoyed the project.

Julie Choi – Project 07 – Curves

jjchoi_curves

// Julie Choi
// jjchoi
// Project 07
// Section E

var nPoints = 360;

function setup() {
    createCanvas(480, 480);
}

function draw() {
	background(230, 171, 130);
	push();
    translate(240, 240);
	drawEightCurve();
    drawCruciform();
	pop(); 
}

function drawEightCurve() { 
	// http://mathworld.wolfram.com/EightCurve.html
    var x;
    var y;
    var a = 300;
    var b = a / 2.0;
    var p = constrain(mouseY, 0, 480);
    var q = mouseX / 400;
    stroke(148, 79, 81);

    //create for loop to create eight curves in different sizes
    for(var r = 0; r < 1; r+=0.1){
    	// use push pop to rotate the forms with mouse location
        push();
        rotate(map(p, 0, 480, 0, 2 * PI));
        beginShape();
        noFill();
        // make the lines jitter by adding random function
        for (var i = 0; i < nPoints; i++) {
            var t = map(i, 0, nPoints, 0, PI * 2);
            x = a * sin(t) * (q + r) + random(-1, 1);
            y = a * sin(t) * cos(t) * (q + r) + random(-1, 1);
            vertex(x, y);
        }
        endShape(CLOSE);
        pop();
    }
}

function drawCruciform() { 
	// http://mathworld.wolfram.com/Cruciform.html
    var x2;
    var y2;
    var a2 = 300;
    var b2 = a2 / 2.0;
    var p2 = constrain(mouseY, 0, 480);
    var q2 = mouseX / 400;
    stroke(255);

    //create for loop to create cruciforms in different sizes
    for(var j = 0; j < 1; j+=0.1){
    	// use push pop to rotate the forms with mouse location
        push();
        rotate(/*map(p2, 0, 480, 0, 2 * */PI);
        beginShape();
        noFill();
        // make the lines jitter by adding random function
        for (var i = 0; i < nPoints; i++) {
            var t2 = map(i, 0, nPoints, 0, PI * 2);
            x2 = a2 * (1/(cos(t2)) * (q2 + j) + random(-0.5, 0.5));
            y2 = a2 * (1/(sin(t2)) * cos(t2) * (q2 + j) + random(-0.5, 0.5));
            vertex(x2, y2);
        }
        endShape(CLOSE);
        pop();
    }
}

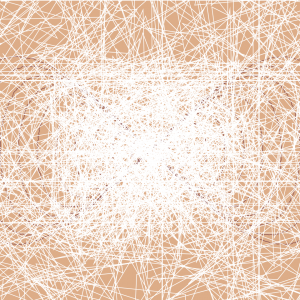
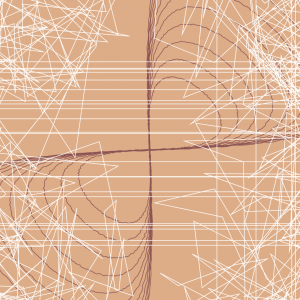
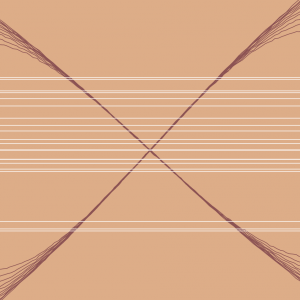
Approaching this project was challenging than I thought because it incorporated different sources of information from a website. However, I learned how to use it to my advantage to create this chaotic curve pattern. My initial idea was to put two different types of curves: eight curves and cruciform. I got the eight curves to jitter and move based on the mouse, but for the cruciforms, I ended up jittering throughout the whole canvas creating a spiderweb-like visual. This was not my initial idea, but just playing around with the different variables and adding it to the formulas provided in the website helped me explore all the different variations of the lines. Down here are the steps of how my curves transform:

Dani Delgado Project 07 – Curves

sketch

var nPoints = 100;

function setup() {
    createCanvas(480, 480);
      
}

function draw() {
	background(60);
	
	//in this for loop, we draw the bakcground element of the randomized curve
    push();
	translate(width / 2, height / 2);
	for (r = 0; r < nPoints; r ++) {
		stroke(200);
		drawRandomDevil(r);
	}
	pop();
    
    //in this loop, we draw the primary forground element 
    //which is the center devil's curve
	push();
	translate(width / 2, height / 2);
	rotate(mouseX / mouseY);
    for (v = 0; v < nPoints; v ++) {
    	stroke(mouseX - 200, v, mouseY - 300);
    	drawDevilBoi(v); 
    }
	pop();  
    
    //this loop is to create the six rotating deveil's vurves
    for ( c = 0; c < 6; c ++) {
    	push();
    	translate(width / 2, height / 2);
    	rotate(radians(60 * c));
	    translate(width / 4, height / 4);
	    rotate(mouseX / mouseY);
            for (v = 0; v < nPoints; v ++) {
    	    stroke(mouseX - 100, v, mouseY - 100);
    	    drawDevilBoi(v); 
         }
	    pop();
    }
}


function drawDevilBoi (x) {
    //draw the devil's curve in this function 
    //first declare all the variables 
    var x;
    var y; 

    var c = constrain((mouseX / width), 0, 1);
    var co = constrain((mouseY / height), 0.0, 1.0);

    var a = c * ((mouseX - 200) / 3 * (100 + v) / 100);
    var b = co * ((mouseY - 200) / 3 * (100 + v) / 100);

    //set desire stroke
    noFill();
    strokeWeight(0.25); 
    //draw the curve
    beginShape();
    for (var i = 0; i < nPoints; i += 5) {
    	var t = map(i, 0, nPoints, 0, TWO_PI); 
    	x = cos(t) * sqrt ((pow(a, 2) * pow(sin(t), 2) - pow(b, 2) * pow(cos(t), 2)) / (pow(sin(t), 2) - pow(cos(t), 2)));
    	y = sin(t) * sqrt ((pow(a, 2) * pow(sin(t), 2) - pow(b, 2) * pow(cos(t), 2)) / (pow(sin(t), 2) - pow(cos(t), 2)));
    	vertex(x, y + 10);
    }
    endShape(CLOSE); 
}

function drawRandomDevil (x) {
	//draw another devil's curve, this time there is an element of randomness with it

	var x;
    var y; 

    var c = constrain((mouseX / width), 0, 1);
    var co = constrain((mouseY / height), 0.0, 1.0);

    var a = c * ((mouseX - 200) / 3 * (100 + r) / 100);
    var b = co * ((mouseY - 200) / 3 * (100 + r) / 100);
   
    //set the desired stroke 
    noFill();
    strokeWeight(0.075); 
    //start to draw the curve
    //this curve will be in the background and looks like noise
    beginShape();
    for (var i = 0; i < nPoints; i += 7) {
    	var t = map(i, 0, nPoints, 0, random(radians(350, 360))); 
    	x = cos(t) * sqrt ((pow(a, 2) * pow(sin(t), 2) - pow(b, 2) * pow(cos(t), 2)) / (pow(sin(t), 2) - pow(cos(t), 2)));
    	y = sin(t) * sqrt ((pow(a, 2) * pow(sin(t), 2) - pow(b, 2) * pow(cos(t), 2)) / (pow(sin(t), 2) - pow(cos(t), 2)));
    	vertex(x, y + 10);
    }
    endShape(CLOSE); 
}

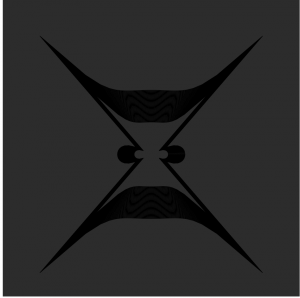
This project was a bit of a mixed bag for me, as I did struggle to implement the curve into my work at first and make it appear in a way that I wanted it to. (Also choosing the curve I wanted to pursue took me a while, but I ultimately settled on The Devil’s Curve because I thought that it’s shape was very unique and could produce some nice variation). However, once I figured that out and began to play around I really enjoyed myself. I never really knew what changing the variables would make my code look like, so it was an exciting process of trial and error to create a nice form.

The initial Devil’s Curve
Exploring withe the for loop functions and variables of the curve
First noise and expanding loop idea
first try at repeating the curve and changing the color

Yiran Xuan – Project 07 – Curves

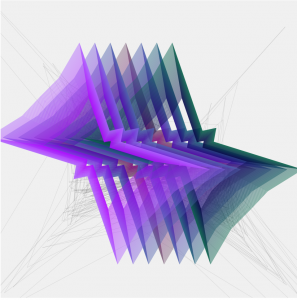
The idea behind this project was to implement an “unfolding” of the involute from the surface of the circle, similar to an Asian fan or a wing. A little struggle was had in keeping track of the angle variables, whether they represented angles themselves or just the increments (out of 24).

The mouse in the horizontal direction controls the unfolding, while in the vertical the rotation of the whole drawing is affected.

sketch

//Objective: draw circle involute
//mouse control: y controls the amount of "wrapping"
//mouse control: x controls initial angle

var wrap = 0; //determines how far the involute extends out
var initangle = 0;

var increment = 12;
var radius = 25;

function setup() {
    createCanvas(480, 480);
    angleMode(RADIANS);
}

function draw() {
	translate(width/2, height/2); //shifting coordinates to the center

	rotate(constrain(mouseY, 0, 480)/240*PI); //rotation

    background('white');

	wrap = 24 - constrain(mouseX, 0, 480)/20; //number of increments to go around circle

	noFill();
	strokeWeight(3);
	stroke('orange');
	ellipse(0, 0, radius*2, radius*2); //drawing center circle

	var accumulatedincrement = 0;

	for(var i = 0; i <= wrap; i++){
		stroke('cyan');

		var currentangle = accumulatedincrement/increment*PI;
		var x1 = radius*(cos(currentangle) + currentangle*sin(currentangle)) //determining fan section start point
		var y1 = radius*(sin(currentangle) - currentangle*cos(currentangle));

		accumulatedincrement++;
		
		var nextangle = accumulatedincrement/increment*PI;
		var x2 = radius*(cos(nextangle) + nextangle*sin(nextangle)); //determining fan section end point
		var y2 = radius*(sin(nextangle) - nextangle*cos(nextangle));

		triangle(x1, y1, x2, y2, 0, 0); //drawing triangle

		stroke('red');
		line(x1, y1, radius*cos(nextangle), radius*sin(nextangle)); //drawing lines to display tangency
	}

}

Jonathan Liang – Project 7 – Curves

sketch

//Jonathan Liang
//jliang2
//Section A

function setup() {
    createCanvas(600, 600);
    frameRate(10);
  
}

function draw() {
	background(0);
	push();
	translate(300,300);
	rotate(sin(mouseX));
	drawKevin();
	pop();

	push();
	translate(300,300);
	rotate(-sin(mouseX));
	drawStanley();
	pop();
}

function drawKevin() {
    var kPoints = map(mouseX, 0, height, 0 , 500);
    var x;
    var y;
    var tj = map(mouseX, 0, width,0,8); // for iterations
    beginShape();
    for (var i=0; i < kPoints; i++){ 
        var t = map(i,0,kPoints,0,TWO_PI*tj);
        noFill();
        var colR = map(mouseX, 0, width, 0, 255);
        var colG = map(mouseY, 0, width, 0, 255);
        var colB = map(mouseX, 0, width, 0, 255);
        strokeWeight(.5);
        stroke(colR, colG, colB); // 
        //equations as listed on mathworld.wolfram.com/ButterflyCurve.html
        x = Math.sin(t) * (Math.pow(Math.E,Math.cos(t))
                        - 2*Math.cos(4*t) 
                        + Math.pow(Math.sin(t/12),5));

        y = Math.cos(t) * (Math.pow(Math.E,Math.cos(t))
                        - 2*Math.cos(4*t) 
                        + Math.pow(Math.sin(t/12),5));

        vertex(i*x,i*y);
    }
    endShape(CLOSE);  
}

function drawStanley() {
    var sPoints = map(mouseX, 0, height, 0 , 500);
    var x;
    var y;
    var tj = map(mouseX, 0, width,0,8); 

    beginShape();
 
    for (var i=0; i < sPoints; i++){ 
        var t = map(i,0,sPoints,0,TWO_PI*tj);
        noFill();
        var colR = map(mouseX, 0, width, 255, 0);
        var colG = map(mouseY, 0, width, 255, 0);
        var colB = map(mouseX, 0, width, 255, 0);
        strokeWeight(0.5);

        stroke(colR, colG, colB); // 
        //equations as listed on mathworld.wolfram.com/ButterflyCurve.html
        x = Math.sin(t) * (Math.pow(Math.E,Math.cos(t))
                        - 2*Math.cos(4*t) 
                        + Math.pow(Math.sin(t/12),5));

        y = Math.cos(t) * (Math.pow(Math.E,Math.cos(t))
                        - 2*Math.cos(4*t) 
                        + Math.pow(Math.sin(t/12),5));

        vertex(i*x,i*y);
    }
    endShape(CLOSE);  
}

I see the butterfly curve more like a ripple or a flower, growing over time. Just a flower blooms, butterflies blossom from little caterpillars to marvelous winged insects. However, as one butterfly blossoms, one must leave; which is why I made one fade away as the other became more prominent. The color becomes the most vibrant at the top right, symbolizing the butterfly’s prime, while the faded bottom right corner symbolizes its passing.

Anthony Ra – Project 07 – Curves

sketch

/* Anthony Ra
Section-A
ahra@andrew.cmu.edu
Project-07 */

function setup() {
    createCanvas(480, 480);
    frameRate(100);
}

function draw() {
    background(255);

/* mapping the colors so that it changes based on mouseX */
    var r = map(mouseX, 0, width, 140, 180);
    var g = map(mouseX, 0, width, 160, 190);

/* printing hypotrochoid */
    push();
    stroke(r, g, 255);
    strokeWeight(0.25);
    translate(width/2, height/2);
    drawHypotrochoid();
    pop();
}

function drawHypotrochoid() {
/* naming variables */
    var hypoX;
    var hypoY;
/* radius of hypotrochoid */
    var hypoRadius = 240;
/* hypotrochoid alteration with cursor */
    var a = map(mouseX, 0, width, 0, 5);
    var b = map(mouseY, 0, height, 0, 3);
    beginShape();
      for(var i = 0; i < 300; i ++) {
        var angle = map(i, 0, 200, 0, 360);
/* equation of hypotrochoid from the link */
        hypoX = (a - b) * cos(angle) + hypoRadius * cos((a - b) * angle);
        hypoY = (a - b) * sin(angle) - hypoRadius * sin((a - b) * angle);
        vertex(hypoX, hypoY);
      }
    endShape();
}

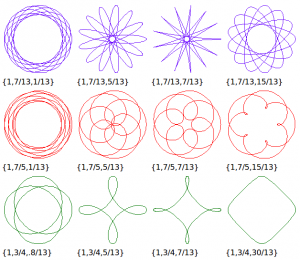
hypotrochoid chart

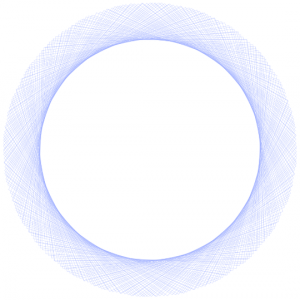
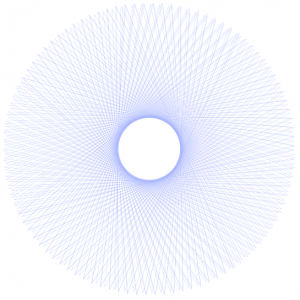
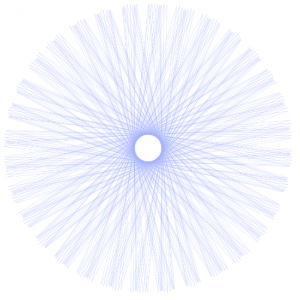
Thinking about the project that we did a couple weeks ago on string art, I focused on curves that bring lightness, tranquility, and balance in regards to symmetry and motion. The purpose of picking a hypotrochoid is the many ways in which the control points of each line or curve responds differently but respects the symmetry in balance.

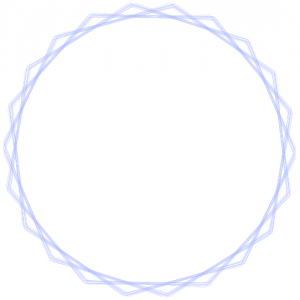
variation with the largest radius

Looking back at the hypotrochoid chart, that moment of the cursor provides the twelfth iteration, producing a modular set of filleted triangular curves.

second variation
a similar variation to the above one