/* Hannah Cai
Section C
hycai@andrew.cmu.edu
Project-07-Curves
*/


var ra = 50; //radius of base circle
var rb = 10; //radius of revolving perimeter circle
var h = 0; //height of curve from the center of rb
var t; //time
var o; //opacity of background
var x;
var y;
var v; //velocity


function setup() {
    createCanvas(480,480);
    background(0);
    stroke(255);
    strokeWeight(1);
    frameRate(30); //.5x animation
}

function draw() {
    o = map(mouseY, 0, height, 100, 25); //maps mouseY to background opacity
    mouseY = constrain(mouseY, 0, height); //constrains mouseY to canvas
    background(0, o);
    v = map(mouseX, 0, width, 1, -1); //maps velocity of ra and h to mouseX
    ra += v;
    h += v;

    for (t = 0; t < TWO_PI; t += .01) {
        push();
        translate(width / 2, height / 2); //moves origin to center
        //epitrochoid equation
        x = (ra + rb) * cos(t) - h * cos(((ra + rb) / rb) * t);
        y = (ra + rb) * sin(t) - h * sin(((ra + rb) / rb) * t);
        point(x, y); //draws points on the curve
        pop();
    }
}

//resets animation when mouse is clicked
function mouseClicked() {
    ra = 50;
    h = 0;
    t = 0;
}
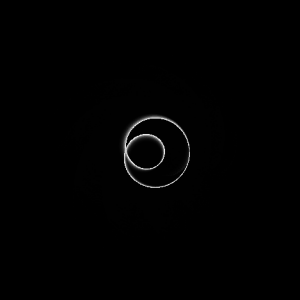
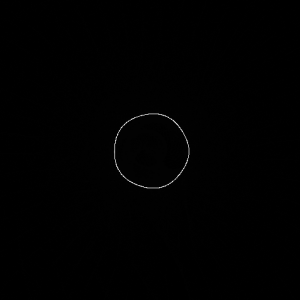
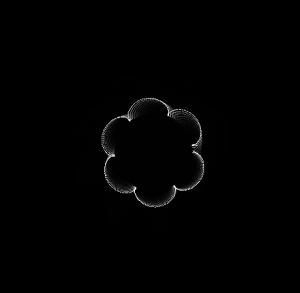
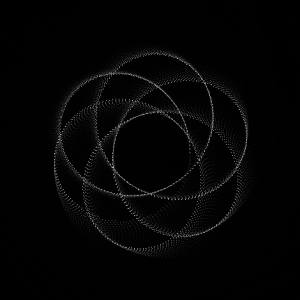
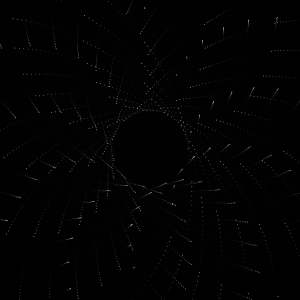
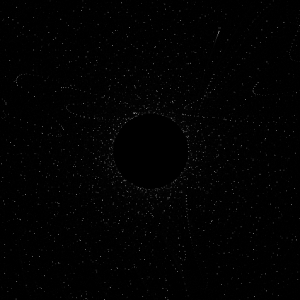
For my project, I chose the epitrochoid: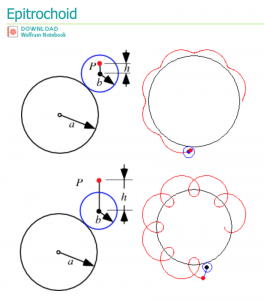
When writing the code for it, I felt more interested by the particle patterns formed by the curve rather than the curve itself, so I chose to focus on those. While I didn’t enjoy the math involved (there were some really interesting/beautiful curves that I wanted to try creating, but just couldn’t understand), I do think it’s cool that you can basically plug equations straight into code and generate visual effects with them. Overall, I enjoyed the project.
![[OLD FALL 2018] 15-104 • Introduction to Computing for Creative Practice](wp-content/uploads/2020/08/stop-banner.png)