![[OLD FALL 2018] 15-104 • Introduction to Computing for Creative Practice](https://courses.ideate.cmu.edu/15-104/f2018/wp-content/uploads/2020/08/stop-banner.png)
// Julie Choi
// jjchoi
// Project 07
// Section E
var nPoints = 360;
function setup() {
createCanvas(480, 480);
}
function draw() {
background(230, 171, 130);
push();
translate(240, 240);
drawEightCurve();
drawCruciform();
pop();
}
function drawEightCurve() {
// http://mathworld.wolfram.com/EightCurve.html
var x;
var y;
var a = 300;
var b = a / 2.0;
var p = constrain(mouseY, 0, 480);
var q = mouseX / 400;
stroke(148, 79, 81);
//create for loop to create eight curves in different sizes
for(var r = 0; r < 1; r+=0.1){
// use push pop to rotate the forms with mouse location
push();
rotate(map(p, 0, 480, 0, 2 * PI));
beginShape();
noFill();
// make the lines jitter by adding random function
for (var i = 0; i < nPoints; i++) {
var t = map(i, 0, nPoints, 0, PI * 2);
x = a * sin(t) * (q + r) + random(-1, 1);
y = a * sin(t) * cos(t) * (q + r) + random(-1, 1);
vertex(x, y);
}
endShape(CLOSE);
pop();
}
}
function drawCruciform() {
// http://mathworld.wolfram.com/Cruciform.html
var x2;
var y2;
var a2 = 300;
var b2 = a2 / 2.0;
var p2 = constrain(mouseY, 0, 480);
var q2 = mouseX / 400;
stroke(255);
//create for loop to create cruciforms in different sizes
for(var j = 0; j < 1; j+=0.1){
// use push pop to rotate the forms with mouse location
push();
rotate(/*map(p2, 0, 480, 0, 2 * */PI);
beginShape();
noFill();
// make the lines jitter by adding random function
for (var i = 0; i < nPoints; i++) {
var t2 = map(i, 0, nPoints, 0, PI * 2);
x2 = a2 * (1/(cos(t2)) * (q2 + j) + random(-0.5, 0.5));
y2 = a2 * (1/(sin(t2)) * cos(t2) * (q2 + j) + random(-0.5, 0.5));
vertex(x2, y2);
}
endShape(CLOSE);
pop();
}
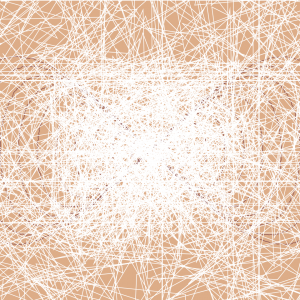
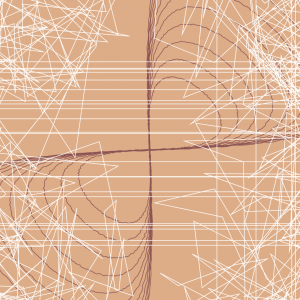
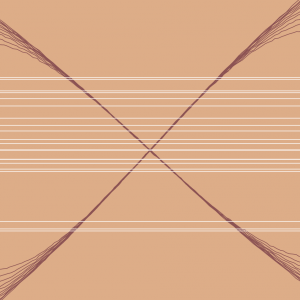
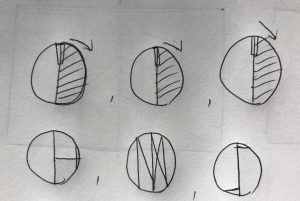
}Approaching this project was challenging than I thought because it incorporated different sources of information from a website. However, I learned how to use it to my advantage to create this chaotic curve pattern. My initial idea was to put two different types of curves: eight curves and cruciform. I got the eight curves to jitter and move based on the mouse, but for the cruciforms, I ended up jittering throughout the whole canvas creating a spiderweb-like visual. This was not my initial idea, but just playing around with the different variables and adding it to the formulas provided in the website helped me explore all the different variations of the lines. Down here are the steps of how my curves transform: