![[OLD FALL 2019] 15-104 • Introduction to Computing for Creative Practice](https://courses.ideate.cmu.edu/15-104/f2019/wp-content/uploads/2020/08/stop-banner.png)
//Jasmine Lee
//jasmine4@andrew.cmu.edu
//Section C
//Project-07 (Composition with Curves)
var points = 100; //helps control length of curves
var turn = 0; //controls speed of rotation
function setup() {
createCanvas(480, 480);
}
function draw() {
background(20, mouseX / 3, 20);
//"normal" speed curves
push();
translate(width / 2, height / 2);
rotate(radians(turn));
turn ++;
drawEpi();
drawEpi2();
drawEpi3();
pop();
//slowest set of curves
push();
translate(width / 2, height / 2);
rotate(radians(turn / 2));
turn ++;
drawEpi();
drawEpi2();
drawEpi3();
pop();
//fastest spinning set of curves
push();
translate(width / 2, height / 2);
rotate(radians(turn * 2));
turn ++;
drawEpi();
drawEpi2();
drawEpi3();
pop();
//faster spinning set of curves
push();
translate(width / 2, height / 2);
rotate(radians(turn * 1.5));
turn ++;
drawEpi();
drawEpi2();
drawEpi3();
pop();
//creates center of flower
noStroke();
fill(255, 255, 255, 50);
ellipse(width / 2, height / 2, mouseX / 2.5, mouseX / 2.5);
fill(255, 255, 255, 50);
ellipse(width / 2, height / 2, mouseX / 4, mouseX / 4);
fill(255, 255, 255, 50);
ellipse(width / 2, height / 2, mouseX / 5, mouseX / 5);
}
//draws the smaller epicycloid curve
function drawEpi() {
var a = map(mouseX, 0, width, 10, 100);
var b = a / 2;
//curves
strokeWeight(3);
stroke(mouseX / 2, 30, mouseY / 2);
noFill();
beginShape();
for (var i = 0; i < points; i ++) {
var t = map(i, 0, 50, 0, TWO_PI);
crvX = ((a + b) * cos(t)) - (b * cos(((a + b) / b) * t))
crvY = ((a + b) * sin(t)) - (b * sin(((a + b) / b) * t))
curveVertex(crvX, crvY);
}
endShape();
}
//draws the medium epicycloid shape (filled-in)
function drawEpi2() {
var a = map(mouseX, 0, width, 10, 300);
var b = a / 2;
//curves
fill(mouseY / 2, 50, mouseX / 2, 100);
beginShape();
for (var i = 0; i < points; i ++) {
var t = map(i, 0, 50, 0, TWO_PI);
crvX = ((a + b) * cos(t)) - (b * cos(((a + b) / b) * t))
crvY = ((a + b) * sin(t)) - (b * sin(((a + b) / b) * t))
curveVertex(crvX, crvY);
}
endShape();
}
//draws the biggest epicycloid curves
function drawEpi3() {
var a = map(mouseX, 0, width, 60, 400);
var b = a / 2;
//curves
stroke(mouseY / 2, 60, mouseX / 2);
noFill();
beginShape();
for (var i = 0; i < points; i ++) {
var t = map(i, 0, 50, 0, TWO_PI);
crvX = ((a + b) * cos(t)) - (b * cos(((a + b) / b) * t))
crvY = ((a + b) * sin(t)) - (b * sin(((a + b) / b) * t))
curveVertex(crvX, crvY);
}
endShape();
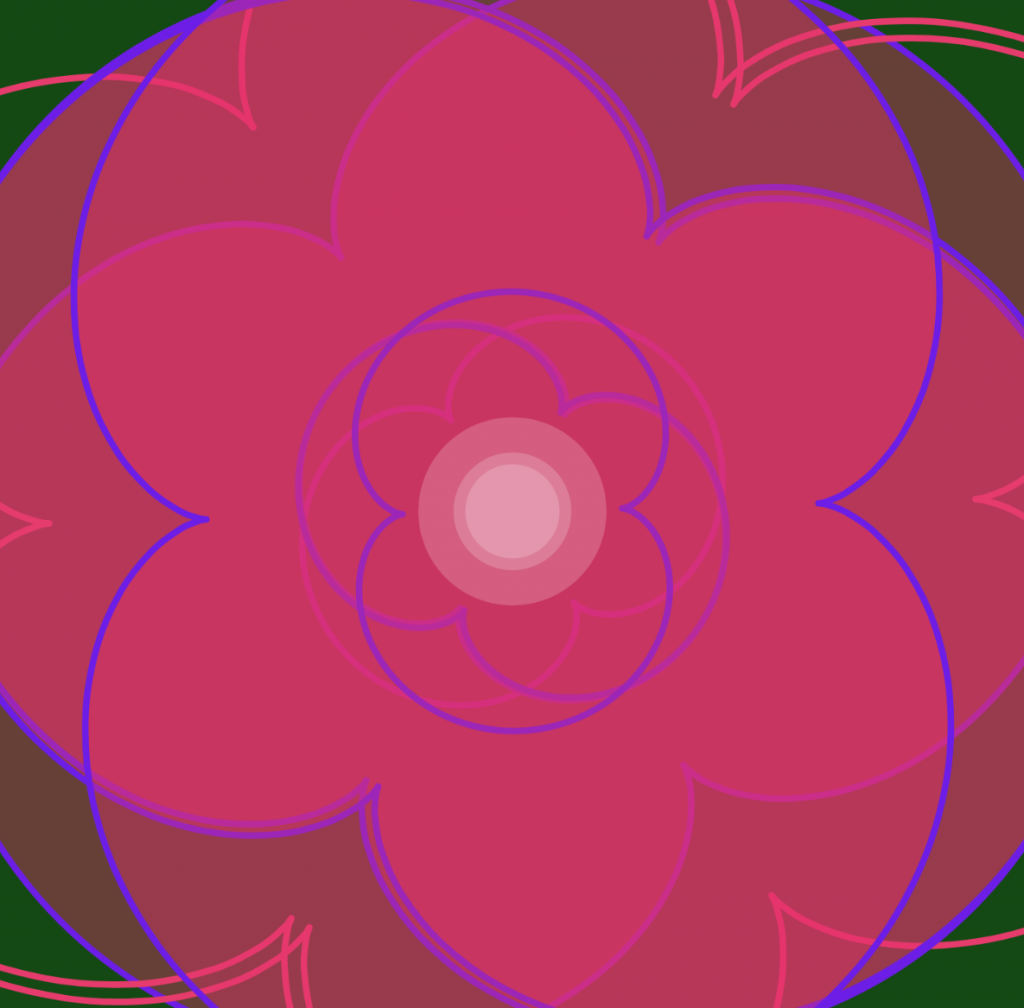
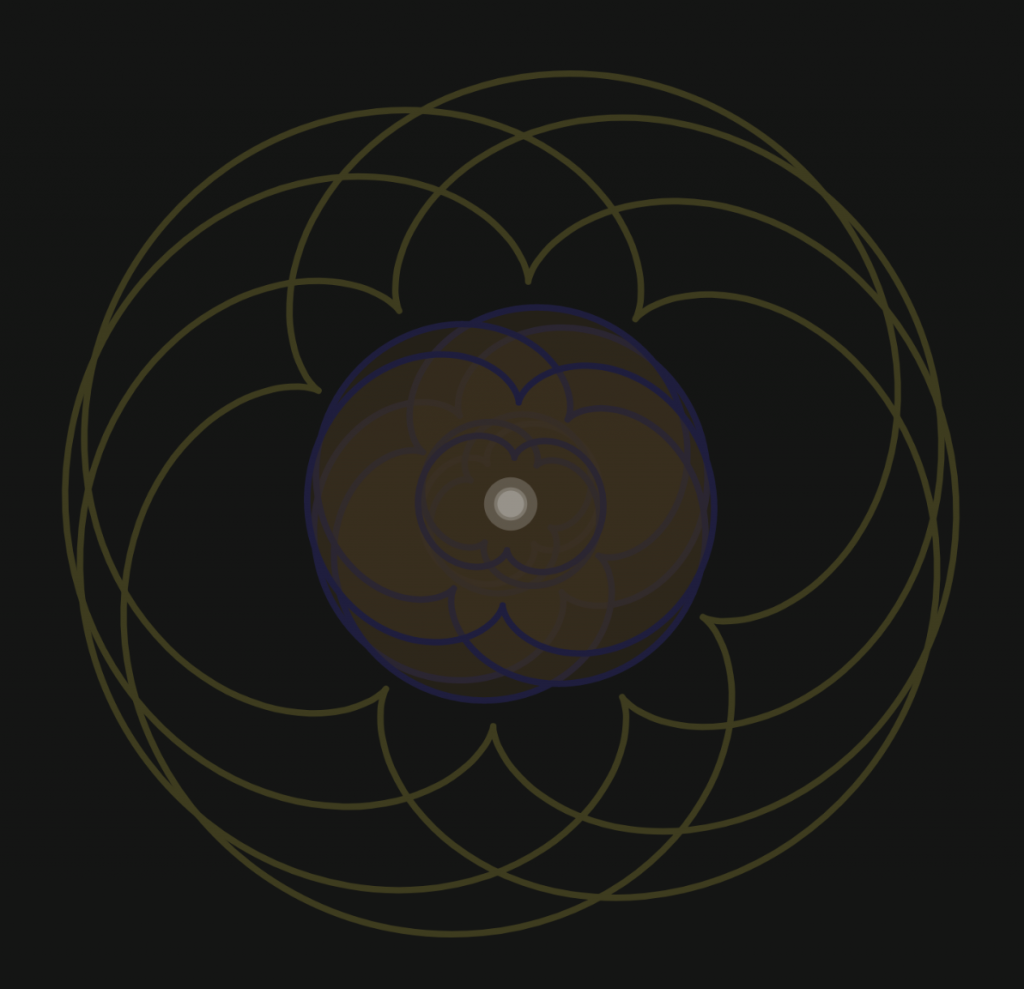
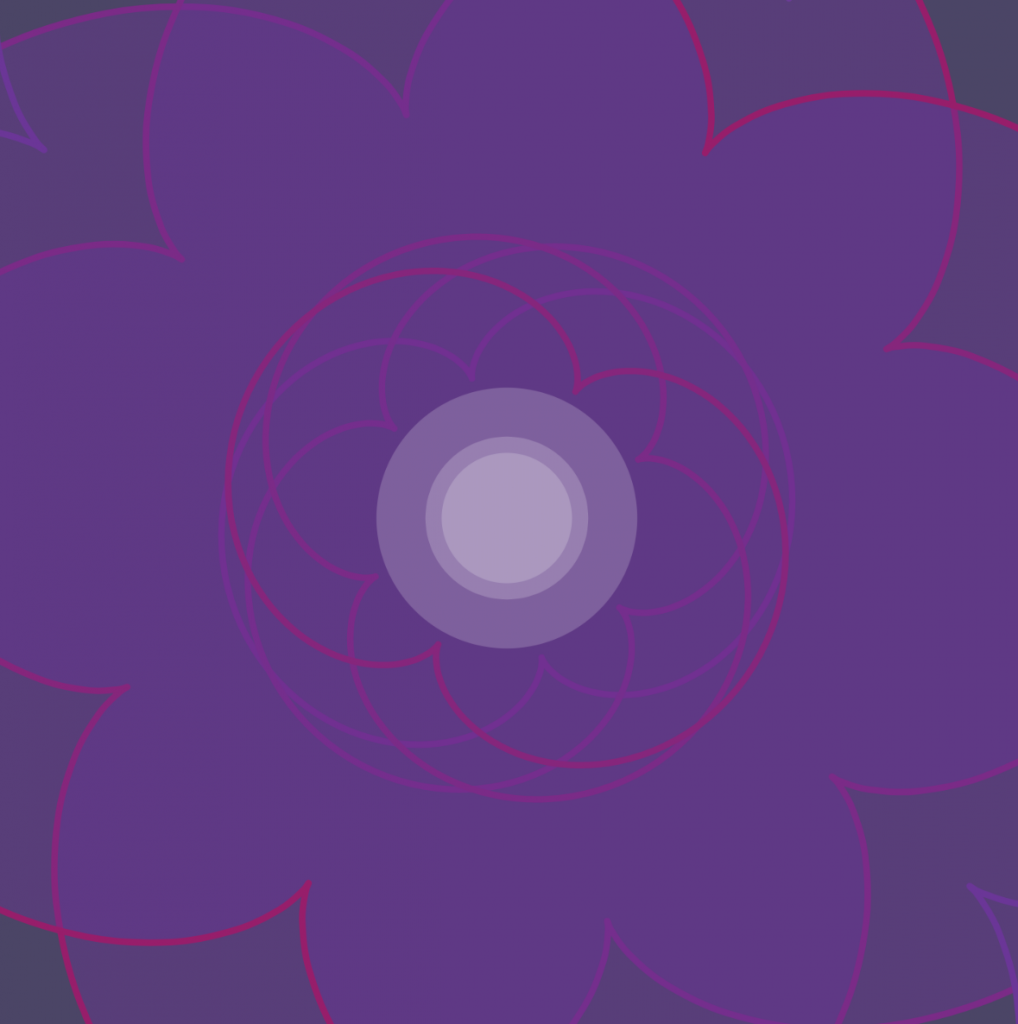
}The trickiest part of doing this project was figuring how to create the curves using the mathematical formulas. I had to carefully study the formula to understand it. For this project, I was inspired by the Camellia flowers, which has petals that look as if they’re rotating around the center. It was interesting to be able to see the different curves and colors generated by the movement of the mouse.