![[OLD FALL 2019] 15-104 • Introduction to Computing for Creative Practice](https://courses.ideate.cmu.edu/15-104/f2019/wp-content/uploads/2020/08/stop-banner.png)
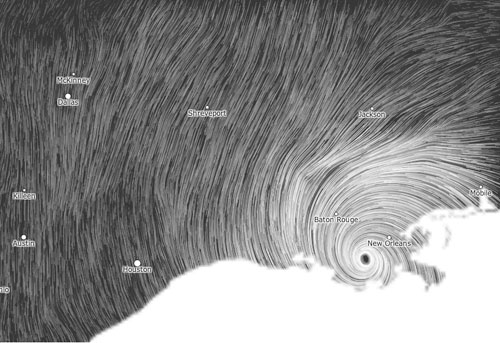
I am reflecting on Crystal Xue’s study of a wind map created by collaborators Martin Wattenberg and Fernanda Veigas from Looking Outwards-07. The collaborators both co-lead Google’s PAIR initiative and specialize in information visualization, which is highly evident in their work. Their wind map generates delicate strokes of wind across a flattened map of the U.S., informing the direction and intensity of wind; the map updates every hour and even allows users to zoom in, allowing the wind to describe smaller locations more easily.
As Crystal mentioned, the map visualizes complex information in a simplistic and legible manner, giving a wide spectrum of users with different interests useful information. Wattenberg explained, “Bird watchers have tracked migration patterns, bicyclists have planned their trips and conspiracy theorists use it to track mysterious chemicals in the air.”
While the map is highly informative and demonstrates several layers of information through lines, I appreciate its ability to also act as a purely artistic piece. The changes in wind patterns and stroke thickness have the ability to evoke different emotions, which in many ways directly correlate with the weather experienced during that hour and in certain locations.