Fallon Creech-LookingOutwards-10

Video demonstrating interactions with iPad set-up

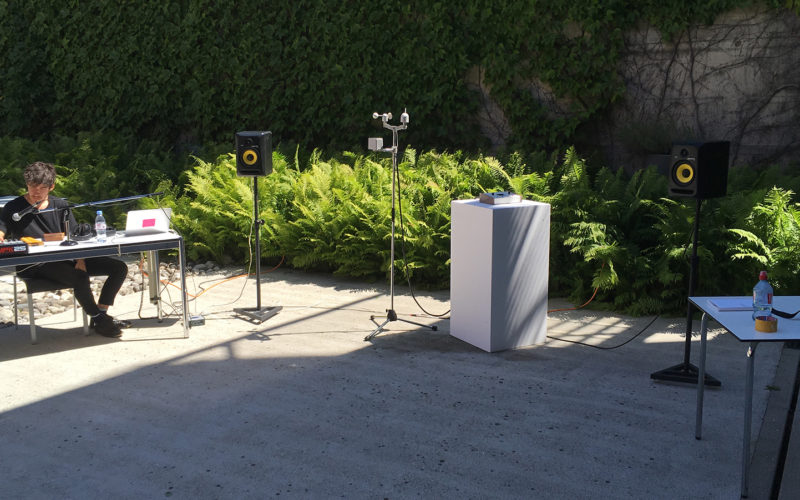
Prelude in ACGT, a project created by Pierry Jacquillard at Ecole cantonale d’art de Lausanne’s Media and Interaction Design Unit, explores the literal relationship between the biology and music using the creator’s own DNA. The tools extract Jacquillard’s DNA and convert it into music.

Throughout Jacquillard’s studies, he has always been profoundly captivated by the connections made between highly organic structures and artificial structures brought to life through man; his interest lies in the contrasting nature of the two opposing ends of the spectrum, which he believes to provide means of creating long-lasting interpretations of the product. He explains, “This Prelude is important for me, as the technological advances are taking any data (including music) and turn them into DNA in order to save them for almost eternity as they promise. But for me, the most important is more the interpretation of a code rather than the materialism of the code itself. I think that maybe we are just generating data that will last centuries but the key to retrieve them won’t. They could be a kind of post-digital hieroglyphs.”

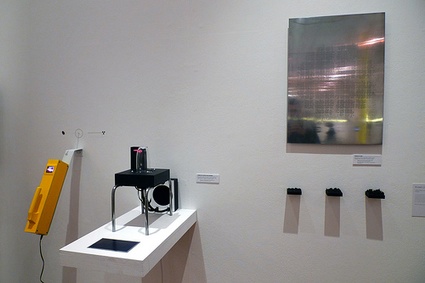
This project relies on five interfaces that ignite the interaction between biology and music, change sound qualities, and visualize the individual components. The visualizations are demonstrated through different web applications on iPads. I appreciate the comprehensive process of his using only Javascript to interpret and convert the data into statement graphics.

Fallon Creech-Project-09-Portrait

sketch

//Fallon Creech
//Section B
//fcreech@andrew.cmu.edu
//Project-09

var underlyingImage;

function preload() {
    var myImageURL = "https://i.imgur.com/nmxNHkl.jpg?1";
    underlyingImage = loadImage(myImageURL);
}

function setup() {
    createCanvas(500, 500);
    background(0);
    underlyingImage.loadPixels();
    frameRate(10);
}

function draw() {
    var px = random(width);
    var py = random(height);
    var ix = constrain(floor(px), 0, width-1);
    var iy = constrain(floor(py), 0, height-1);
    var theColorAtLocationXY = underlyingImage.get(ix, iy);

    noStroke();
    fill(theColorAtLocationXY);
    textStyle(NORMAL);
    textSize(random(15, 25));
    text("sketch", px, py);

    var theColorAtTheMouse = underlyingImage.get(mouseX, mouseY);
    stroke(theColorAtTheMouse);
    textStyle(BOLDITALIC);
    textSize(random(25, 35));
    text("doodle", pmouseX, pmouseY);
}

For this project, I used a picture of a friend sketching in her sketchbook. I decided to differentiate between interactions of the animation by using different text styles and words; the animation randomly generates the word “sketch,” but the word “doodle” appears at the mouse’s location, giving the animation some visual complexity. 

after 30 seconds
after 2 minutes
original image

Fallon Creech-LookingOutwards-09

Video demonstrating the wind map’s abilities, including examples of updates every hour

I am reflecting on Crystal Xue’s study of a wind map created by collaborators Martin Wattenberg and Fernanda Veigas from Looking Outwards-07. The collaborators both co-lead Google’s PAIR initiative and specialize in information visualization, which is highly evident in their work. Their wind map generates delicate strokes of wind across a flattened map of the U.S., informing the direction and intensity of wind; the map updates every hour and even allows users to zoom in, allowing the wind to describe smaller locations more easily.

As Crystal mentioned, the map visualizes complex information in a simplistic and legible manner, giving a wide spectrum of users with different interests useful information. Wattenberg explained, “Bird watchers have tracked migration patterns, bicyclists have planned their trips and conspiracy theorists use it to track mysterious chemicals in the air.”

While the map is highly informative and demonstrates several layers of information through lines, I appreciate its ability to also act as a purely artistic piece. The changes in wind patterns and stroke thickness have the ability to evoke different emotions, which in many ways directly correlate with the weather experienced during that hour and in certain locations.

Snapshot of wind map in zoomed-in location, demonstrating wind patterns at a point in time

Fallon Creech-LookingOutwards-08

Eva Franch i Gilabert’s lecture at Eyeo Festival

Eva Franch, currently based in New York and serves as director of StoreFront for Art and Architecture, is a Spanish architect who excels in experimental architectural and art forms. Her work addresses the need for change in cultural, political, social, and technological realms through “architectural doubts.” She categorizes these doubts into three fields. “Utopias” target a range of historical and political doubts; “metaphors” target a range of cognitive and formal doubts; and atmospheres target primarily experiential doubts within architecture.

Franch’s work aims to showcase the untruths of perceivably utopic realms through highly experimental forms and publications. Her work is admirable because she uses her categorical doubts to juxtapose one another, highlighting flaws and factors that typically remain unnoticed within urban fabrics. She uses a wide range of material and media to demonstrate these “architectural doubts,” including clothing and newspaper clippings, suggesting that architecture is highly dependant on various contextual factors.


Link to Franch’s website: http://eva-franch.com/

Fallon Creech-LookingOutwards-07

Video portrays the public art piece in the context of its place (Calgary, Alberta)

Twenty-two thousand years ago, the Bow Glacier slowly carved its way east from the Rocky Mountains, briefly sculpting the land on which the city of Calgary sits upon today. Today, the glacier melts into Bow Pond before finding its way to Bow Lake, leaving waterfalls at many of these intersections. Drinking water in Calgary commonly originates from the melted ice of the glacier, so the glacier quite literally resides in the residents of the city.

Collaborators Ben Rubin, Shah Selbe, and Dr. Jeffrey Kavanuagh curated a data visualization of the interrelationship between the Bow Glacier’s everchanging physical transformations and human activity in Calgary. The visualization connects the urban fabric with nature, suggesting that humans are never actually without it. 

To visually represent the “heartbeat” of the glacier, the collaborators wrote programs that produced a cardiotocograph, turning live seismic feed recorded at the glacier into crisp lines against a white background. 

This public piece is compelling because it demonstrates the record of data in a style that appears much less crisp and neat than is typically in data visualizations; it aims to suggest a correlation.

Fallon Creech-Project-06-Abstract-Clock


sketch

//Fallon Creech
//Section B
//fcreech@andrew.cmu.edu
//Project-06

var xarc = 200
var yarc = 200
var center = 200

function setup() {
  createCanvas(400, 400);
}

function draw() {
  background(77);
	noStroke();

//beginning of red hours circle
	fill(77);
  ellipse(center, center, 300, 300);
  fill(241, 106, 111);
  arc(xarc, yarc, 300, 300, 1.5*PI, ((hour()%24)/12*PI-HALF_PI+0.0001));

//end of red hours circle
  fill(77);
  ellipse(center, center, 225, 225);

//beginning of green minutes circle
  ellipse(center, center, 200, 200);
  fill(176, 215, 119);
  arc(xarc, yarc, 200, 200, 1.5*PI, (minute()/30*PI-HALF_PI+0.0001));

//end of green minutes circle
  fill(77);
  ellipse(center, center, 125, 125);

//beginning of blue seconds circle
  ellipse(center, center, 100, 100);
  fill(139, 219, 217);
  arc(xarc, yarc, 100, 100, 1.5*PI, (second()/30*PI-HALF_PI+0.0001));

//end of blue seconds circle
  fill(77);
  ellipse(center, center, 25, 25);

//literal time
	fill(255);
  textAlign(RIGHT);
  text(hour()%24, 185, 30);
  text(":", 190, 30);
  textAlign(CENTER);
  text(minute(), 200, 30);
  text(":", 210, 30);
  textAlign(LEFT);
  text(second(), 215, 30);
}

I approached this project by making a simplified version of a typical analog clock. This design is meant to be highly and easily legible, so I used an RGB color palette to easily distinguish between time segment and a layout that references typical clocks. I envision this design being an alternative to typical clocks, in which numbers aren’t needed to interpret the time.

Fallon Creech-LookingOutwards-06

Physical product with geographical extrusions placed over sheet of associated randomized points

Artists Steffen Fielder and Jonas Loh explore user relationships with randomness in their “Known Unknowns” project. One user had the opportunity to interview the artists discovered “the designers explored the importance of randomness in our daily life but also investigated whether randomness actually exists or if it is just a lack of knowledge which makes things appear random to us.” To answer these thoughts, they utilized two different seeds to generate random numbers. The Random Event Harvester collects random numbers in an indicated environment and stores them with corresponding geographical information. The Cosmic Ray Detection Chamber uses the information from the Random Event Harvester to generate random values, which ultimately produce tiles with randomized extrusions extending from one face.

Two seeds (Random Event Harvester and Cosmic Ray Detection Chamber) pictured together

Fallon Creech-Project-05-Wallpaper

sketch

//Fallon Creech
//Section B
//fcreech@andrew.cmu.edu
//Project-05

var x = 40;

function setup() {
	createCanvas(560, 560);
}

function draw() {
	background(220);
	noStroke();
	for (var i = 0; i < 15; i++) {
		for (var j = 0; j < 15; j++) {
      //fill every other column with all orange ellipses
			if (j % 2 == 0) {
				r = 245;
				g = 125;
				b = 0;
      }

      //fill every other column with orange circles in every other row
      else if (i % 2 == 0) {
				r = 255;
				g = 165;
				b = 0;
			}

      //fill every other column with purple circles in every other row
      else if (j == j) {
				r = 50;
				g = 80;
				b = 220;
				fill(r, g, b);
				rect(x * j, x * i, x, x);
			}

			fill(r, g, b);
			ellipse(x * j, x * i, x, x);
		}
	}
}

I chose to approach this project as an extension of the assignments we worked on in lab, so I created a pattern of circles that used color to differentiate between row and column with one circle that adopted another quality.

Fallon Creech-LookingOutwards-05

“genesis4321” belongs to Pedersen’s Generative Art collection.

Generative artist Thomas Lin Pedersen explores the quality and beauty of dynamic systems. He writes about the process of designing a system that is familiar and the positive surprise that unfolds as he uncovers new information in highly complex systems. He believes “the process of generative art is dual,” meaning both system development and visualization method are required.

Pedersen uses R to program his generative art and has even developed his own tools that fit into his process, including ggplot2, ggforce, ambient, particles, tidygraph, and ggraph. Though some generative artists choose to share their code with internet users in order to transparently showcase their workflows, Pedersen believes in keeping his code unrevealed; to him, the code is as important as the resulting visualization, and every artist has their own style and method.

“genesis4653” belongs to Pedersen’s Generative Art collection.
“genesis39672” belongs to Pedersen’s Generative Art collection.

Fallon Creech-LookingOutwards-04

Video demonstrates how a user would interact with the machine

“Weather Thingy,” a sound project designed by designer Adrien Kaeser, uses climate-related events to modify and control sounds, which ultimately produces a string of various and unpredictable effects that update according to weather data. This machine utilizes two primary parts; a weather station consists of various climate sensors, and a custom-built controller assigns parameters to sound effects. The weather data interpreted by this machine can also be visualized on a screen and even allows the musician to control the amplification of the sound.

I respect the control that Kaeser gives to musicians using this machine; while the machine does force the user to interpret the climatic impact on the composition of their music, it gives them the control to both override and reuse these effects throughout. It insures the artist still has creative freedom, but encourages them to acknowledge factors beyond their own control.

Image depicts the various instruments through which sound is interpreted.