Lanna Lang – Project 07 – Curves

sketch

//Lanna Lang
//Section D
//lannal@andrew.cmu.edu
//Project 07 - Curves

var nPoints = 100;
var angle = 0;

function setup() {
    createCanvas(480, 480);
}

function draw() {
    background('#ffc5a1'); //pastel orange
    
    //call, translate, and rotate
    //the epitrochoid curve
    push();
    translate(width/2, height/2);
    rotate(radians(angle));
    drawEpitrochoid();
    angle += 10;
    pop();
    
    //call and translate the hypotrochoid curve
    push();
    translate(width/2, height/2);
    drawHypotrochoid();
    pop();
}

//Epitrochoid curve (biggest curve)
function drawEpitrochoid() {
    //http://mathworld.wolfram.com/Epitrochoid.html
    
    var x1;
    var y1;
    
    //scale and rotation based on mouseY and mouseX
    var a1 = map(mouseY, 0, 480, 10, 70);
    var b1 = 20;
    var h1 = mouseX;
    
    strokeWeight(4);
    stroke('lightyellow');
    fill(mouseX, 150, mouseY); //fill based on the mouse
    beginShape();
    for (var i = 0; i < nPoints; i++) {
        var t1 = map(i, 0, nPoints, 0, TWO_PI);
        //epitrochoid equation
        x1 = (a1 + b1) * cos(t1) - (h1 * cos((a1 + b1 / b1) * t1));
        y1 = (a1 + b1) * sin(t1) - (h1 * sin((a1 + b1 / b1) * t1));
        vertex(x1, y1);
    }
    endShape(CLOSE);
}

//Hypotrochoid curve
function drawHypotrochoid() {
    //http://mathworld.wolfram.com/Hypotrochoid.html
    
    //rainbow filled hypotrochoid
    var x2;
    var y2;
    
    //scale and rotation based on the mouse
    var a2 = map(mouseY, 0, 480, 80, 200);
    var b2 = 20;
    var h2 = mouseX / 10;
    
    strokeWeight(4);
    stroke('hotpink');
    fill(mouseX, mouseY, 200);
    beginShape();
    for (var i = 0; i < nPoints; i++) {
        var t2 = map(i, 0, nPoints, 0, TWO_PI);
        //hypotrochoid equation
        x2 = (a2 - b2) * cos(t2) + h2 * cos((a2 - b2) / b2 * t2);
        y2 = (a2 - b2) * sin (t2) - h2 * sin((a2 - b2) / b2 * t2);
        vertex(x2, y2);
    }
    endShape(CLOSE);
   
    //green hypotrochoid with lines
    var x3;
    var y3;
    
    var a3 = 180;
    var b3 = map(mouseY, 480, 0, 180, 20);
    var h3 = -mouseX / 10;
    
    //array for the lines inside the curve
    var lineX = [];
    var lineY = [];
    
    strokeWeight(3);
    stroke('lightgreen');
    noFill();
    beginShape();
    for (var i = 0; i < nPoints; i++) {
        var t3 = map(i, 0, nPoints, 0, TWO_PI);
        //hypotrochoid equation
        x3 = (a3 - b3) * cos(t3) + h3 * cos((a3 - b3) / b3 * t3);
        y3 = (a3 - b3) * sin(t3) - h3 * sin((a3 - b3) / b3 * t3);
        vertex(x3, y3);
        lineX.push(x3);
        lineY.push(y3);
    }
    endShape(CLOSE);
    
    //draw the lines inside the curve with a for loop
    for (var i = 0; i < lineX.length - 1; i++) {
        strokeWeight(2);
        stroke(mouseX + mouseY, mouseY, 120);
        line(0, 0, lineX[i], lineY[i]);
    }   
}

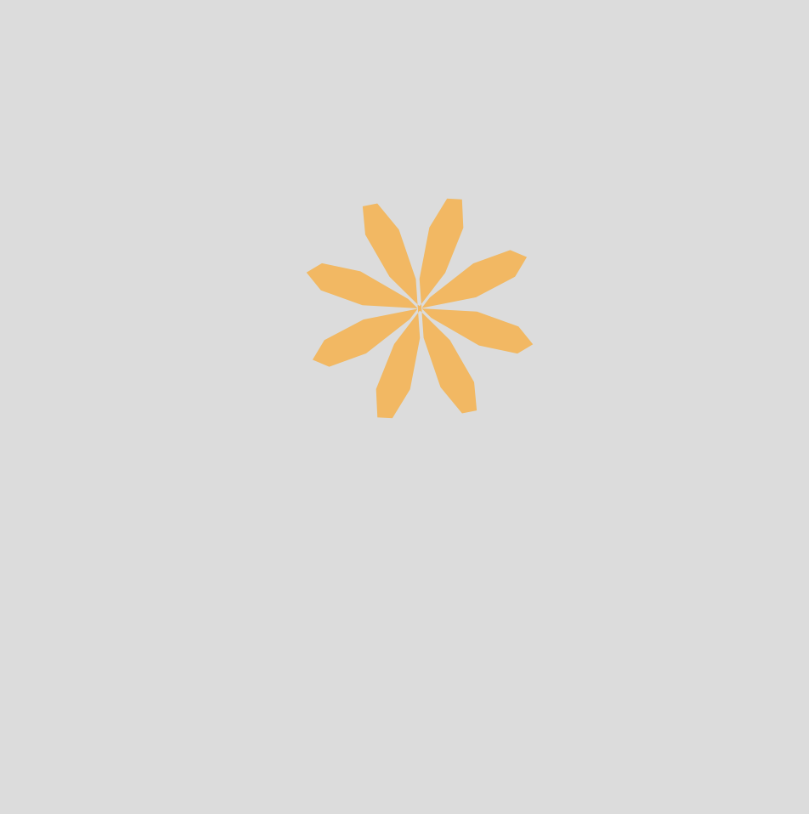
I was intimidated at first looking at the instructions that said we had to create an image based on math curve functions, and I thought it would be very difficult to do, but it turned out to be pretty simple. I had a lot of fun researching the different roulette curves and seeing which ones did cool things with code. I played a lot with mouseX and mouseY, as well as scale, map(), and color. My favorite part of this project is that if you stop your mouse at a different point on the canvas, the epitrochoid curve changes into a completely different curve each time; it’s so interesting to see the crazy curves it can create by changing its a, b, and h values with the mouse’s coordinates.
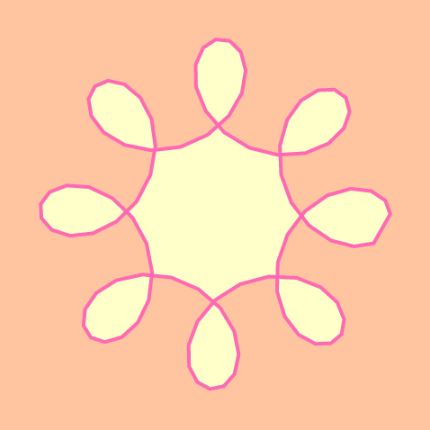
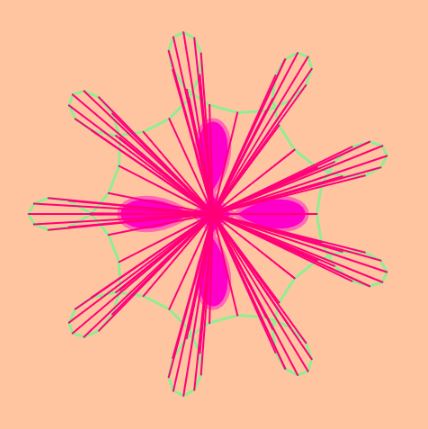
First state: only one hypotrochoid curves
Second state: with both hypotrochoid curves

Siwei Xie – Project 07 – Curves

sketch

//Siwei Xie
//Section B
//sxie1@andrew.cmu.edu
//project-07

var nPoints = 500;
var t;
var angle = 0;
var adj = 2;

function setup() {
    createCanvas(480, 480);
}

function draw() {
	background(220);
    noStroke();

	//draw Quadrifolium with variant colors
    push();
    fill(mouseX, mouseY, 80);
    translate(mouseX, mouseY);
    rotate(radians(angle));
    drawQuadrifolium();
    angle = (angle + adj) % 360;
    pop();

    //draw Epitrochoid with variant colors
    push();
    fill(80, mouseX, mouseY);
    translate(200, 200);
    drawEpitrochoid();
    pop();
}

//draw rotating & moving windmill
function drawQuadrifolium() {
    var a = 70;
    
    beginShape();
    for (var i = 0; i < nPoints; i++) {
        var t = map(i, 0, nPoints, 0, TWO_PI);

        //http://mathworld.wolfram.com/Quadrifolium.html
        r = a * sin(2 * t);
        x = r * cos(t);
        y = r * sin(t);
        vertex(x, y);
    }
    endShape(CLOSE);
}

//draw variant curve in the middle
function drawEpitrochoid(){
    var a1 =  40;
    var b1 = 200;
    var h = constrain(mouseY/ 10.0, 0, b1);
    var t;
    var r = map(mouseX, 0, 600, 0, 1); 
    
    beginShape();
    fill(200, mouseX, mouseY);
    for (var i = 0; i < nPoints; i++) {

        stroke("black");
        vertex(x, y);
        var t = map(i, 0, nPoints, 0, TWO_PI * 2); // mess with curves within shapes

        //Parametric equations for Epitrochoid Curve
        x = r* ((a1 + b1) * cos(t) - h * cos((t * (a1 + b1) / b1) + mouseX));
        y = r* ((a1 + b1) * sin(t) - h * sin((t * (a1 + b1) / b1) + mouseX));
        
    }
    endShape(CLOSE);
    
}

I had fun creating this image. I used Quadrifolium and Epitrochoid in my drawing, and adjusting them according to the position of mouse.

Quadrifolium is a type of rose curve with n=2. It has the polar equation. Epitrochoid is a roulette traced by a point attached to a circle of radius r rolling around the outside of a fixed circle of radius R, where the point is at a distance d from the center of the exterior circle. 

By modifying the limits of parameters and changing value of parameters in the formula, I was able to play with the curves.

Screenshot after I finished drawing the Quadrifolium.

Emma NM-Project-07(Curves)


curves

/* 
Emma Nicklas-Morris
Section B
enicklas
Project-07
Curves
*/

var numP = 200;


function setup() {
    createCanvas(400, 400);

}

function draw() {
    background("#F9CDAD");
    
    // curve name
    noStroke();
    textAlign(CENTER);
    textSize(24);
    fill("black");
    text("Hypocycliod", width / 2, 35);

    // draws hypocycloids
    drawHypocycloid(10, 0, "#FC9D9A"); // light pink one 
    drawHypocycloid(7, 30, "#FE4365"); // bright pink one
    drawHypocycloid(4, 60, "#AE1F3A"); // dark pink one
    drawHypocycloid(1, 90, "#610819"); // maroon one
}

function drawHypocycloid(scale, rotation, color) {
    // Hypocycliod:
    // http://mathworld.wolfram.com/Hypocycloid.html

    // effects number of points and the shape of the hypocycloid and size
    var a = constrain(mouseX, 118, 300) / 20;
    // as the mouse moves down, number of points decrease
    var b = constrain(mouseY, 20, 200) / 100;
    var n = a / b;
    var o = mouseY - (mouseX / 75); // outline size on shape

    strokeWeight(o);
    stroke(color);
    noFill();

    push();
    translate(width / 2, height / 2); // center of canvas
    rotate(rotation);
    beginShape();
    for (var i = 0; i < numP; i++) {
        var p = map(i, 0, numP, 0, TWO_PI);

        // equation for hypocycloid
        var x = ((a / n) * ((n - 1) * cos(p) - cos((n - 1) * p)));
        var y = ((a / n) * ((n - 1) * sin(p) + sin((n - 1) * p)));
        vertex(scale * x, scale * y);

    }
    endShape(CLOSE);
    pop();
}


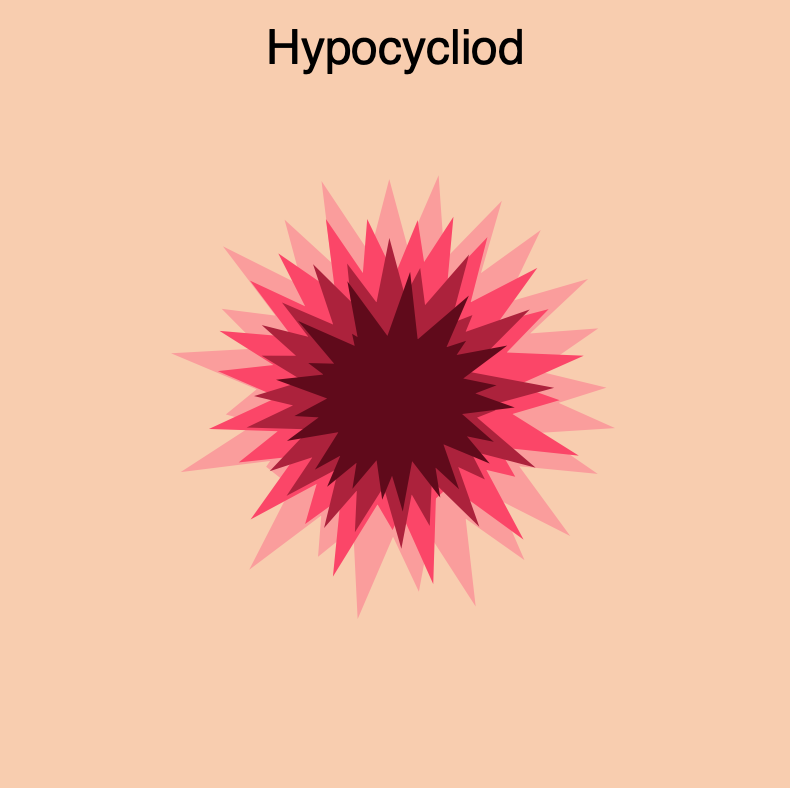
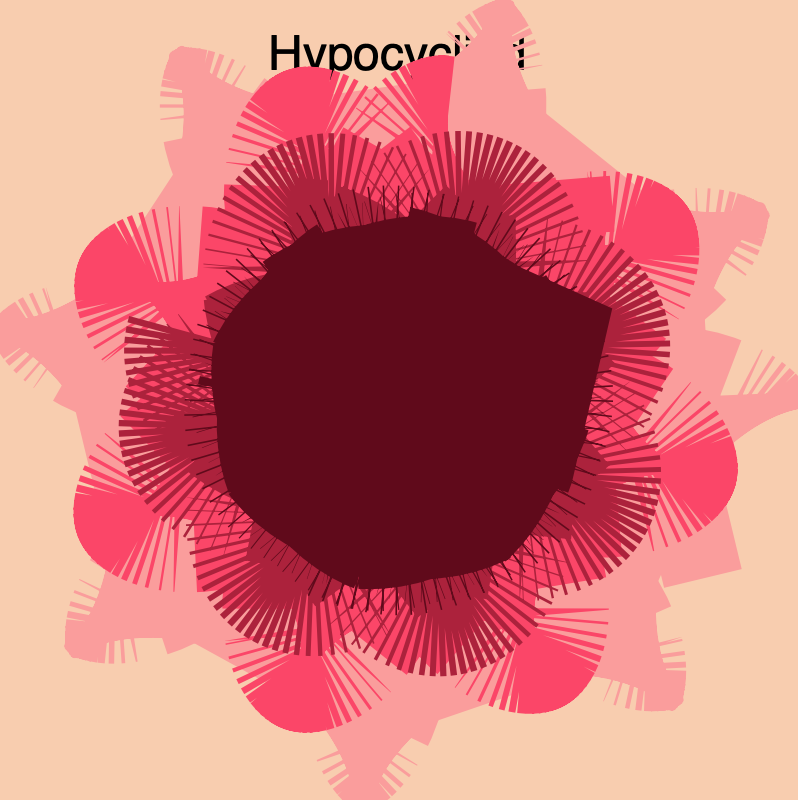
This project seemed daunting at first because I have not done any math in awhile, but once I realized that I could just type the equation for creating a curve it became more exciting. It took me a while to choose a curve. I was interested in one that had multiple points or leafs. I also wanted to use mouseX and mouseY to control how many points/leaf were show at a time. Then, I thought about using mouse position to also control the outline size. Finally, I decided to use scale to make several hypocycloids to make the drawing more interesting. I find the upper right hand corner most interesting and the lower right hand corner the least interesting. Ideally, I wish the maroon hypocycloid didn’t look like such a big blog when the mouse is in the bottom right hand corner because the lines beneath it seem interesting, but the top one block it. I think this was a fun assignment to play with.

Steven Fei-Project 07-Curves


sketch

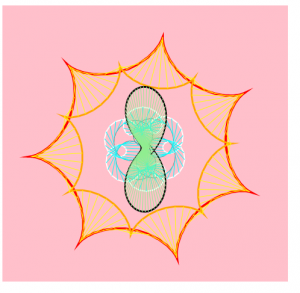
For this project, I was fascinated with the curves generated by those functions to breakdown the x and y coordinates. Then I started to play it around with mouse positions to create a growing, blooming effect. Generally, I used 2 types of curves — hypocycloid and hypotrocloid — to construct the imaginary veins and flowers. The central “mark-pen” drawing of the hypotrocloid was discovered accidentally when I tried to add varying thickness to the lines and now it gave a more realistic and 3D effect when combined with the light green lines. The blooming process integrates a series of overlappings among different elements. The white, cyan, and grey lines are related to give an impression of how the flowers can “squeeze” and “expand” during the process. The outer red,orange, and yellow lines give the basic pedestals for the drawing.

State0, blooming begin

state1, blooming

original sketch of using curves to generate a spatial drawing

//Steven Fei
//Section A
//zfei@andrew.cmu.edu
//Project-07
var nPoints = 100;

function setup() {
    createCanvas(480, 480);
    
}
 
 
function draw() {
    background("pink");
    push();
    translate(width/2, height/2);
    
    hypocycloidInvolute();
    hypotrochoid();   
    
    pop();
    
}
function hypotrochoid(){
    //http://mathworld.wolfram.com/Hypotrochoid.html
    var x;
    var y;
    var x2;
    var y2;
    var a = constrain(mouseX,60, 180) ;//variable for hypotrochoid with 1/6radius
    var b = a/6; //variable for hypotrochoid with 1/6 radius
    var h = constrain(mouseY/8, 0, 2*b); // control the size of the radius
    var ph = mouseX/20; // control the starting angle of the radius
    var a2 = map(mouseY,0,480,30,80); // variable for hypotrochoid with 1/2 radius
    var b2 = a/2; // variable for hypotrochoid with 1/2 radius
    var a3 = a-20;//variable for the grey hypotrochoid
    var b3 = a3/4;//variable for the grey hypotrochoid
    var h3 = constrain(mouseY/8,0,2.5*b3);//variable for the grey hypotrochoid
    var lineV1x = []; // arrays to collect the hypotroid coordinates with 1/2 radius
    var lineV1y = []; // arrays to collect the hypotroid coordinates with 1/2 radius
    var lv2x = [];//arrays to collect the white hypotrochoid coordinates
    var lv2y = [];//array to collect the white hypotrochoid coordinates
    var lv3x = [];//arrays to collect the grey hypotrochoid coordinates
    var lv3y = [];//arrays to collect the grey hypotrochoid
    noFill();
    //draw the grey hypochocoid with 1/4 radius
    beginShape();
    stroke("grey");
    strokeWeight(1);
    for (var z = 0; z<nPoints; z++){
        var tz = map(z, 0, nPoints, 0, TWO_PI);
        x2 = (a3-b3) * cos(tz) - h3*cos(ph + tz*(a3+b3)/b3);
        y2 = (a3-b3) * sin(tz) - h3*sin(ph + tz*(a3+b3)/b3);
        vertex(x2,y2);
        lv3x.push(x2);
        lv3y.push(y2);
    }
    endShape(CLOSE);

    //begin drawing the hypotrochoid with 1/6 radius
    beginShape();
    stroke("white");
    strokeWeight(2);
    for (var i = 0; i<nPoints; i++){
        var t = map(i, 0, nPoints, 0, TWO_PI);
        x = (a-b) * cos(t) - h*cos(ph + t*(a+b)/b);
        y = (a-b) * sin(t) - h*sin(ph + t*(a+b)/b);
        vertex(x,y);
        lv2x.push(x);
        lv2y.push(y);
    }
    endShape(CLOSE);
    //draw the blue vains
    for (var d = 0; d<lv2x.length; d++){
        stroke("cyan");
        strokeWeight(1);
        line(lv2x[d],lv2y[d],lv3x[d],lv3y[d]);
    }
    
    //begin drawing the hypotrochoid with 1/2 radius
    beginShape();
    stroke(0);
    strokeWeight(1);
    for (var j = 0; j<nPoints; j++){
        var t2 = map(j, 0, nPoints, 0, TWO_PI);
        x = (a2-b2) * cos(t2) - h*cos(ph + t2*(a2+b2)/b2);
        y = (a2+b2) * sin(t2) - h*sin(ph + t2*(a2+b2)/b2);
        vertex(x,y);
        lineV1x.push(x);
        lineV1y.push(y);
    }
    endShape(CLOSE);
    // creating the mark pen effect by adding lines with 4 spacings of the inddex
    for (var j2 = 0; j2 < lineV1x.length-1; j2++){
        strokeWeight(1);
        stroke(0);
        line(lineV1x[j2], lineV1y[j2],lineV1x[j2+4],lineV1y[j2+4]);
        stroke("lightgreen");
        line(0,0,lineV1x[j2],lineV1y[j2]);//drawing the green veins
    }  
}
function hypocycloidInvolute(){
    //http://mathworld.wolfram.com/HypocycloidInvolute.html
    var x1;//vertex for the red hypocycloid
    var y1;//vertex for the red hypocycloid
    var x2;//vertex for the orange hypocycloid
    var y2;//vertex for the orange hypocycloid
    var lx1 = [];//array for collecting the coordinates of the red hypocycloid
    var lx2 = [];//array for collecting the coordinates of the red hypocycloid
    var ly1 = [];//array for collecting the coordinates of the orange hypocycloid
    var ly2 = [];//array for collecting the coordinates of the orange hypocycloid
    var a = map(mouseY,0,480,90,180);//size of the red hypocycloid
    var b = a/7; //sides for the red hyposycloid
    var h = b; //determine the sharp corners
    var ph = mouseX/20;
    noFill();
    // red hypocycloid
    beginShape();
    stroke("red");
    strokeWeight(4);
    for (var i = 0; i<nPoints; i++){
        var t = map(i, 0, nPoints, 0, TWO_PI);
        x1 = a/(a-2*b) * ( (a-b)*cos(t) - h*cos( ph + (a-b)/b*t) );
        y1 = a/(a-2*b) * ( (a-b)*sin(t) + h*sin( ph + (a-b)/b*t) );
        vertex(x1,y1);
        lx1.push(x1);
        ly1.push(y1);
    }
    endShape(CLOSE);
    // begin drawing orange involute of the hypocycloid
    beginShape();
    stroke("orange");
    strokeWeight(3);
    for (var j = 0; j<nPoints; j++){
        var th = map(j, 0, nPoints, 0, TWO_PI);
        x2 = 1.5*((a-2*b)/a * ( (a-b)*cos(th) + h*cos( ph + (a-b)/b*th) ));
        y2 = 1.5*((a-2*b)/a * ( (a-b)*sin(th) - h*sin( ph + (a-b)/b*th) ));
        vertex(x2,y2);
        lx2.push(x2);
        ly2.push(y2);
    }
    endShape(CLOSE);
    // drawing the connection of the two hypocycloids
    for (var k = 0; k < lx1.length; k++){
        stroke("yellow");
        strokeWeight(1);
        line(lx1[k],ly1[k],lx2[k],ly2[k]);
    }
    
}

Taisei Manheim – Project 07 – Composition with Curves


sketch

For this project, I was intimidated at first because I was not sure how some of the mathematical equations for the lines worked because I haven’t taken a math class in a while.  However, I realized that just by plugging different equations into the for loop it created interesting results that I was not expecting.  In the end I chose to use a Hypotrochoid and a Ranunculoid.  The combination of the overlapping  geometries, along with the changing colors according to the mouse location give it a bit of a psychedelic vibe.

//Taisei Manheim
//Section C
//tmanheim@andrew.cmu.edu
//Assignment-07


function setup() {
    createCanvas(480, 480);
}

function draw() {
    //background color determined by mouse
    background(mouseX, mouseY, mouseX - mouseY);
    drawHypotrochoidCurve()
    drawRanunculoidCurve()
}

function drawHypotrochoidCurve() {
    //http://mathworld.wolfram.com/Hypotrochoid.html

    //mouse only affects image while on canvas
    var x = constrain(mouseX, 0, width); 
    var y = constrain(mouseY, 0, height);

    //changes speed in which it changes so that as you move away from center image changes
    var a = map(x, 0, width, 0, width / 64); 
    var b = map(y, 0, height, 0, height / 64);
    var h = width / 2;

    push();
    translate(width / 2, height / 2); // starts in the center of the canvas
    noFill();
    beginShape();
    for(var i = 0; i < 360; i += 1) {
        var x = (a - b) * cos(i) + h * cos((a - b) * i);
        var y = (a - b) * sin(i) - h * sin((a - b) * i);
        vertex(x, y);
    }
    endShape();
    pop();
}

function drawRanunculoidCurve() {
    //http://mathworld.wolfram.com/Ranunculoid.html
    
    //mouse only affects image while on canvas
    var x = constrain(mouseX, 0, width); 
    var y = constrain(mouseY, 0, height);

    //changes speed in which it changes
    var a = map(x, 0, width, 0, width / 8); 
    var b = map(y, 0, height, 0, height / 8);

    push();
    translate(width / 2, height / 2); // starts in the center of the canvas
    rotate(mouseX/ mouseY);
    noFill();
    beginShape();
    for(var i = 0; i < 360; i += 1) {
        var x = a * (6 * cos(i) - cos(6 * i));
        var y = a * (6 * sin(i) - sin(6 * i));
        vertex(x, y);
    }
    endShape();
    pop();
}