![[OLD FALL 2020] 15-104 • Introduction to Computing for Creative Practice](https://courses.ideate.cmu.edu/15-104/f2020/wp-content/uploads/2021/09/stop-banner.png)
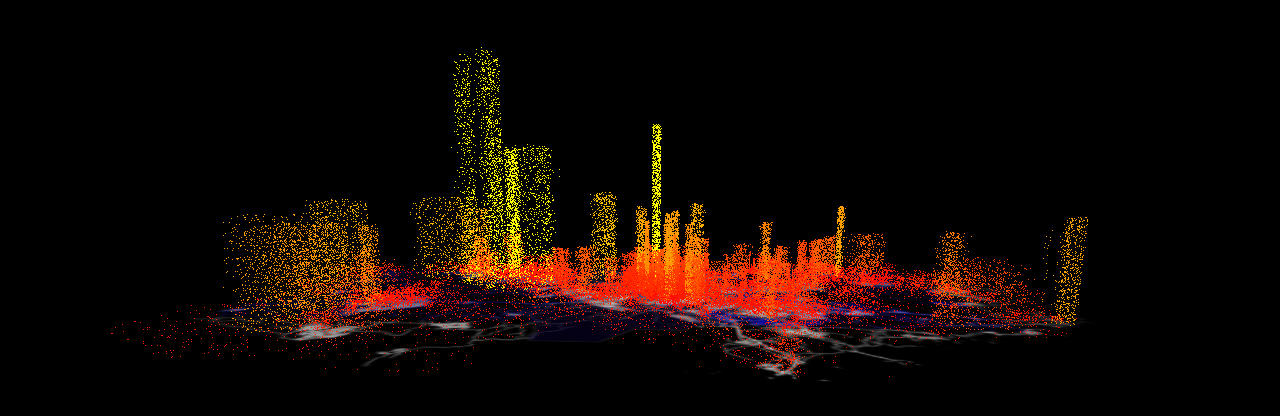
The project I chose this week was Aaron Koblin’s Amsterdam SMS. This project is an interactive visualization tool developed for the MIT Senseable City Lab which helps visualize SMS messages data. I admired this project because I was drawn to the boldness of the colors and like any artwork done using data, I just thought it was very interesting and cool. To generate this work, Koblin used Processing and OpenGL. The data he used was provided by KPN Mobile. Like his other works, Koblin uses bright colors or “light” (he doesn’t actually use light in this project but the bright colors do give off a similar effect!) to stimulate our sight and draw attention to the artwork.