![[OLD FALL 2020] 15-104 • Introduction to Computing for Creative Practice](../wp-content/uploads/2021/09/stop-banner.png)
In this lab/recitation, you will write some p5.js programs that use the techniques you’ve learned in class so far, specifically focusing on data files and the DOM. The goal here is not just to get the programs done as quickly as possible, but also to help your peers if they get stuck and to discuss alternate ways to solve the same problems. You will be put into breakout rooms in Zoom to work on your code and then discuss your answers with each other, or to help each other if you get stuck. Then we will return to discuss the results together as a group.
For these problems, you should use the template-all file that contains extra instructions to load the p5.js DOM add-on. For the first two problems, you will need to run a local server to load the data files.
A. Elevation Map
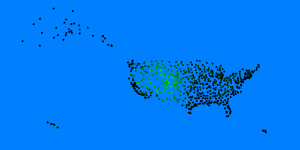
We would like to visualize the elevation of counties of the United States based on a comma-separated values (csv) file elevationdata.csv. In the file, there is a header that lists the meaning of each of the four columns. The first column is the state/county, the second column is the latitude (denoted LAT), the third column is the longitude (denoted LON), and the fourth column is the elevation (denoted ELEV).
- The latitude values are in the range from 75 to 10.
- The longitude values are in the range from -175 to -50.
- The elevation values are in the range from -60 to 8000.
If you open the file, you will see that some locations have an elevation of -99999. This means that no elevation data is known for that location.
Write a program that processes each line of data and plots a circle of size 5 at its relative location on a 600 x 300 canvas, where the color of the circle will be a shade of green that is very dark green (0) for an elevation of -60 up to a very bright green (255) for an elevation of 8000, but only if the location has elevation data.
Here is a sample sketch to start you off. Fill in the missing code. (HINT: See the cities example from Lecture 34 for some guidance.) You will need to run a local server to load the data file.
B. Population Visual
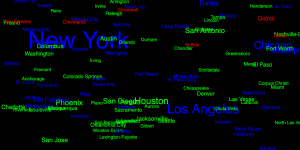
We would like to visualize the relative population and population growth of the top 100 cities in the United States based on a JavaScript Object Notation (json) file populationdata.json . In the file, there is a sequence of city objects. Each object has city name (“cityname”), its growth rate as a percentage (“growth”), its latitude and longitude (“latitude”, “longitude”), its population (“population”), its rank (“rank”), and its state (“state”).
Write a program that loads the objects into an array and displays each city name at a random location on a 600 x 300 canvas, where the size of the text will range from 8 pt. for cities at population 0 to 48 pt. for cities at population 10 million, and the color of the text will be red if the city’s growth rate is -10% or lower, green if the city’s growth rate is 10% or higher, or blue otherwise.
Here is a sample sketch to start you off. Fill in the missing code. (HINT: See the films example from Lecture 34 for some guidance.) You will need to run a local server to load the data file.
C. Jumping Canvas
In this exercise, you will create a simple 100 X 100 canvas that has a yellow circle in its middle. You will program your sketch so that the canvas randomly bounces around, once per second, to some random location in the top left 400 x 400 of the webpage. Look at the first example from Lecture 35 for some guidance.
This exercise will require the use of the DOM so be sure you’re using the template that includes that add-on, but this program does not need the local server since you will not be loading any images or sound.
Handin
At the end of the lab, zip the lab-15 folder (with whatever you finished) and submit it to Autolab. Do not worry if you did not complete all of the programming problems but you should have made reasonable attempts for at least the first two problems.