![[OLD FALL 2020] 15-104 • Introduction to Computing for Creative Practice](../../wp-content/uploads/2021/09/stop-banner.png)
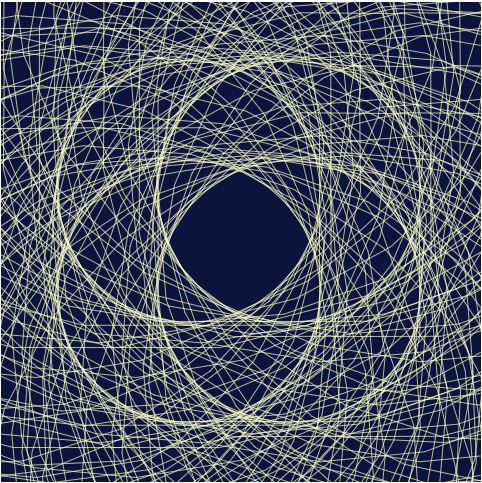
sketch
var x ;
var y ;
function setup() {
createCanvas(480, 480);
strokeWeight(0.7);
frameRate(5);
}
function draw() {
background(10, 20, 60);
translate(89,89);
for (var j = 1; j <=2 ; j++ ){ //setting up 2x2 grid for circles
for (var k = 1; k <=2 ; k++){
push();
translate (j*100,k*100); //moving the grid to the center
drawpattern();
pop();
}
}
}
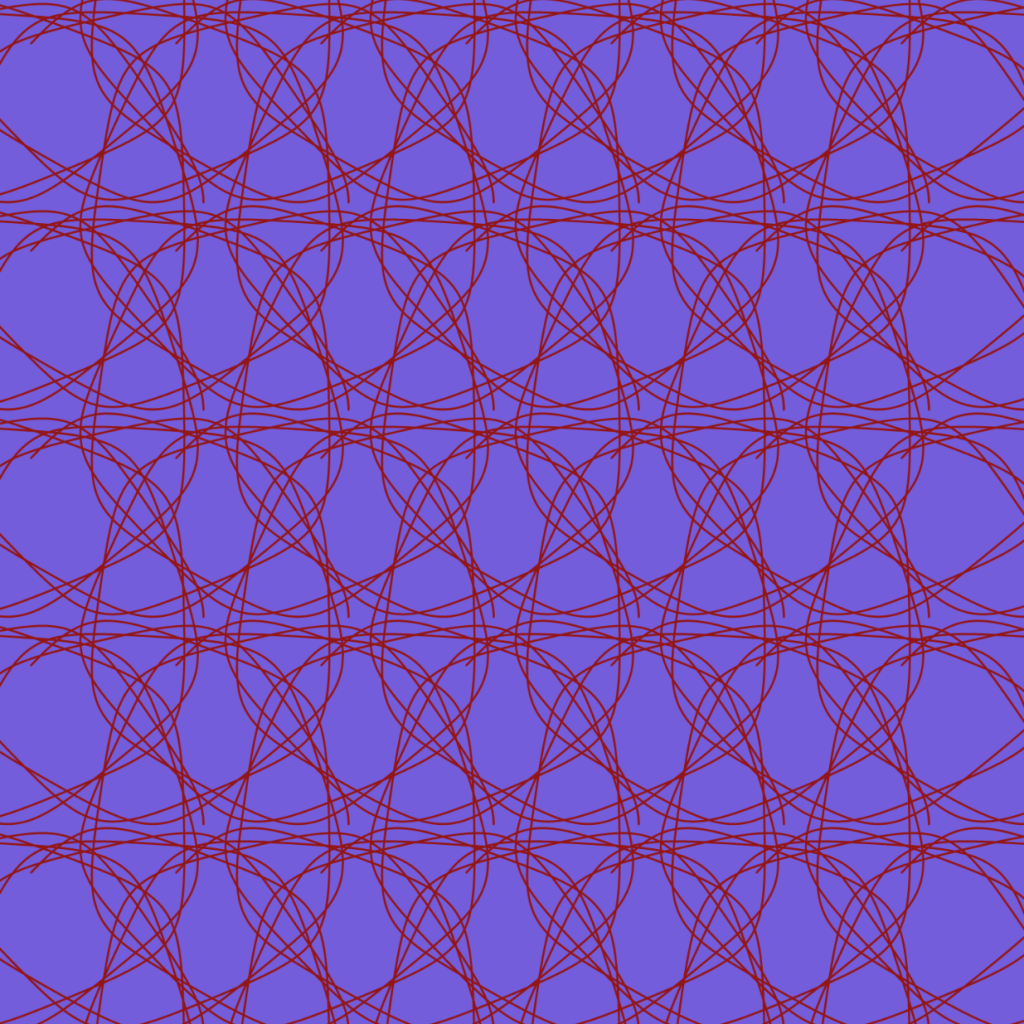
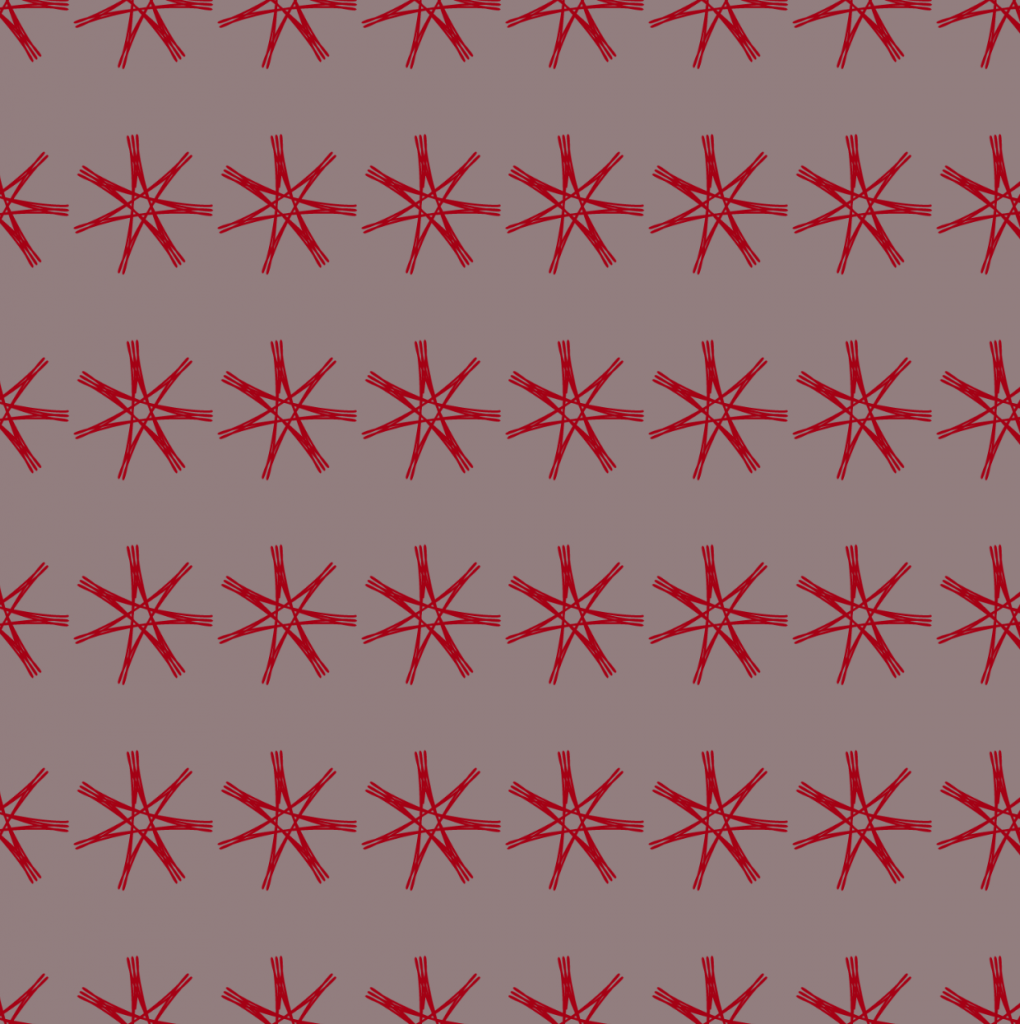
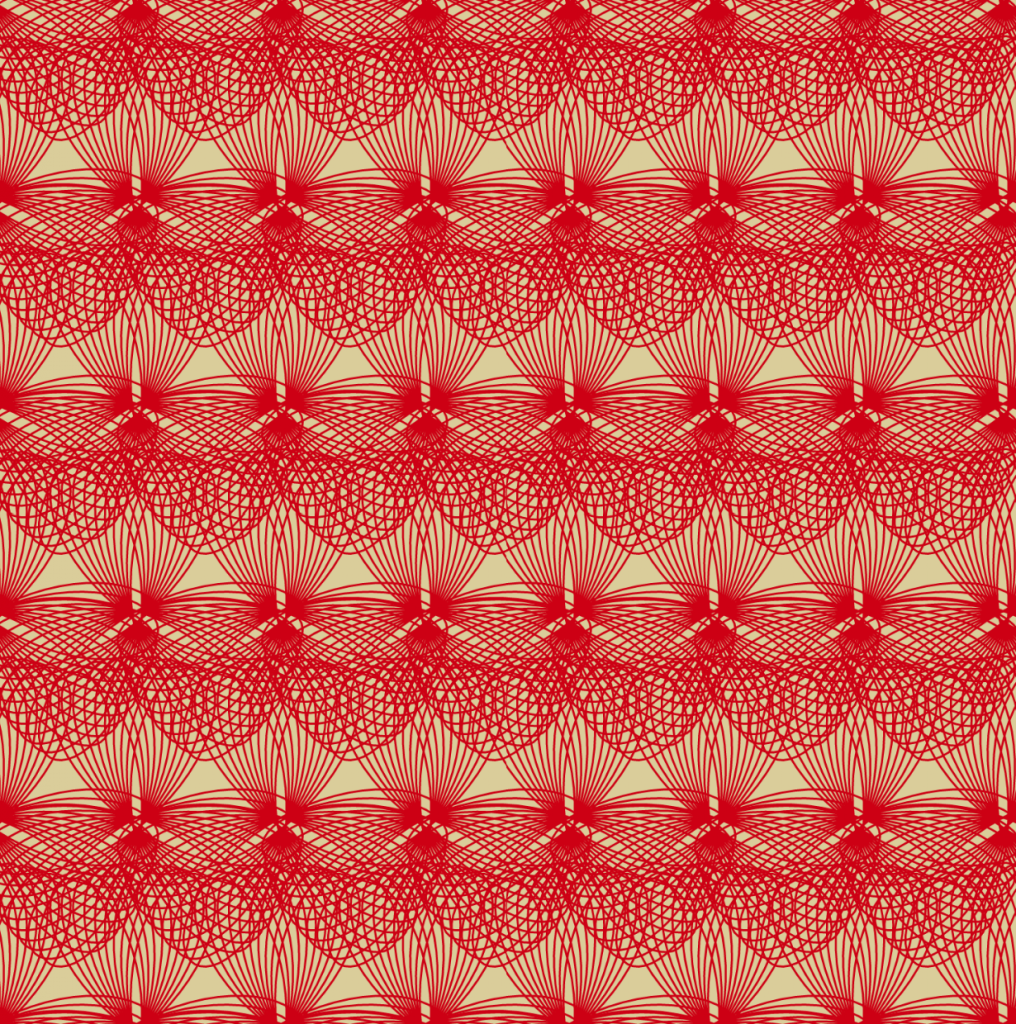
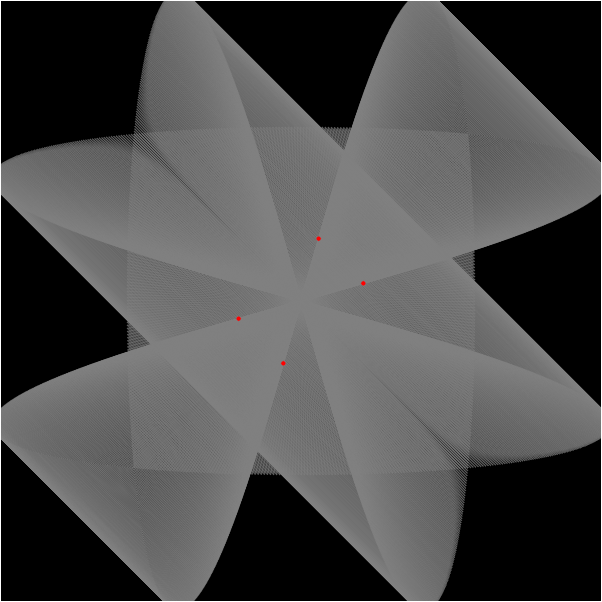
function drawpattern() {
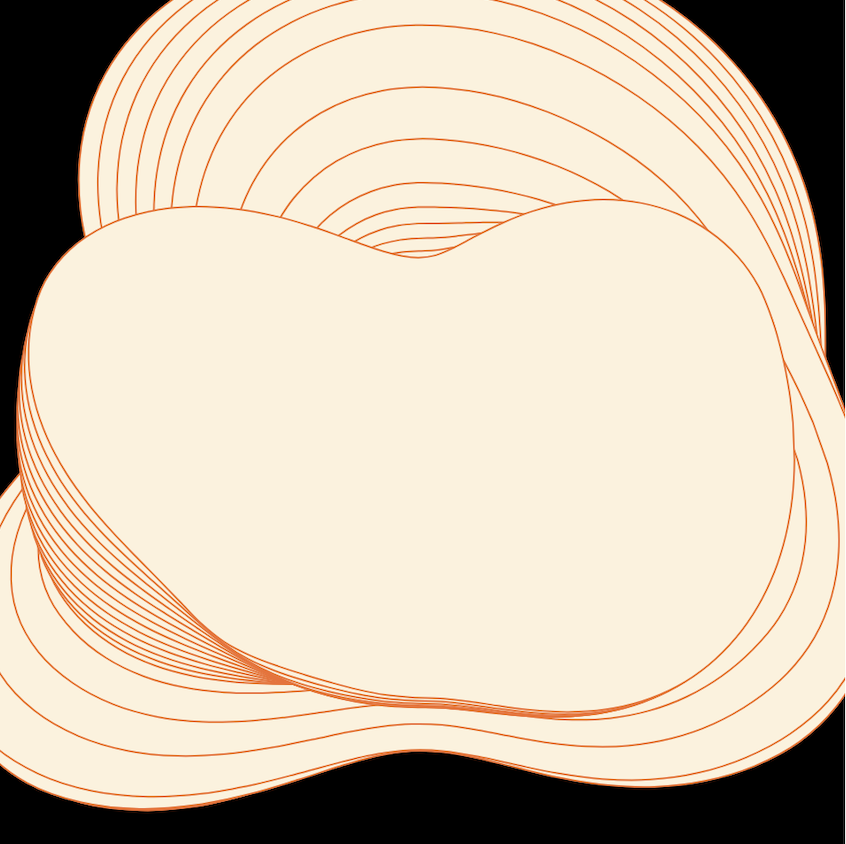
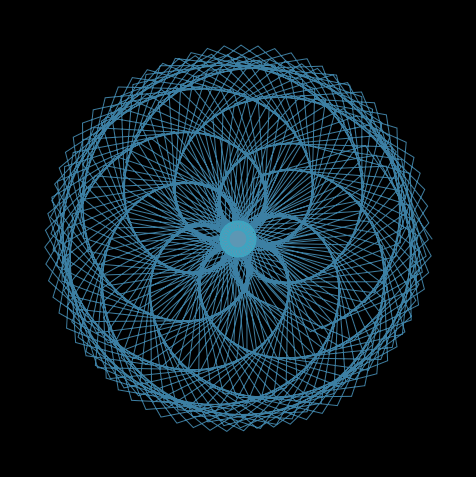
var a = map(mouseX, 0, height, 10, 80); //establishing variables that lead the cruves to vary
var b = map(mouseX, 0, width, 10, 20);
var h = map(mouseX, 0, width, 0, 100);
noFill();
stroke(mouseY, mouseX, 200);
beginShape(); //drawing geometry
for (var n=0; n <=800; n++) {
var Deg = map(n, 0, 100, 0, TWO_PI);
x = (a-b)*cos(Deg) + h*cos(((a-b)/b)*Deg);
y = (a-b)*sin(Deg) - h*sin(((a-b)/b)*Deg);
vertex(x, y);
}
endShape();
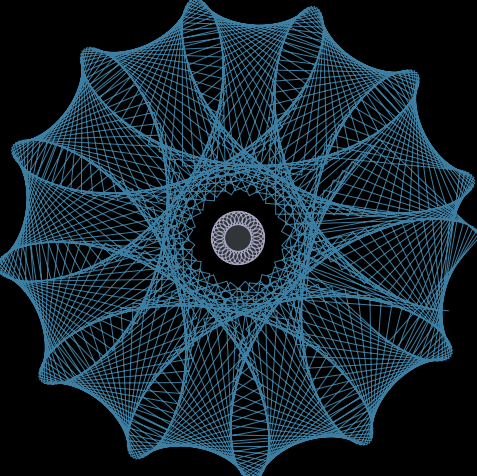
}I wanted to give this piece as much variation in structural form as I could.