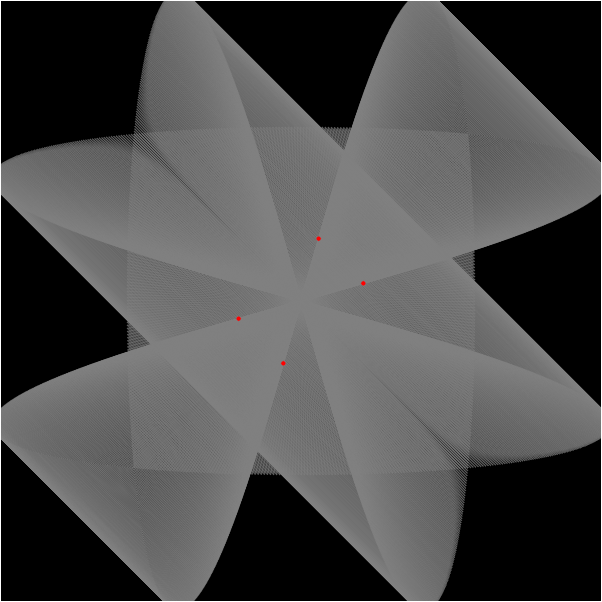
The inspiration behind this project was Viviani’s Curve, which is normally contained in 3D space, but can be represented from its front view on the 2D plane as a parabolic curve. I also animated a few circles moving along the curve to give it a bit more life. You can make some pretty interesting shapes, one of which is pictured below.
function setup() {
    createCanvas(600, 600);
    background(220);
    text("p5.js vers 0.9.0 test.", 10, 15);

    // want to animate circles along curves
    circlePos = 0; // this follows the angle and is a global
}

function draw() {
    background(0);
    var angleIncr = 0.01; // hopefully leads to high definition curve
    var angle = 0;
    var dx, dy;
    var hw = width / 2; // "half width"
    var hh = height / 2;


    beginShape();
    fill(128, 128, 128, 128); // using RGBA
    stroke(128, 128, 128, 128);
    strokeWeight(1);
    // more understandable than using a for loop
    while (angle < 2*PI) {
        // aiming to use Viviani's Curve
        dx = sin(angle);
        dy = 2 * sin(0.5 * angle);

        // want to scale values based on mousePos
        dx *= mouseX - hw;
        dy *= mouseY - hh;

        vertex(dx + hw, dy + hh); // beginShape() doesn't work with translate()
        vertex(-dx + hw, -dy + hh);
        vertex(dy + hw, dx + hh);
        vertex(-dy + hw, -dx + hh);

        // increment angle
        angle += angleIncr;
    }
    endShape();

    angle = 0;
    // second while outside of beginShape()
    while (angle < 2*PI) {
        // aiming to use Viviani's Curve
        dx = sin(angle);
        dy = 2 * sin(0.5 * angle);

        // want to scale values based on mousePos
        dx *= mouseX - hw;
        dy *= mouseY - hh;

        // draw circle
        if (circlePos == angle) {
            fill(mouseX % 255, mouseY % 255, (mouseX + mouseY) % 255);
            circle(dx + hw, dy + hh, 15);
            circle(-dx + hw, -dy + hh, 15);
            circle(dy + hw, dx + hh, 15);
            circle(-dy + hw, -dx + hh, 15);
        }

        angle += angleIncr;
    }

    circlePos = circlePos + angleIncr;
    if (circlePos > 2*PI) circlePos = 0; // can't modulo properly with PI
}

![[OLD FALL 2020] 15-104 • Introduction to Computing for Creative Practice](wp-content/uploads/2021/09/stop-banner.png)