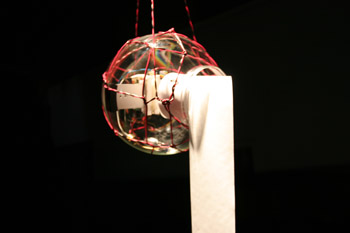
One female artist whom I researched was Kate Armstrong. An example of interesting work that she created was The Problem of Other Minds, which is a voice activated robotic sculpture in a glass orb (http://katearmstrong.com/artwork/robot.php). When it hears words that it recognizes, it unrolls paper that has on it it thoughts, observations and diagrams. I found this really unique because it has an interactive aspect, and humans trigger the action that the robot produces. This work was made in 2006, and the unravelling of paper represents how the robot stored information and is now recalling it. To describe the artist, she is a curator and Vancouver based writer. Her practice is interdisciplinary and she works with generative systems, objects, photography, video and many more fields combining art and technology. She has produced many exhibitions over the years and has experience writing for museums, schools, and various presses about her artistic contributions.
Author: sp17
Project 11- Landscape
//Shruti Prasanth
//Section C
//Project 11
var move = 5;
var cx = 100; //starting location of clouds
var cy = 100;
var clouds = [];
var terrainSpeed = 0.0005;
var terrainDetail = 0.005;
function setup() {
createCanvas(480, 480);
frameRate(4);
//initial display of clouds
for(var i = 0; i < 3; i++){
var cX = random(width);
var cY = random(75, 150);
clouds[i] = makeClouds(cX, cY);
}
}
function draw() {
background(154,73,147);
//sun
noStroke();
fill(236,210,108);
ellipse(width / 3, height / 3, 125, 125);
var mountain1 = mountains("#purple", height * 0.20, height * 0.65, 4); //backmost mountain
var mountain2 = mountains("darkgrey", height * 0.37, height * 0.65, 2); // middle ground mountains
var mountain3 = mountains("grey", height * 0.50, height * 0.65, 3); //foreground mountains
//ocean
noStroke();
fill(137,172,315);
rect(0, height * 0.65, width, height * 0.35);
//sun reflection
noStroke();
fill(250, 103, 71, 100);
arc(width / 3, height * 0.65, 125, 125, 0, PI, OPEN);
update();
removeClouds();
addCloud();
}
function update(){ //update all the clouds
for(var i = 0; i < clouds.length; i++){
clouds[i].move();
clouds[i].display();
}
}
function removeClouds(){ //checks to see where clouds are and changes positions accordingly
var cloudKeep = [];
for(var i = 0; i < clouds.length; i++){
if(clouds[i].x + 25 > 0){ // cloud is 50 wide, so 25 is point from center
cloudKeep.push(clouds[i]);
}
}
clouds = cloudKeep; //keep only clouds still on screen
}
function addCloud(){ //randomly adds clouds at intervals
var newCloud = 0.03;
if(random(0,1) < newCloud){
var cloudY = random(75, 150);
clouds.push(makeClouds(480, cloudY));
}
}
function cloudMove(){ // move the clouds
this.x += this.speed;
}
function cloudDisplay(){ //draw the clouds
fill(255); //white
noStroke();
ellipse(this.x, this.y, 90, 15);
ellipse(this.x - 25, this.y - 10, 35, 30);
ellipse(this.x, this.y - 20, 40, 40);
ellipse(this.x + 20, this.y - 15, 35, 30);
}
function makeClouds(cloudLocX, cloudLocY){ //cloud object definition
var cloud = { x: cloudLocX,
y: cloudLocY,
speed: -5,
move: cloudMove,
display: cloudDisplay}
return cloud;
}
function mountains(color, min, max, noiseS) {
noStroke();
fill(color);
noiseSeed(noiseS);
beginShape();
for(var x = 0; x < width; x++){
var t = (x * terrainDetail + (millis() * terrainSpeed));
var y = map(noise(t), 0, 1, min, max);
vertex(x, y);
}
vertex(width, height);
vertex(0, height);
endShape();
}
For this project, I wanted to play with complimentary colors like purple and yellow and create a different version of a sunset landscape. The clouds are moving and the snow peaked mountains fluctuate in peaks.
Project- 09- Portrait
//Shruti Prasanth
//Project 9- Portrait
//Section C
function preload() {
var portrait="https://i.imgur.com/CDcRoOA.jpeg"; // image by Aliena85
photo=loadImage(portrait); //image variable
}
function setup() {
createCanvas(300,400);
background(0);
photo.resize(300,400); //resizing the image to fit the canvas
photo.loadPixels();
frameRate(10000000000000000000000*100000000000000000);
}
function draw() {
var x=random(width);
var y=random(height);
var pixelx=constrain(floor(x),0,width);
var pixely=constrain(floor(y),0,height);
var pixelcolor=photo.get(pixelx,pixely); //calling each pixel color
noStroke();
fill(pixelcolor); //colors of the squares that appear
square(x,y,random(0,5)); // squares that form the image
}
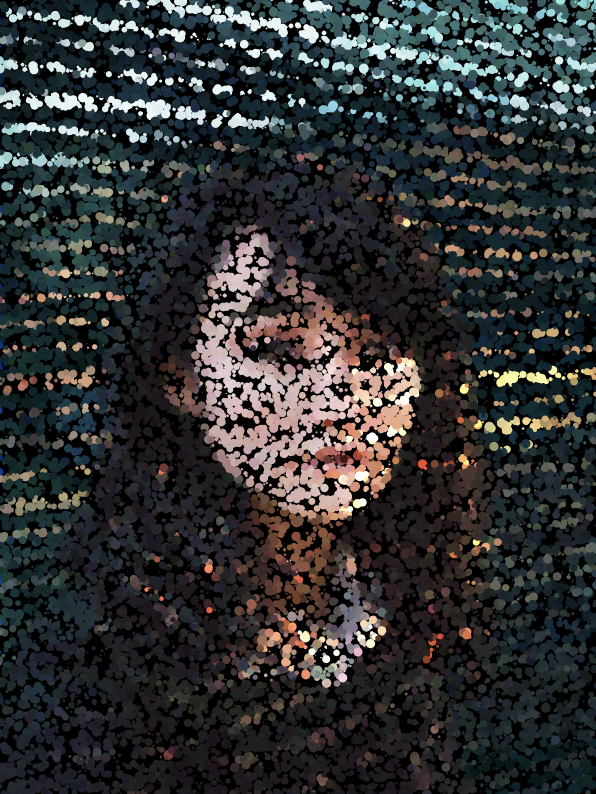
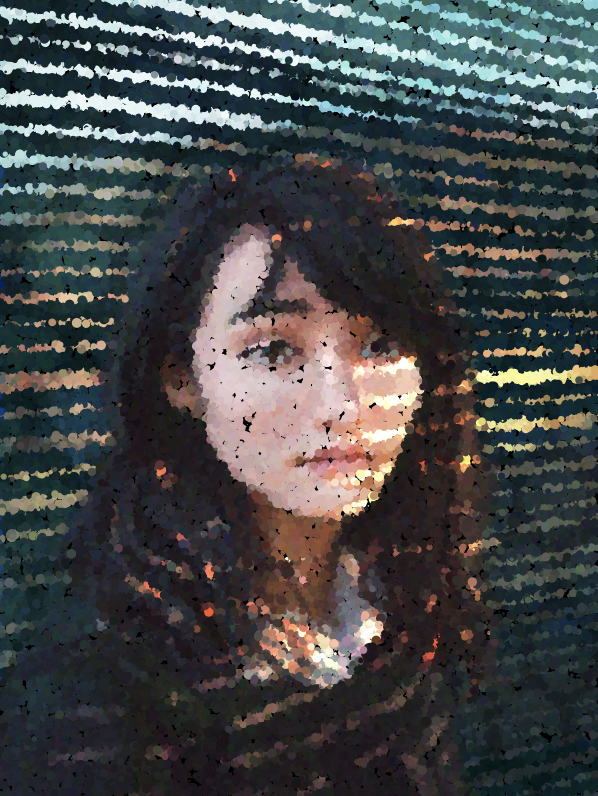
My inspiration for this portait was this painting of a girl submitted by Aliena85 on imagur.com. I thought the strokes that created the background and the sunlight filtering through the blinds would be interesting if they appeared in a stippling colored pixel form. It feels magical as the image starts to form because the specs look like colored dust, and gives the portrait of the girl a glowy quality.
LookingOutwards-09
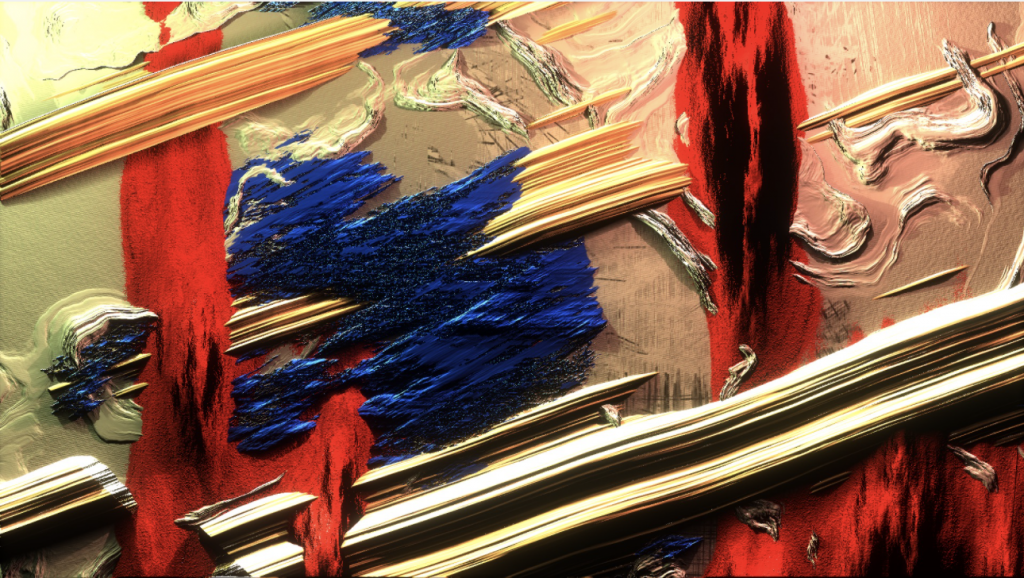
One of my classmates whose post I came across was Rachel Kim’s (rkim) Looking Outwards 04, where she analyzed Kynd and Yu Miyashita collaborative artwork called Expressions. I liked how my classmate gave thoughtful insight about how the artist used thick and bold paint as inspirations for creating 2D and 3D graphics. I agree that the artwork is interesting, especially because there is a play with light and shadows to create a digitized representation of paint strokes.
From my own observation of the work, I can add on to the conversation that the variation in texture and intersecting strokes create a visually harmonious and balanced composition which is pleasing to the eye. The use of light and shadows is what makes the artwork appear like oil paint, which is very unique.
LookingOutwards-08
One of the talks I watched for this week’s looking outwards is Adam Harvey’s (link to his site: https://ahprojects.com/) Face Recognition and Datasets (https://vimeo.com/354276111). He is an American artist and researcher who graduated from the Interactive Telecommunications Program at New York University and previously studied engineering and photojournalism at Pennsylvania State University. His work involves camouflage from face recognition and camouflage from thermal cameras, and he is based in Berlin. He did a wifi geolocation spoofing project and also used computer vision software for a company called Syrian Archive, to detect illegal ammunition with scannable synthetic data. Another one of his projects is MegaPixels, which uses data sets to build algorithms. One concept he discusses in his talk is “media in the wild” which means that no one knows who’s own facial information is in the data set, and who’s features may be included for facial recognition software. I found that to be interesting and mysterious to think about. Furthermore, the way that Harvey presents is powerful because he uses many visuals and graphics. His pacing is clear and spoken in simple terms for people to understand. In my presentations in the future I want to apply some of these skills of being clear and concise as well.
LookingOutwards-07
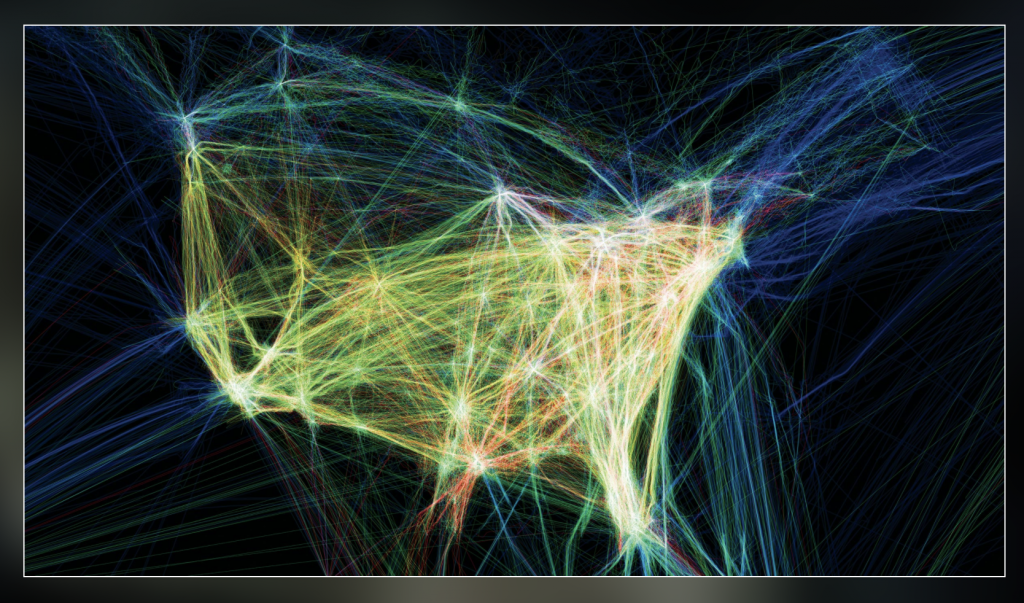
For this week’s Looking Outwards on the topic of informational visualization, I decided to look at the works by Aaron Koblin, and in particular, I was drawn to his Flight Patterns visualization (http://www.aaronkoblin.com/project/flight-patterns/). In this project, he took many data values and mapped out the paths of air traffic across North America. The visualization is abstracted to show strings of moving, glowing lines showing the progression and density of flight routes. When there is high air traffic and many routes intersect, the lines seem to glow at the intersection point. When the supposed “planes” travel away from each other, the movement fades out. To make this computational visualization, Koblin worked with his colleagues and plotted the data using the Processing programming environment. For the algorithms themselves, I think there is a component of controlling the amount of brightness of the lines. When they come in close proximity, they glow brighter, and this effect would have been created using conditionals and loop statements. I think the artist was able to take the shape of North America and make that appear obvious in the final product through creating color boundaries that show the distinction between “land” and “sea” spaces. I find this work really interesting, and it reminded me of a similar map that I was shown in my global history class, which mapped out the traffic patterns of slave ships to America over time.
Project 07- Curves
//Shruti Prasanth
//Section C
//Project 07 Curves
var numPoints = 400;
function setup() {
createCanvas(480, 480);
}
function draw() {
background(105,179,183); //BLUE background
for (var x = 80; x <= 460; x += 80) { //number of elements in the grid
for (var y = 80; y <= 460; y += 80) {
push();
translate(x, y);
HypocycloidPedal();
pop();
}
}
}
function HypocycloidPedal() {
//radius
var a = map(mouseX, 0, 480, 0, 120);
var b = map(mouseX, 0, 480, 0, 120);
strokeWeight(mouseY/50, mouseX/50); //change in stroke thickness
stroke(255); //WHITE
noFill();
beginShape();
for (var i=0; i<numPoints; i++) {
var angle = map(i, 0, 100, 0, TWO_PI);
var n = 8; //number of petals
x = a * (((n-1) * cos(angle)) + (cos((n-1) * angle)) );
y = a * (((n-1) * sin(angle)) - (sin((n-1) * angle)) );
vertex(x, y);
}
endShape();
}
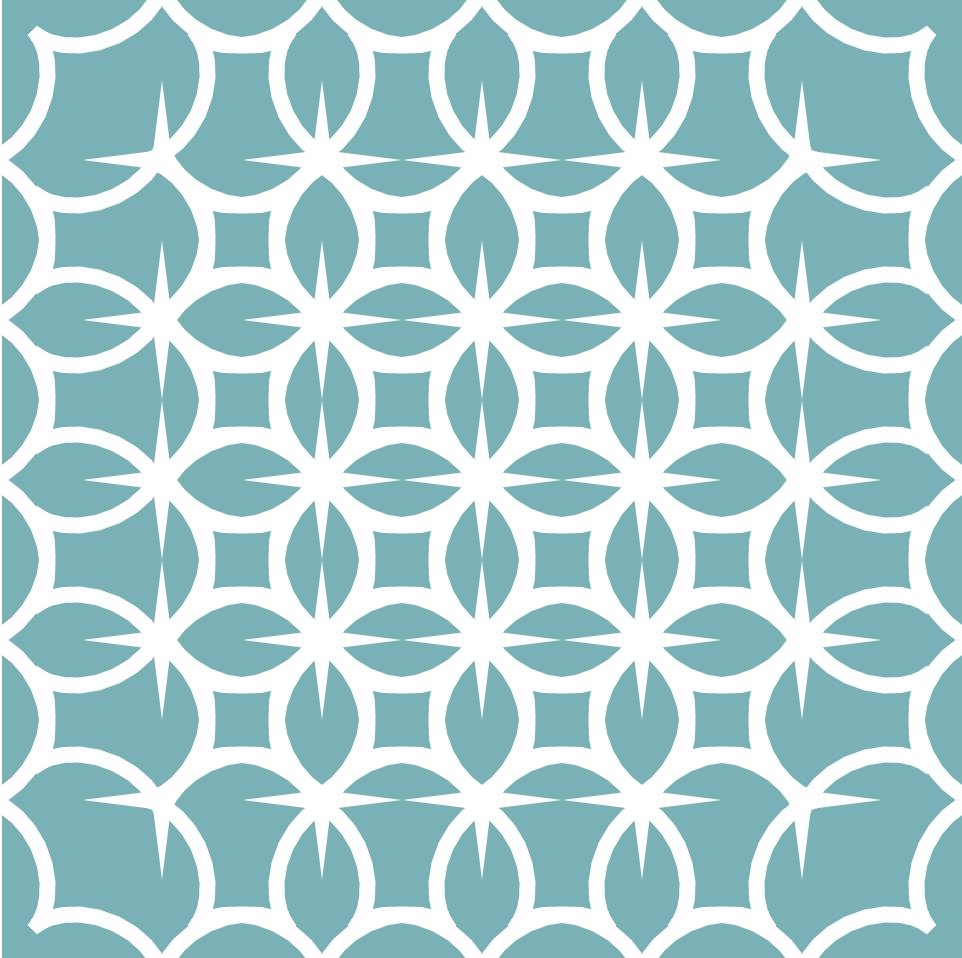
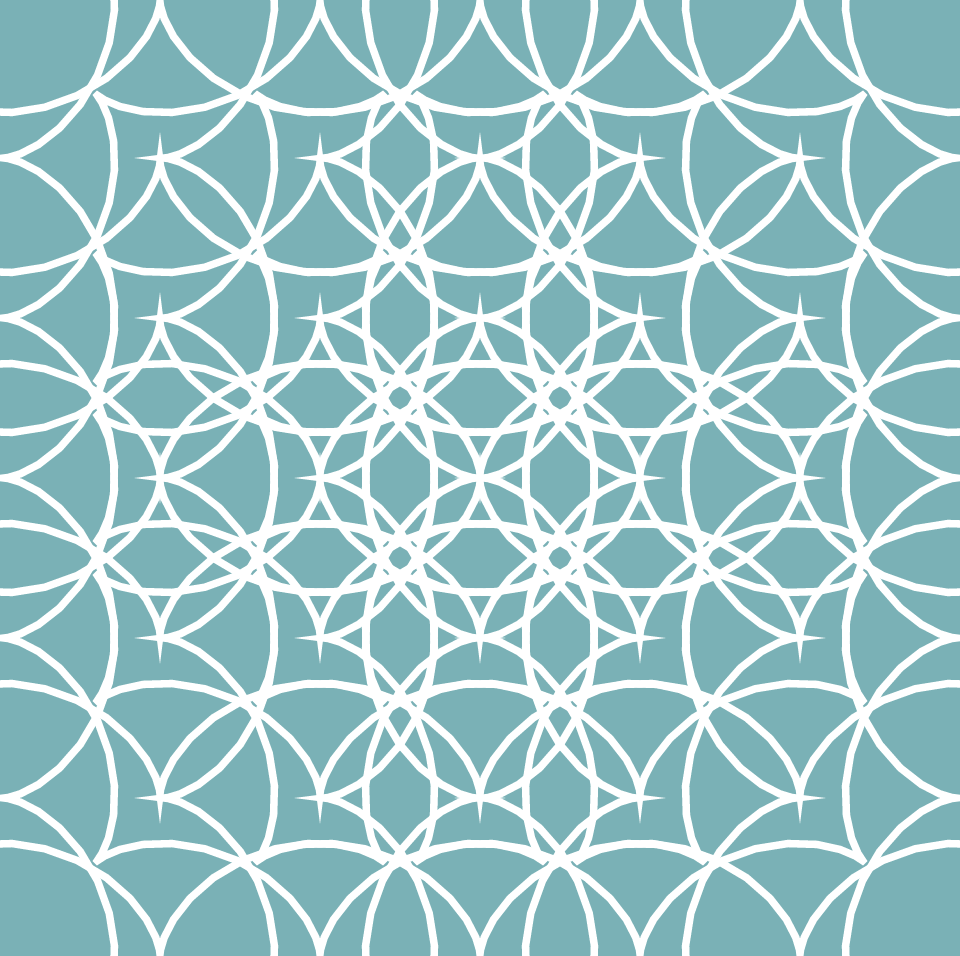
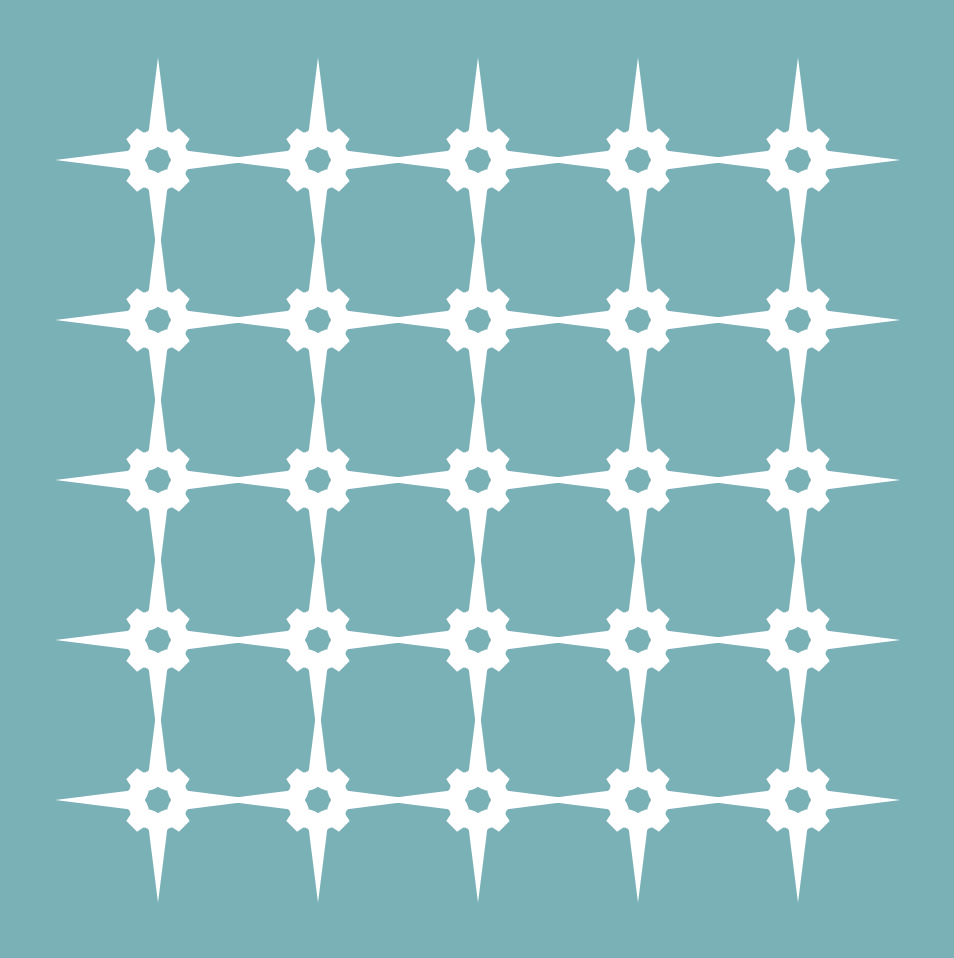
For my project I was inspired by ornate printed patterns and mosaics. I wanted to make something that formed interesting shapes when the curves intersected and dynamically changed. Here are some of the screenshots of the different patterns that are created when you move your mouse around the canvas:
Looking Outwards -06
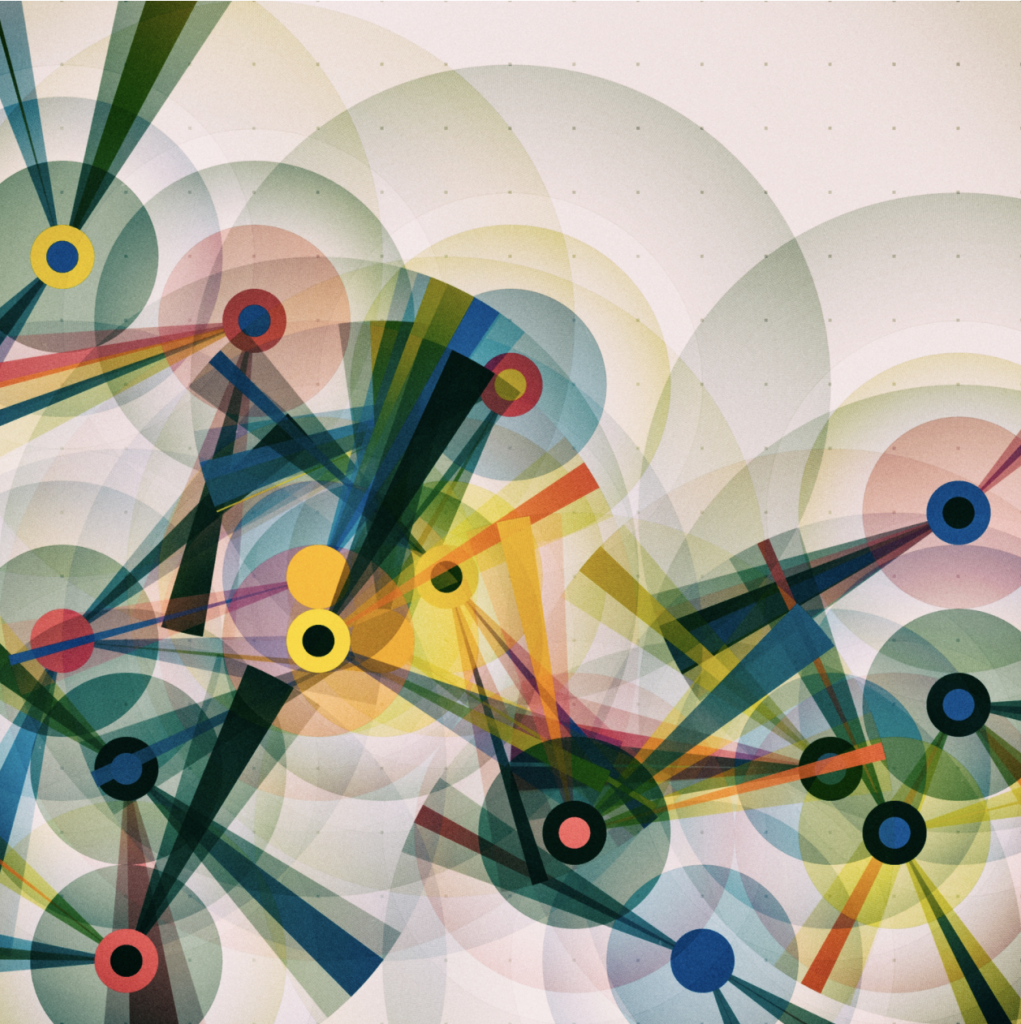
For this week’s Looking Outwards, I chose to look at the work titled “bbccclll” by Manolo Gamboa Naon (https://www.behance.net/gallery/66986781/bbccclll) . In this piece of generative art, the aspects that I admire about it are the color schemes, and the way the beams of color sprout in random directions from the centers of the dots. Additionally, I like how the opacities are layered and create an overlapping effect for the shapes. In this work, the aspects of randomness are probably the colors of the center dots. They range from shades of red, yellow and blue and I feel like that is controlled by restricting the range of the r,g,b values for the colors of the circles. For each of the circles there are also multiple rings around it and the diameters and thicknesses were also probably randomized as well. I like how the artist used simple overlapping geometries to create an interesting abstract piece, and I think the artist would have been inspired by something blossoming, or exploding, and something colorful, for example fireworks. Starting form centers and bursting out is the effect that the artist was able to create, and the random changes in thickness and color are what helped produce an interesting, surprising result.
Project 06- Abstract Clock
//Shruti Prasanth
//Section C
//Project 6 - Abstract Clock
function setup() {
createCanvas(480, 480);
}
function draw() {
push();
background(175, 298, 173); //mint green
translate(width / 2, height / 2); //origin now center canvas
pop();
var s = second();
var m = minute();
var h = hour();
let sAngle = map(s, 0, 60, 0, 360);
let mAngle = map(m, 0, 60, 0, 360);
let hAngle = map(h, 0, 24, 0, 360);
translate(width / 2, height / 2);
//drawing the second hand ring
fill(255);
noStroke();
push();
for (var i = 0; i < s; i ++){
rotate(radians(sAngle)); //creates a pattern based on current second
ellipse(0, -200, 20, 20);
}
pop();
//drawing the minute hand ring
push();
fill(207, 187, 208); //purple
for (var j = 0; j < m; j ++){
rotate(radians(mAngle)); // pattern based on what minute it is
ellipse(0, -130, 30, 30);
}
pop();
//the hour hand ring
push();
fill(43, 97, 109);
for (var k = 0; k < h; k ++){
rotate(radians(hAngle)); // pattern based on hour
ellipse(0, -50, 40, 40);
}
pop();
// drawing the middle clover
circle(0,0,20);
circle(0,15,20);
circle(0,-15,20);
circle(15,0,20);
circle(-15,0,20);
}
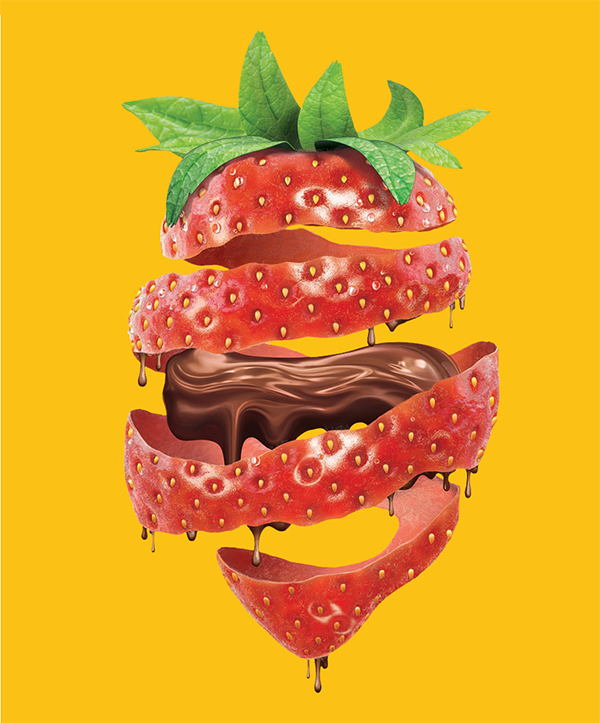
Looking Outwards – 05
For this week’s Looking Outwards on the topic of 3D computer graphics, I chose to look at the artwork titled Strawberry (https://www.behance.net/gallery/4114195/Strawberry) by the artist Wagner de Souza. I came across his work looking on Pinterest, and I found it really unique and interesting because he 3D mapped the proportions and form of the strawberry, then deconstructed it and created additional graphics. I like the aspect of how the strawberry almost “unravels” and reveals the chocolate, and it gives me a sense of how a strawberry might look if its outer layer were peeled. In terms of the algorithms, I think that de Souza used mapping techniques to plot coordinates in space. He also used the seeds on the strawberry as guiding coordinates. Additionally, I like how he incorporated shadows in the final strawberry rendering to give the effect of it realistically twisting, which was probably generated by creating a drop shadow or gradient. I think the artist would have thought about a strawberry and ways to deconstruct the form, and this led him to produce what he envisioned. He brought out his creativity with the chocolate added to it, and it dripping off the spiraling strawberry layers. While this overall image isn’t actually a believable thing that could happen, it is interesting to me to think of the process of imagining this in 3D, and using code to produce it.