![[OLD FALL 2020] 15-104 • Introduction to Computing for Creative Practice](https://courses.ideate.cmu.edu/15-104/f2020/wp-content/uploads/2021/09/stop-banner.png)
Fernanda Viegas, Wind Map, 2012.
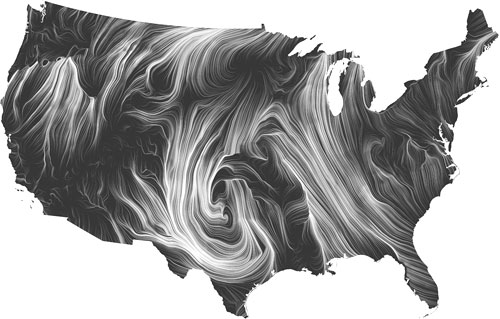
This project creates a real-time, or a “living portrait”, wind map of the United States during the winter months and uses the data to visualize an art piece in the process. The project uses motion of white lines over a black map of the U.S. to show the wind motions and heaviness by layering the white wind lines.
Viegas notes that while it was an artistic endeavor originally, the map provides a variety of functions where people have used it for bird migration patterns, bicyclists, etc. Viegas uses data for this project from the National Digital Forecast Database and combines it with computational circulations that project the data in an abstracted, artistic way. The Wind Map uses “comet-like trails” to show the motion of the wind lines. The map is made entirely in HTML and JavaScript.
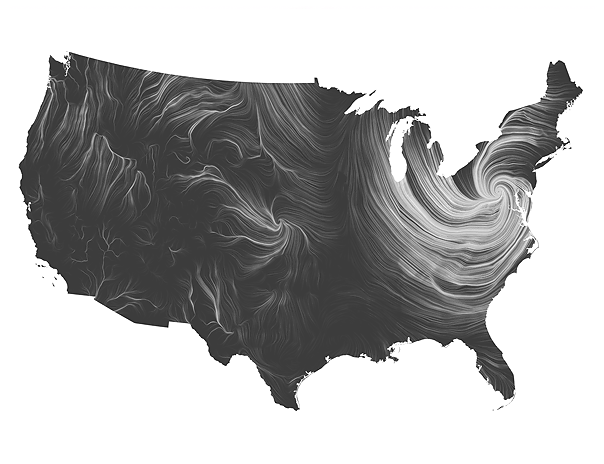
This project is successful in its multi-purpose presentation of wind data in the U.S. and its additional artistic purpose. Computationally creating the Wind Map creates a direct way to have updates to the data sets as the wind directions, intensity, etc. changes from day to day. This conveys accurate data for the day but also creates an art piece that is mesmerizing because of its constant movement. The Wind Map additionally impressively communicates the forecast data in a simplistic and easy to understand map consisting of two main elements; the base map and the wind lines.