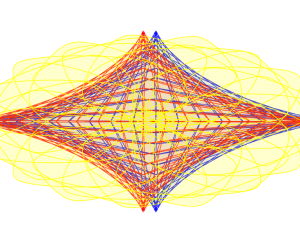
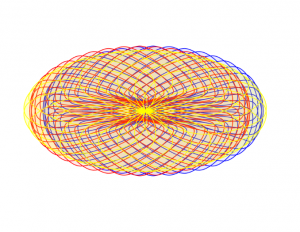
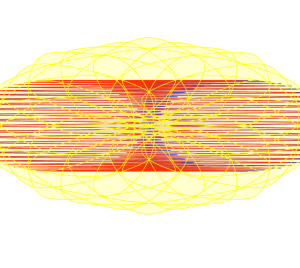
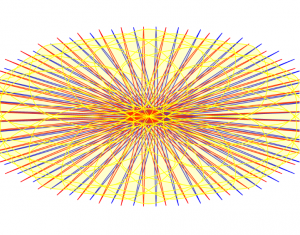
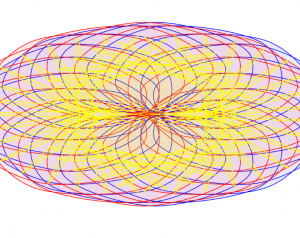
I used a series of three hypocycloid curves (based on the hypocycloid pedal formula) to model an interactive color wheel. I wanted to juxtapose the complex curves and forms with the simplicity of primary colors.
colorwheel
var nPoints = 100	//number of points in each curve

function setup() {
    createCanvas(480, 480);
}

function draw() {
	var halfWide = width/2
	var halfTall = height/2
	background('white')
	push();
	translate(halfWide+10, halfTall)	//move center of curves to center of canvas, offset by 10 tp create overlap later
	HypocycloidBlueCurve()	//draw blue curve
	pop();
	translate(halfWide-10, halfTall);	//move center of curves to center of canvas but offset the other way so overlaps with blue
	HypocycloidCurve()	//draw red curve
	translate(5, 0)	//move back to true canvas center to draw yellow curve over both red and blue
	HypocycloidYellowCurve()	//draw yellow curve
}

function HypocycloidCurve(){
    var a1 = constrain(mouseY, 0, 300, 150, 180); //size changes as vertical mouse position changes
    var b1 = 45;
    var n1 = int(mouseY / 6)	//number of cusps of the curve varies with vertical mouse position

    stroke('red');	//change stroke color to red
    strokeWeight(1);
    fill(255, 0, 0, 20);	//change fill to transparent red

    //create curve, using https://mathworld.wolfram.com/HypocycloidPedalCurve.html base formula for Hypocycloid Pedal Curve
    //map points of curve to circle
    beginShape();
    for (var i = 0; i < nPoints; i++) {
        var theta = map(i, 0, nPoints, 0, TWO_PI);
        var x1 = a1*(((n1-2)*(cos(theta)-cos((1-n1)*theta)))/(2*n1))
        var y1 = a1*(((n1-2)*(cos(theta*(1-0.5*n1))*sin(0.5*n1*theta)))/(2*n1))
        curveVertex(x1, y1);
    }
    endShape(CLOSE);
}

//draw blue hypocycloid, same as red but in blue
function HypocycloidBlueCurve(){
    var a1 = constrain(mouseY, 0, 300, 150, 180); //size changes as vertical mouse position changes
    var b1 = 45;
    var n1 = int(mouseY / 6)	//number of cusps of the curve varies with vertical mouse position
    fill(0, 0, 255, 20)	//fill transparent blye
    stroke('blue');	//set stroke color to blue
    strokeWeight(1);
    //create curve, using https://mathworld.wolfram.com/HypocycloidPedalCurve.html base formula for Hypocycloid Pedal Curve
    //map points of curve to circle
    beginShape();
    for (var i = 0; i < nPoints; i++) {
        var theta = map(i, 0, nPoints, 0, TWO_PI);
        var x1 = a1*(((n1-2)*(cos(theta)-cos((1-n1)*theta)))/(2*n1))
        var y1 = a1*(((n1-2)*(cos(theta*(1-0.5*n1))*sin(0.5*n1*theta)))/(2*n1))
        curveVertex(x1, y1);
    }
    endShape(CLOSE);
}
//draw yellow hypocycloid
function HypocycloidYellowCurve(){
    var a1 = constrain(mouseY, 0, 300, 150, 180); //size changes as vertical mouse position changes
    var b1 = 45;
    var n1 = int(mouseY / 10)	//number of cusps of the curve varies with vertical mouse position
    fill(255, 255, 0, 50)	//set fill color to a transparent yellow
    stroke('yellow');	//set stroke color to yellow
    strokeWeight(1);
	//create curve, using https://mathworld.wolfram.com/HypocycloidPedalCurve.html base formula for Hypocycloid Pedal Curve
    //map points of curve to circle
    beginShape();
    for (var i = 0; i < nPoints; i++) {
        var theta = map(i, 0, nPoints, 0, TWO_PI);
        var x1 = a1*(((n1-2)*(cos(theta)-cos((1-n1)*theta)))/(2*n1))
        var y1 = a1*(((n1-2)*(cos(theta*(1-0.5*n1))*sin(0.5*n1*theta)))/(2*n1))
        curveVertex(x1, y1);
    }
    endShape(CLOSE);
}![[OLD FALL 2020] 15-104 • Introduction to Computing for Creative Practice](https://courses.ideate.cmu.edu/15-104/f2020/wp-content/uploads/2021/09/stop-banner.png)
