![[OLD FALL 2020] 15-104 • Introduction to Computing for Creative Practice](../../../../wp-content/uploads/2021/09/stop-banner.png)
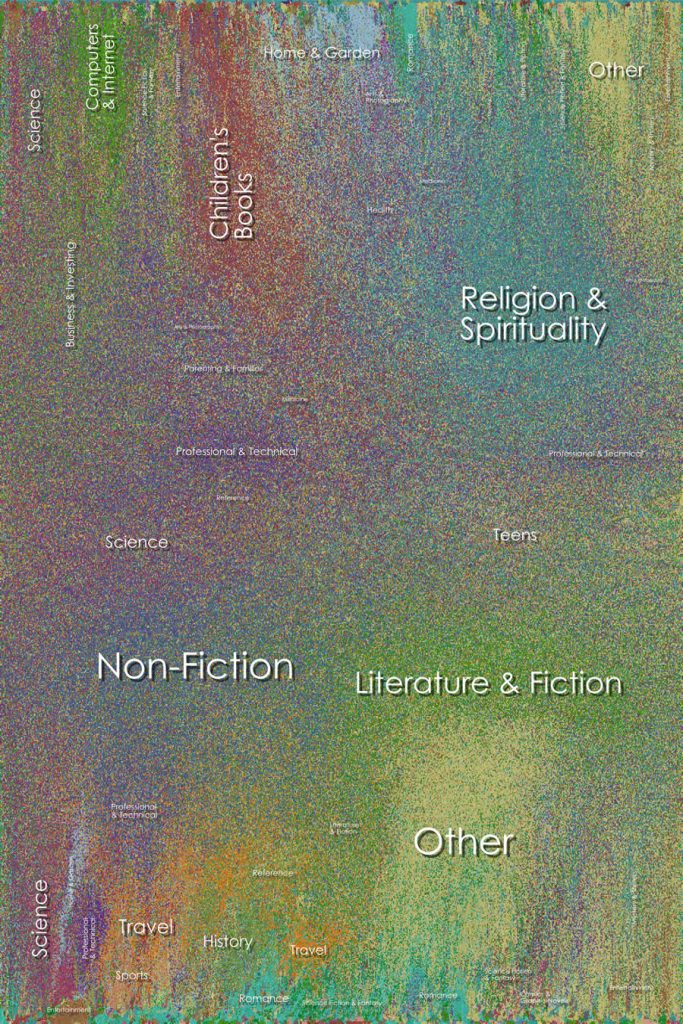
For this LO, I looked at Chris Harrisons data visulazation on amazon books. In the project he let his computer run an automated algorithm based on title, topic, and relevance to each other. This allows for similar books to “cluster” and create a more solid color. What I thought was interesting is how he mentions through each iteration, the books that are more and more similar will then begin to attract to one another, thus the more time provided equals a more coherent data graph. But due to the sheer sample size of the project, 700,000 books, Chris stated that it would have taken too much memory for the computer to run. Thus emphasizing the sheer physical space it takes to process data with a large sample group. What I thought was the most intriguing aspect of the project is the resulting color field as it creates such a unique gradient that almost seems like some form of abstract pixel art.