![[OLD FALL 2020] 15-104 • Introduction to Computing for Creative Practice](../../../../wp-content/uploads/2021/09/stop-banner.png)
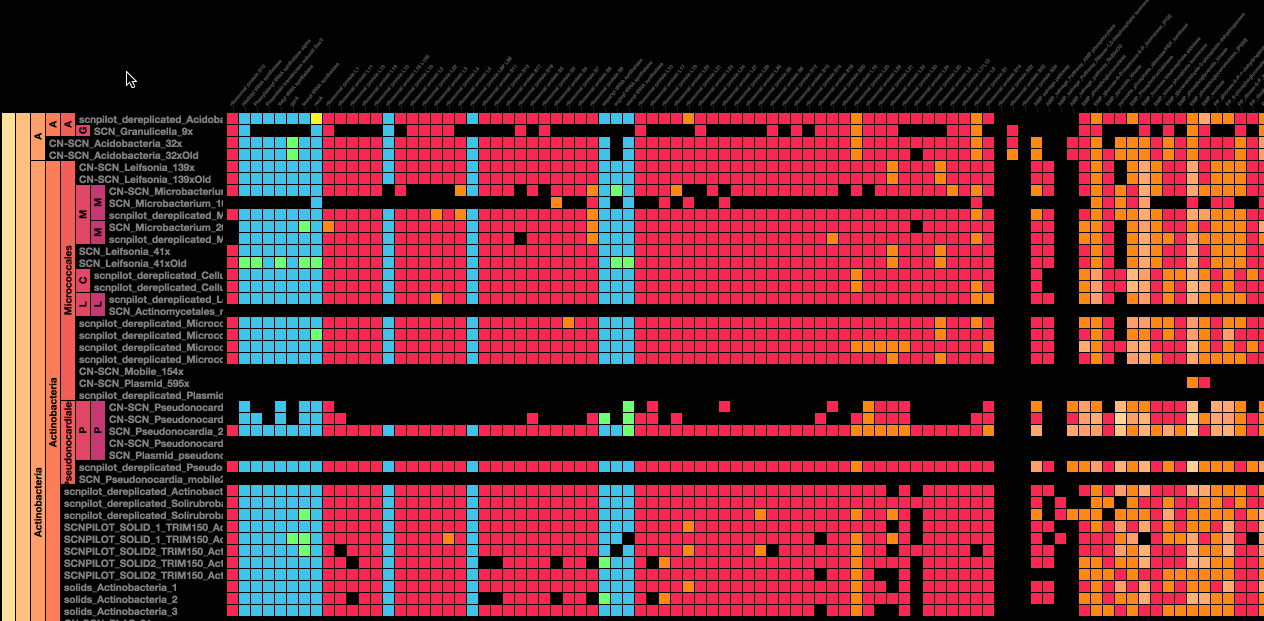
A work of computational information visualization that I find intriguing is Stamen Design’s “Metagenomics with the Banfield Lab.” This project came about when the Banfield Lab asked Stamen Design to visualize their data about gene sequences in an ecosystem. I admire the clarity of the visual result because it takes what would normally be considered complex data and arranges it in a way that is easy to access and read. I suppose that the artwork was generated by sorting the data into a matrix and visualizing the data as squares. Stamen Design’s artistic sensibilities are manifested in the final form because they created a clear and readable visualization of data while being visually interesting.