![[OLD FALL 2020] 15-104 • Introduction to Computing for Creative Practice](https://courses.ideate.cmu.edu/15-104/f2020/wp-content/uploads/2021/09/stop-banner.png)
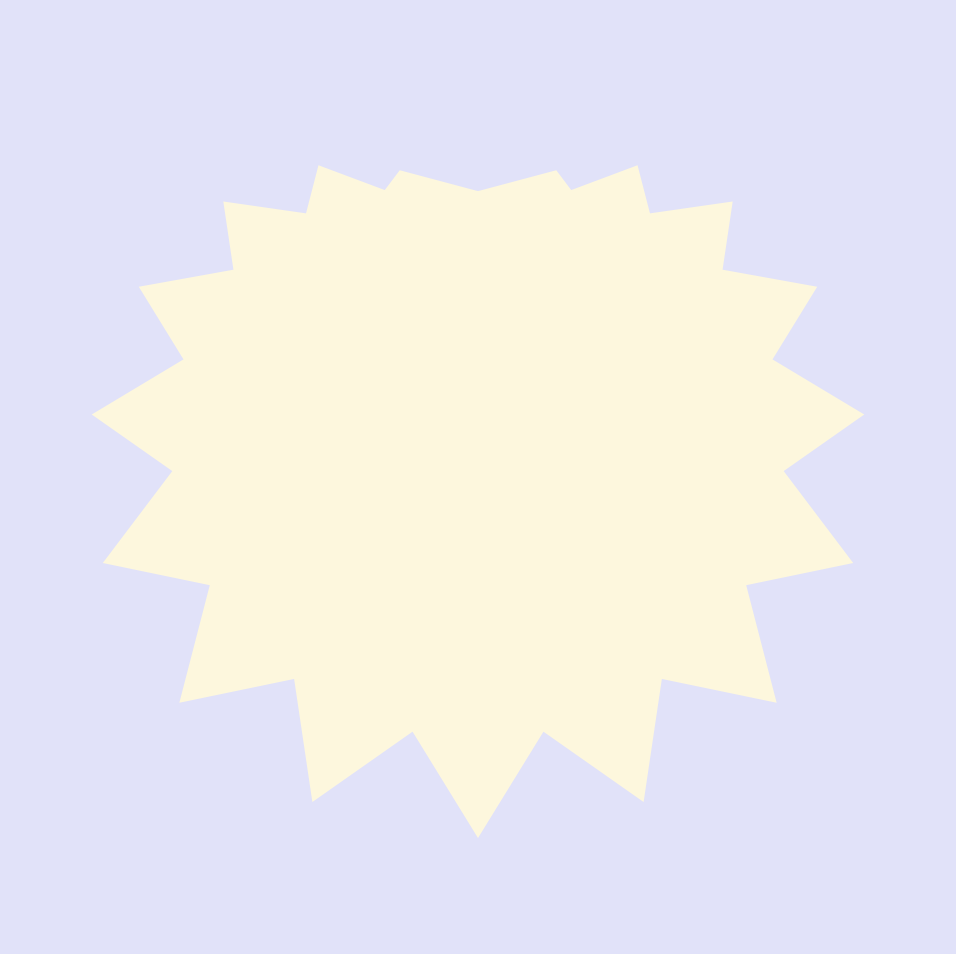
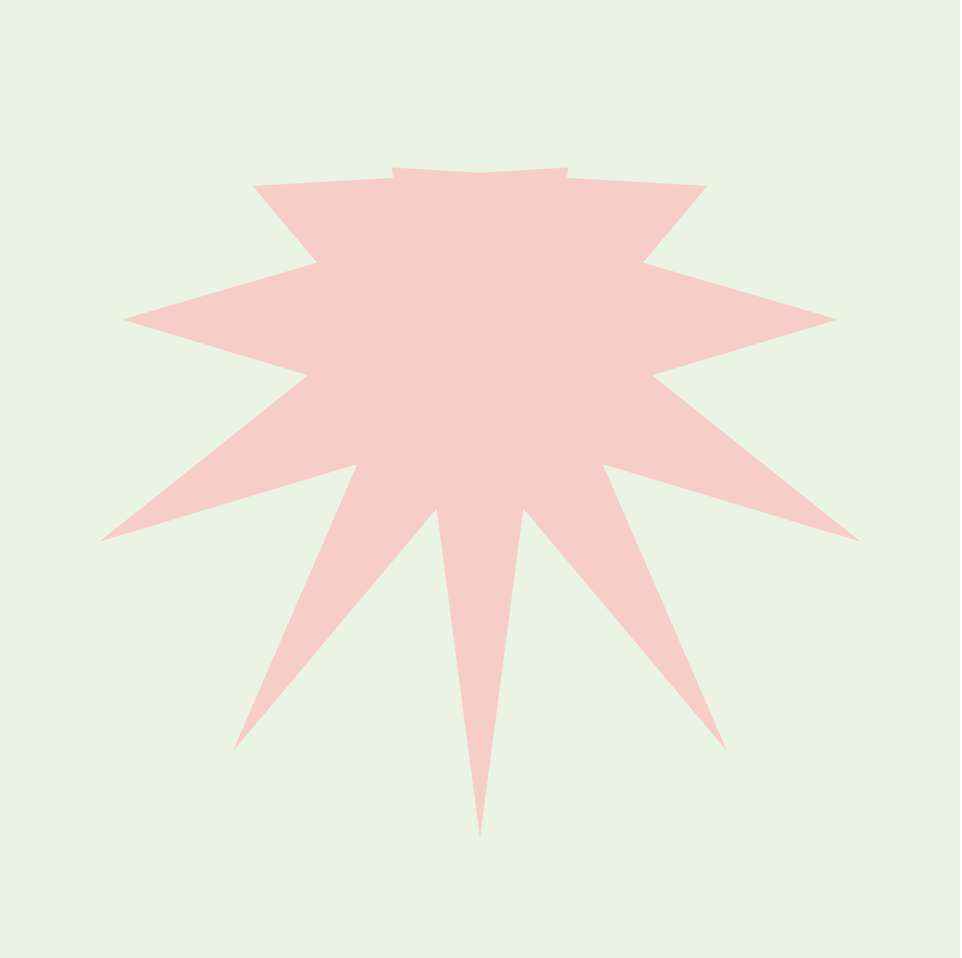
I was really drawn to the rounded curves of the Cardioid and wanted to see how much I could alter this shape based on my mouse’s position. Based on your mouse’s position on the canvas, the Cardioid will change in shape and color.
curves
var nPoints = 100;
var CARDIOID = 0;
var curveMode = CARDIOID;

function setup() {
    createCanvas(480, 480);
    noStroke();
    frameRate(20);
    pinkColor = color(255, 179, 184);
    paleGreen = color(236, 255, 214);
    paleBlue = color(224, 222, 255);
    yellowColor = color(254, 255, 222);
}

function draw() {
    //change color of background depending on MouseY
    let changeBG = map(mouseY, 0, height, 0, 1);
    var changeColor = lerpColor(paleGreen, paleBlue, changeBG);
    background(changeColor);

    //drawing the cardioid
    push();
    rotate(-(PI/2.0));
    translate(-width/4.0, height/2);
    switch (curveMode) {
        case CARDIOID:
            drawCardioidCurve();
            break;
    }
    pop();
}

function drawCardioidCurve() {
    //Cardioid: https://mathworld.wolfram.com/Cardioid.html
    //x = a cos t(1 - cos t)
    //y = a sing t(1 - cos t)

    var x;
    var y;
    var a = 150.0;
    var stifleMouse = constrain(mouseX/2.5, 0, width);

    //changing cardioid color
    let changeShape = map(mouseY, 0, height, 0, 1);
    var shapeColor = lerpColor(pinkColor, yellowColor, changeShape);
    fill(shapeColor);

    //cardioid shape
    beginShape();
    for (var i = 0; i < nPoints; i++) {
        var t = map(i, stifleMouse, nPoints, 0, TWO_PI);
        x = a * cos(t) * (1 - cos(t));
        y = a * sin(t) * (1 - cos(t));
        vertex(x, y);
    }
    endShape(CLOSE);
}