/* Evan Stuhlfire
* estuhlfi@andrew.cmu.edu Section B
* Project-07: Composition with Curves
* Hypocycloid Spirograph */
var rAngle = 30; // rotation angle
var rotation = 0; // degrees of rotation
var maxShapes = 8;
var shape = []; // array of shapes
function setup() {
createCanvas(480, 480);
background(250);
// fill array of objects with default shapes
createShapes();
}
function draw() {
// redraw background
background(250);
stroke(200);
// map the mouseX position to a circle for rotation radians
var xRot = map(mouseX, 0, width, 0, TWO_PI);
// map the mouseY to half the height to size the shape
var my = map(mouseY, 0, height, 50, height/2);
// r is based on the y position and becomes the radius of the circle
var r = constrain(my, 100, height/2 - 75);
// add text to canvas
addText();
push(); // store settings
// translate origin to center
translate(width/2, height/2);
// draw the small circles and their curves
for(var s = 0; s < shape.length; s++) {
drawSmallShapes(s, height/2 - 25);
}
// rotate the canvas based on the mouseX position
rotate(xRot);
circle(0, 0, 2 * r);
// loop over array of shape objects
for(var s = 0; s < shape.length; s++) {
// drawSmallShapes(s, maxr);
// reset degrees of rotation for each shape
rotation = 0;
if(shape[s].on == true){
// draw the curve in spirograph, 4 times for curve rotation
for(var i = 0; i < 4; i++) {
// rotation canvas, start at 0
rotate(radians(rotation));
rotation = rAngle;
drawCurves(shape[s].verts, r, shape[s].color);
}
}
}
pop(); // restore settings
}
function mousePressed() {
// when a shape is clicked it is added or removed
// from the spirograph, toggles like a button
// map the mouse position to the translated canvas
var mx = map(mouseX, 0, width, -240, 240);
var my = map(mouseY, 0, height, -240, 240);
// loop through shapes to see if clicked
for(var i = 0; i < shape.length; i++) {
var d = dist(shape[i].px, shape[i].py, mx, my);
// check distance mouse click from center of a shape
if(d <= shape[i].radius){
// if on, set to false
if(shape[i].on == true) {
shape[i].on = false;
} else {
// if on = false, set true
shape[i].on = true;
}
}
}
}
function addText() {
// Add text to canvas
fill(shape[0].colorB);
strokeWeight(.1);
textAlign(CENTER, CENTER);
// title at top
textSize(20);
text("Hypocycloid", width/2, 8);
text("Spirograph", width/2, 30);
// directions at bottom
textSize(10);
text("Click the circles to toggle curves on or off. Reload for different pen colors.",
width/2, height - 5);
noFill();
strokeWeight(1);
}
function createShapes() {
var vCount = 3; // start shapes with 3 verticies
var sOn = true; // default first shape to show in spirograph
var angle = 30;
var shapeRad = 35;
// create array of shape objects
for(var i = 0; i < maxShapes; i++) {
shape[i] = new Object();
// set object values
shape[i].verts = vCount;
// generate random color Bright and Dull for each
var r = random(255);
var g = random(255);
var b = random(255);
shape[i].colorB = color(r, g, b, 255); // Bright color
shape[i].colorM = color(r, g, b, 80); // Muted faded color
shape[i].color = shape[i].colorM;
shape[i].angle = angle;
shape[i].px = 0;
shape[i].px = 0;
shape[i].radius = shapeRad;
shape[i].on = sOn;
// default shapes to not display in spirograph
sOn = false;
vCount++;
angle += 30;
if (angle == 90 || angle == 180 || angle == 270) {
angle += 30;
}
}
}
function drawSmallShapes(s, r) {
// calculate the parametric x and y
var px = r * cos(radians(shape[s].angle));
var py = r * sin(radians(shape[s].angle));
shape[s].px = px;
shape[s].py = py;
// map the mouse position to the translated canvas
var mx = map(mouseX, 0, width, -240, 240);
var my = map(mouseY, 0, height, -240, 240);
// check if mouse is hovering over small circle
var d = dist(shape[s].px, shape[s].py, mx, my);
if(d <= shape[s].radius) {
// hovering, make bigger, make brighter
var hover = 1.25;
shape[s].color = shape[s].colorB;
} else {
// not hovering, make normal size, mute color
var hover = 1;
shape[s].color = shape[s].colorM;
}
// check if shape is appearing in spriograph
if(shape[s].on == true) {
var c = shape[s].colorB; // bright
} else {
var c = shape[s].colorM; // muted
}
push();
// move origin to little circle center
translate(px, py);
stroke(c); // set color from object
strokeWeight(2);
circle(0, 0, shape[s].radius * 2 * hover); // draw little circle
// draw the curve in the little circle
drawCurves(shape[s].verts, shape[s].radius * hover, c)
pop();
}
function drawCurves(n, r, c) {
// n = number of shape verticies, r = radius, c = color
// number of vertices for drawing with beginShape
var nPoints = 50;
beginShape();
for(var i = 0; i < nPoints; i++) {
// map the number of points to a circle
var t = map(i, 0, nPoints, 0, TWO_PI); // t = theta
// fit the shape to the radius of the circle
var value = r/n;
// calculate hypocycloid at a different number of cusps.
var px = value * ((n - 1) * cos(t) - cos((n - 1) * t));
var py = value * ((n - 1) * sin(t) + sin((n - 1) * t));
vertex(px, py); // add a vertex to the shape
}
noFill();
stroke(c);
strokeWeight(1);
endShape(CLOSE); // close shape
}
Category: SectionB
Looking Outward 07
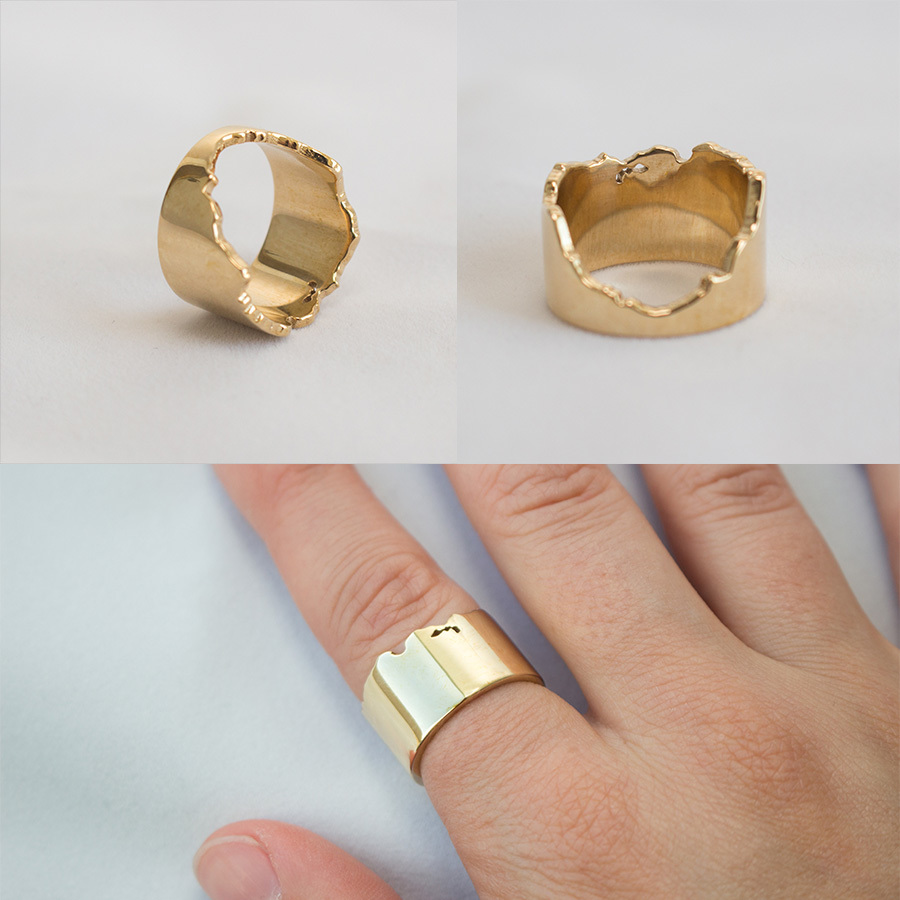
Rachel Binx, CA Coastline Ring, 2016
For this week’s Looking Outward, I looked at Rachel Binx’s CA Coastline Ring. In order to create the work, she appropriated the outline of the California coast, wrapped it into a circle, and used that pattern to create a ring. I find this so interesting because I have an intense curiosity about the interaction between the natural world and artistic practice as a whole: whether this be in medium, subject, or otherwise. I found it clever how Binx decided to cast the ring in gold, considering the history of the gold rush in California. I think that this is a great example of the way in which content can dictate form, and vice versa. In terms of its value as a visualization tool, I’m not sure if it would be recognizable as the coast of California to the average person. That being said, as a personal memento, or even as an object to someone with prior knowledge, I can see the ways in which this ring would more than successfully serve its owner. This unconventional application of the natural world without a doubt peaks my interest.
Looking Outwards 07: Information Visualization
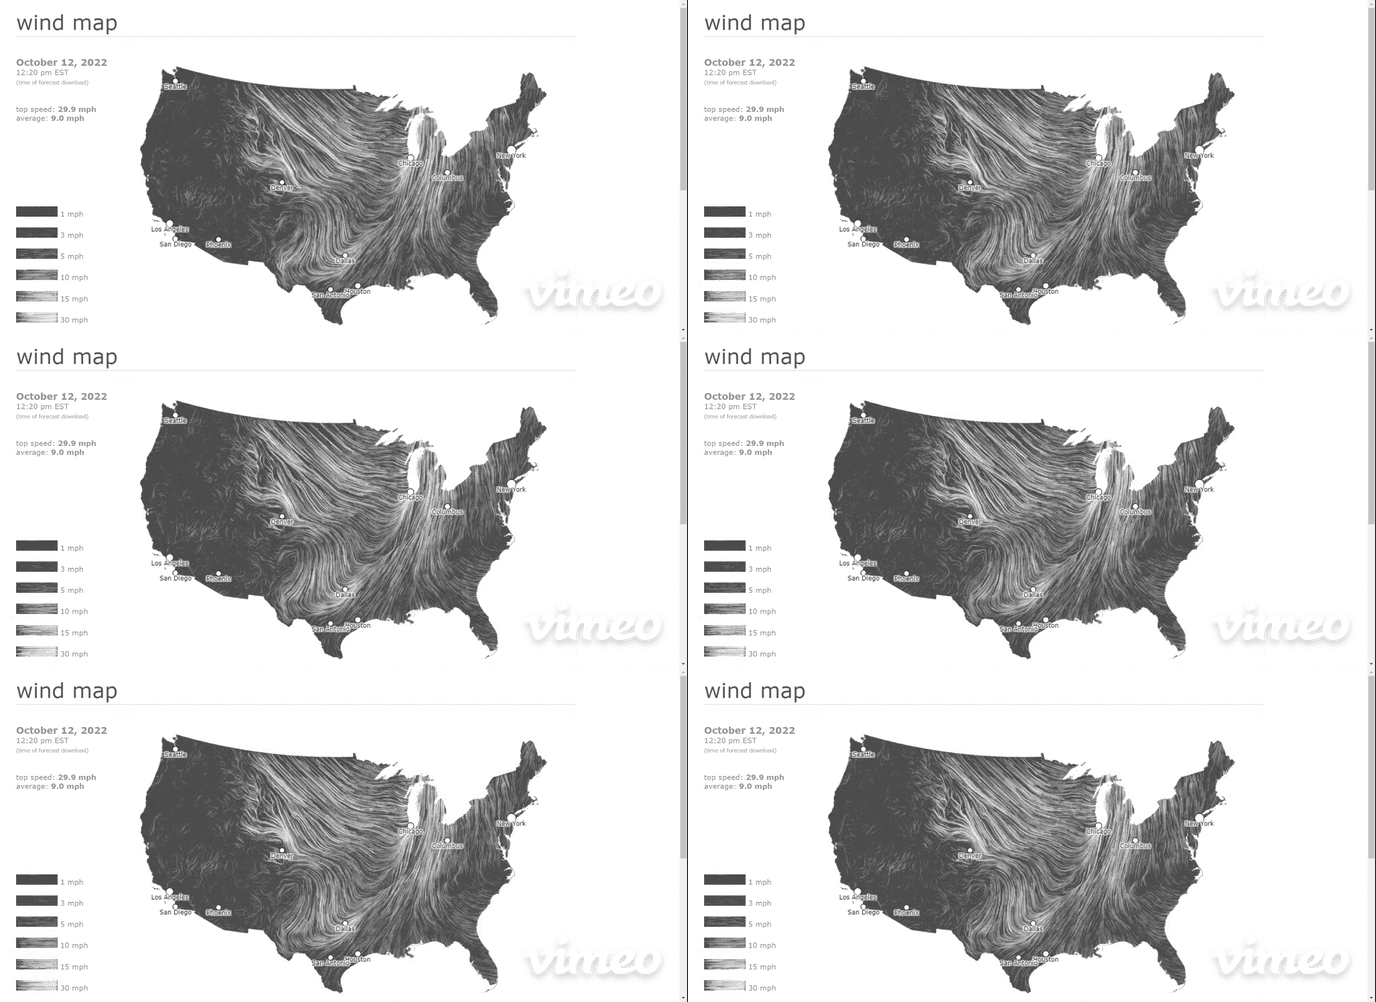
Wind Map is a live visualization of the current direction and wind speeds across the United States. The wind vectors combine to appear almost as smoke churning at different speeds across the country. This project appeals to me visually because it captures the idea of constant change. It can at times be a peaceful flow and at other times it appears agitated and angry. It can appear both ways on the same map depending on where attention is focused.
This project is not limited to weather. It is aesthetically pleasing and useful. It is beautiful and intriguing enough to be on display at the MoMA. At the same time, diverse groups have found its data useful. Birdwatchers have used it to track migration patterns, and cyclists have used it to plan trips. Conspiracy theorists have even used it to track “chemtrails”. This visualization allows this vast, changing dataset to be useful in ways that are impossible with the raw data.
The underlying data for the Wind Map is from the National Digital Forecast Database which provides near term forecasts that are updated once per hour. The visualization was created by Fernanda Viégas and Martin Wattenberg, engineers from the visualization research lab at Google. The entire project is written in html and javascript. A live link to the Wind Map can be found here.
Project 07: Hallucinogenic Roses!
// Ilia Urgen
// Section B
// iurgen@andrew.cmu.edu
// Project-07
function setup() {
createCanvas(480, 480);
}
function draw() {
color_1 = color (189,17,89);
color_2 = color (253,163,26);
// ombre
for (var y = 0; y < height; y++ ) {
n = map (y,0, height, 0, 1);
var color_3 = lerpColor (color_1, color_2, n);
stroke (color_3);
line (0, y, width, y);
}
noFill();
stroke (0);
strokeWeight (0.25);
// canvas border lines
line (1,1,1,width - 1);
line (1,1,width - 1,1);
line (1,width - 1,width - 1,width - 1);
line (width - 1,1,width - 1,width - 1);
// smallest possible x-value of drawing
var x = min (mouseX, width);
// link the curve scale to mouseX
var a0 = map (x, 0, width, 0, 50);
var b0 = map (mouseX, 0, width, 0, 100);
var a1 = map (x, 0, width, 0, 200);
var b1 = map (mouseX, 0, width, 0, 300);
var a2 = map (x, 0, width, 0, 400);
var b2 = map (mouseX, 0, width, 0, 800);
var a3 = map (x, 0, width, 0, 900);
var b3 = map (mouseX, 0, width, 0, 1800);
var a4 = map (x, 0, width, 0, 1900);
var b4 = map (mouseX, 0, width, 0, 3800);
var a5 = map (x, 0, width, 0, 3900);
var b5 = map (mouseX, 0, width, 0, 7800);
var a6 = map (x, 0, width, 0, 7900);
var b6 = map (mouseX, 0, width, 0, 15800);
var a7 = map (x, 0, width, 0, 15900);
var b7 = map (mouseX, 0, width, 0, 31800);
// link the curve rotation to mouseY
var degree = map (mouseY, 0, height, 0, 360);
push();
translate (width/2, height/2);
for (var j = 0; j < degree; j += 3600 / degree) {
rotate (720 / degree);
beginShape();
curveVertex (0, 0);
// draw the complete curves
for (var i = -10; i < 10; i += 0.3) {
var x0 = a0 * cos (i);
var y0 = b0 * sin (i);
curveVertex (x0, y0);
}
for (var i = -10; i < 10; i += 0.3) {
var x1 = a1 * cos (i);
var y1 = b1 * sin (i);
curveVertex (x1, y1);
}
for (var i = -10; i < 10; i += 0.3) {
var x2 = a2 * cos (i);
var y2 = b2 * sin (i);
curveVertex (x2, y2);
}
for (var i = -10; i < 10; i += 0.3) {
var x3 = a3 * cos (i);
var y3 = b3 * sin (i);
curveVertex (x3, y3);
}
for (var i = -10; i < 10; i += 0.3) {
var x4 = a4 * cos (i);
var y4 = b4 * sin (i);
curveVertex (x4, y4);
}
for (var i = -10; i < 10; i += 0.3) {
var x5 = a5 * cos (i);
var y5 = b5 * sin (i);
curveVertex (x5, y5);
}
for (var i = -10; i < 10; i += 0.3) {
var x6 = a6 * cos (i);
var y6 = b6 * sin (i);
curveVertex (x6, y6);
}
for (var i = -10; i < 10; i += 0.3) {
var x7 = a7 * cos (i);
var y7 = b7 * sin (i);
curveVertex (x7, y7);
}
curveVertex (0, 0);
endShape();
}
pop();
// consistent background lines
line (0, 0, width, height);
line (0, width, height, 0);
line (width/2, 0, width/2, height);
line (0, height/2, width, height/2)
}
Blog 07: “BikeCycle”
By Ilia Urgen
Section B
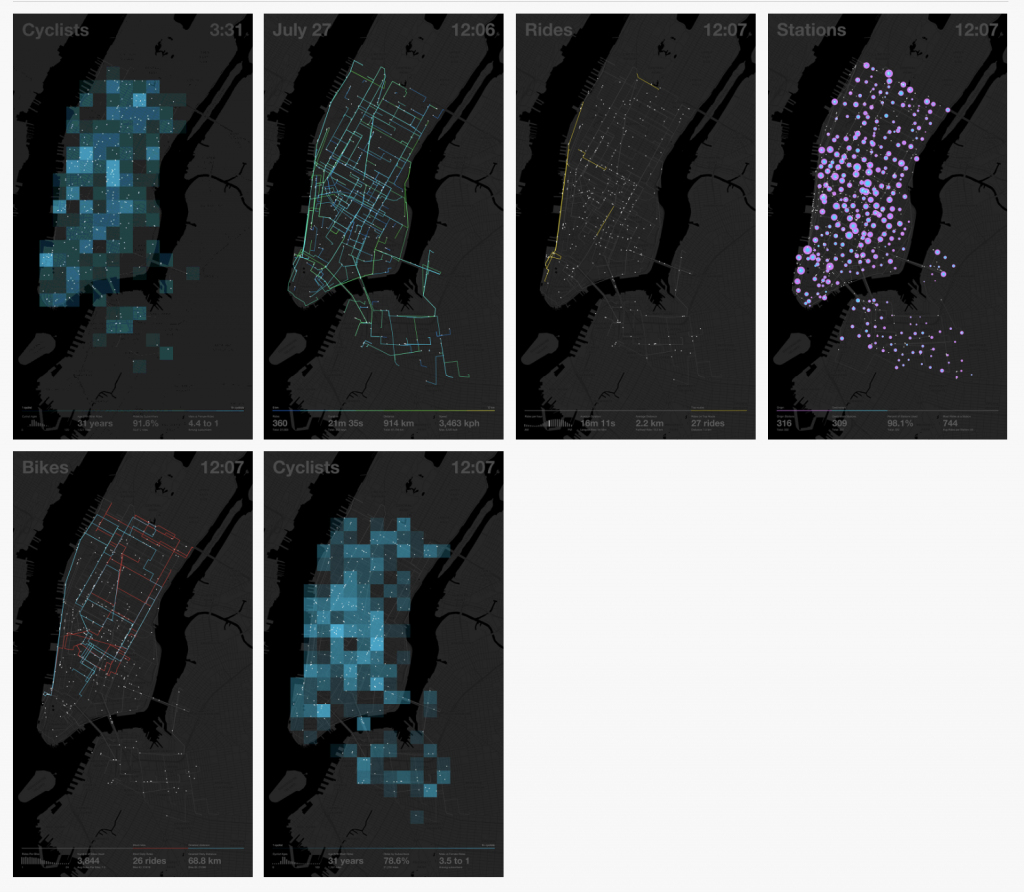
This week, I came across a cool app called BikeCycle. It was developed by Nicholas Felton back in 2014, which is a visual display of everything an avid biker needs. However, this app will only work in New York City, as the coordinates were pinpointed on a map of Manhattan and Queens.
When you launch the app, you can see various interactive REAL-TIME visual maps, which are not limited to bike-sharing locations, different bike routes, cyclist demographics, and density of bikers in a certain area.
I find Felton’s app BikeCycle intriguing because I, myself, am an avid biker! Although I’m from Long Island, NY, and not the city, it’s very interesting to see real-time stats for different biking variables. If I were to go to the city for a ride, the app would help me optimize my bike route, see which areas to avoid, and find popular scenic routes in Manhattan!
Project-07-Curves
A modified hypotrochoid on top of a modified epitrochoid! I reversed x and y in the second vertex function to create the double layered effect.
// Zoe Lin (ID: youlin)
// Section B
var nPoints = 80;
var angle;
var x, y, theta;
var r, g, b;
function setup() {
createCanvas(480, 480);
}
function draw() {
r = map(mouseX, 0, width, 0, 20); //draws bg color based on mouse pos
g = map(mouseY, 0, height, 0, 20);
b = map(mouseX, 0, height, 0, 20);
background(r, g, b);
noFill();
stroke(130);
translate(width/2, height/2);
moddedeEpitrochoid(); //draws first geometry at center
rotate(HALF_PI); //draws second at an angle
moddedeEpitrochoid();
hypotrochoid();
rotate(PI / 3); //repeat at third angle
moddedeEpitrochoid();
hypotrochoid();
function moddedeEpitrochoid() {
var a = 85; //angle
var h = constrain(mouseY / 10, 0, 100); //limits geometry size
var mouse = mouseX / 70;
beginShape();
for (var i = 0; i < nPoints; i++) {
theta = map(i, 0, nPoints, 0, TWO_PI);
//modified formula for epitrochoid
x = (a+a/2) * sin(theta) - cos(mouse + theta * (a + a/2) / a/2) * h;
y = (a+a/2) * cos(theta) - sin(mouse + theta * (a + a/2) / a/2) * h;
vertex(x, y);
vertex(y, x); //layers vertexes, draws 2d geometry
}
endShape();
}
strokeWeight(0.25);
}
function hypotrochoid() {
var h = constrain(mouseX / 100, 205, height); //contrains geometry size
var a = map(mouseX, 0, width, 25, 15); //maps mouse pos to desired angle
var b = map(mouseY, 0, height, 0, 15);
beginShape();
for (var i = 0; i < nPoints-15; i ++) {
var theta2 = map(i, 0, width/2, 0, 50);
//hypotrochoid formula
x = (a - b) * cos(theta2) + h * sin((a - b) * theta2);
y = (a - b) * sin(theta2) - h * cos((a - b) * theta2);
vertex(x, y);
}
endShape();
}
Blog 07 – Data Visualization – srauch
I enjoy these data visualizations of the 2021 summer olympics, conceived by designer Eden Weingart and created by the New York Times graphic department. This one is specifically for swimming, the 400-meter freestyle.
To make these animations, the graphic team created a program that can apply the raw data of the race onto animations, allowing twitter users to see a sped-up version of the race’s events (not just the results!). This raw data included each swimmer’s time for every meter of the race, the time they hit the end of the pool and turned around, and the time they finished. The program then mapped this data onto an animated avatar for each athlete.
I find this approach to sports reporting really cool, since it provides a different way for us to interact with the data of the sport. It can be quite tempting to throw all of the data out the window once we know who won, but an approach such as this allows casual readers to see those intricacies – who led at first, any surprising turnovers, etc. – in a consumable and exciting way.
LO-07: All Streets (2006)
All Streets (2006) is a data visualization map of all streets in the lower 48 United States created by Ben Fry, a new media program developer and computational designer. The project is an image that drew 26 million individual road segments, mapping out all major points of population and transportation. As the co-developer of Processing – an open source programming platform for computational design and interactive media software, Ben Fry’s work often revolved around using creative data visualization as a tool to understand information in both practical and aesthetic ways. In analyzing the image, I believe Fry used an algorithm that drew information from a database record containing the geographical location of all streets in the lower 48, which then mapped said data to the canvas and, in turn, drew curved lines corresponding to each street. All Streets is not only straightforward and effective in its visualization of transportation in the U.S., but it succeeds from a design perspective in its aesthetic layout and composition as well. Computational works like Fry’s All Streets that are practical and pleasing to the eye are a huge part of why I’m taking 15104; afterall, data can be beautiful.
Project 06 – Abstract Clock
I created a boba clock which is milk tea with boba from noon to midnight and juice with lychee jelly from midnight to noon. The number of Jelly/Boba inside the cup, including one inside the straw, represents the hour. Juice/milk shrinks per second, and the full amount disappears per minute. Lastly, a Jelly/Boba stuck inside the straw moves upward per minute and got out from the straw each hour.
//Alicia Kim
//Section B
var x = [];
var y = [];
var angle = [];
function setup() {
createCanvas(300, 400);
for (var i=0; i<(hour()%12-1); i+=1) {
x[i] = random (120,190);
y[i] = random (200,340);
angle[i] = random(360);
}
for(var j=0; j<height; j+=1){
stroke(lerpColor(color(255,232,239) ,color(255,253,208),j/height));
line(0,j,width,j);
}
}
function draw() {
var s = second();
var min = minute();
stroke(0);
//juice with lychee jelly from midnight to noon
//& milk tea with boba from noon to midniht
push();
if (hour()>12){
drawMilk(s);
}
else if (hour()<=12){
drawJuice(s);
}
pop();
push ();
drawCup();
pop();
push();
drawStraw();
pop();
push();
if (hour()>12){
drawBoba();
strawBoba(min);
}
else if (hour()<=12){
drawJelly();
strawJelly(min);
}
pop();
}
// juice inside the cup shrinks per sec
function drawJuice(s){
fill(255,203,164); //orange
quad(70,75,230,75,215,350,85,350); //juice
//cover
fill(255);
quad(70,75,230,75,230-(15/60)*s,75+s*(275/60),70+(15/60)*s,75+s*(275/60));
stroke(255,178,120); //dark orange
fill(255,203,164);
ellipse (width/2, 75+(275/60)*s, 160-(0.5)*s, 60);
}
function drawCup(){
// bigger circle
fill(224,255,255); //light cyan
ellipse (width/2, 75 , 160, 60);
// smaller circle
push();
if (hour()<=12){
fill(255,203,164);
}
else if (hour()>12){
fill(247,231,200);
}
ellipse (width/2, 350, 130, 50);
pop();
//connecting lines
line (70, 75, 85, 350);
line (230, 75, 215, 350);
}
function drawStraw(){
// straw body
push();
fill(0,191,255,50); //sky blue
rect(140,30,20,300);
pop();
// straw holes
ellipse(width/2,30,20,10);
ellipse(width/2,330,20,10);
fill(224,255,255); //light cyan
arc (width/2, 75 , 160, 60, 0, PI, OPEN);
}
// number of jelly inside the cup represents the hour
function drawJelly(){
for (var i=0; i<(hour()%12-1); i++) {
push();
translate(x[i],y[i]);
rotate(radians(angle[i]));
noStroke();
fill(249,246,231,150); //lychee
rect (0,0,10,30); //lychee jelly
pop();
}
}
// jelly inside the straw moves up per minute
function strawJelly(m){
noStroke();
fill(255,255,142);
rect (width/2-5,300-(225/60)*m,10,30);
}
// milk inside the cup shrinks per sec
function drawMilk(s){
stroke(236,220,194); //dark milk color
fill(247,231,200); //milk color
quad(70,75,230,75,215,350,85,350); //juice
//cover
fill(255);
quad(70,75,230,75,230-(15/60)*s,75+s*(275/60),70+(15/60)*s,75+s*(275/60));
fill(247,231,200); //milk color
ellipse (width/2, 75+(275/60)*s, 160-(0.5)*s, 60);
}
// number of boba inside the cup & straw represents the hour
function drawBoba(){
for (var i=0; i<(hour()%12-1); i++) {
push();
stroke(70, 51, 51,100); //darker brown
fill(88,59,57,150); //dark brown
ellipse (x[i],y[i],20,20); //boba
pop();
}
}
// boba inside the straw moves up per minute
function strawBoba(m){
noStroke();
fill(88,59,57);
ellipse (width/2,300-(225/60)*m,20,20);
}
Looking Outwards 06: Randomness
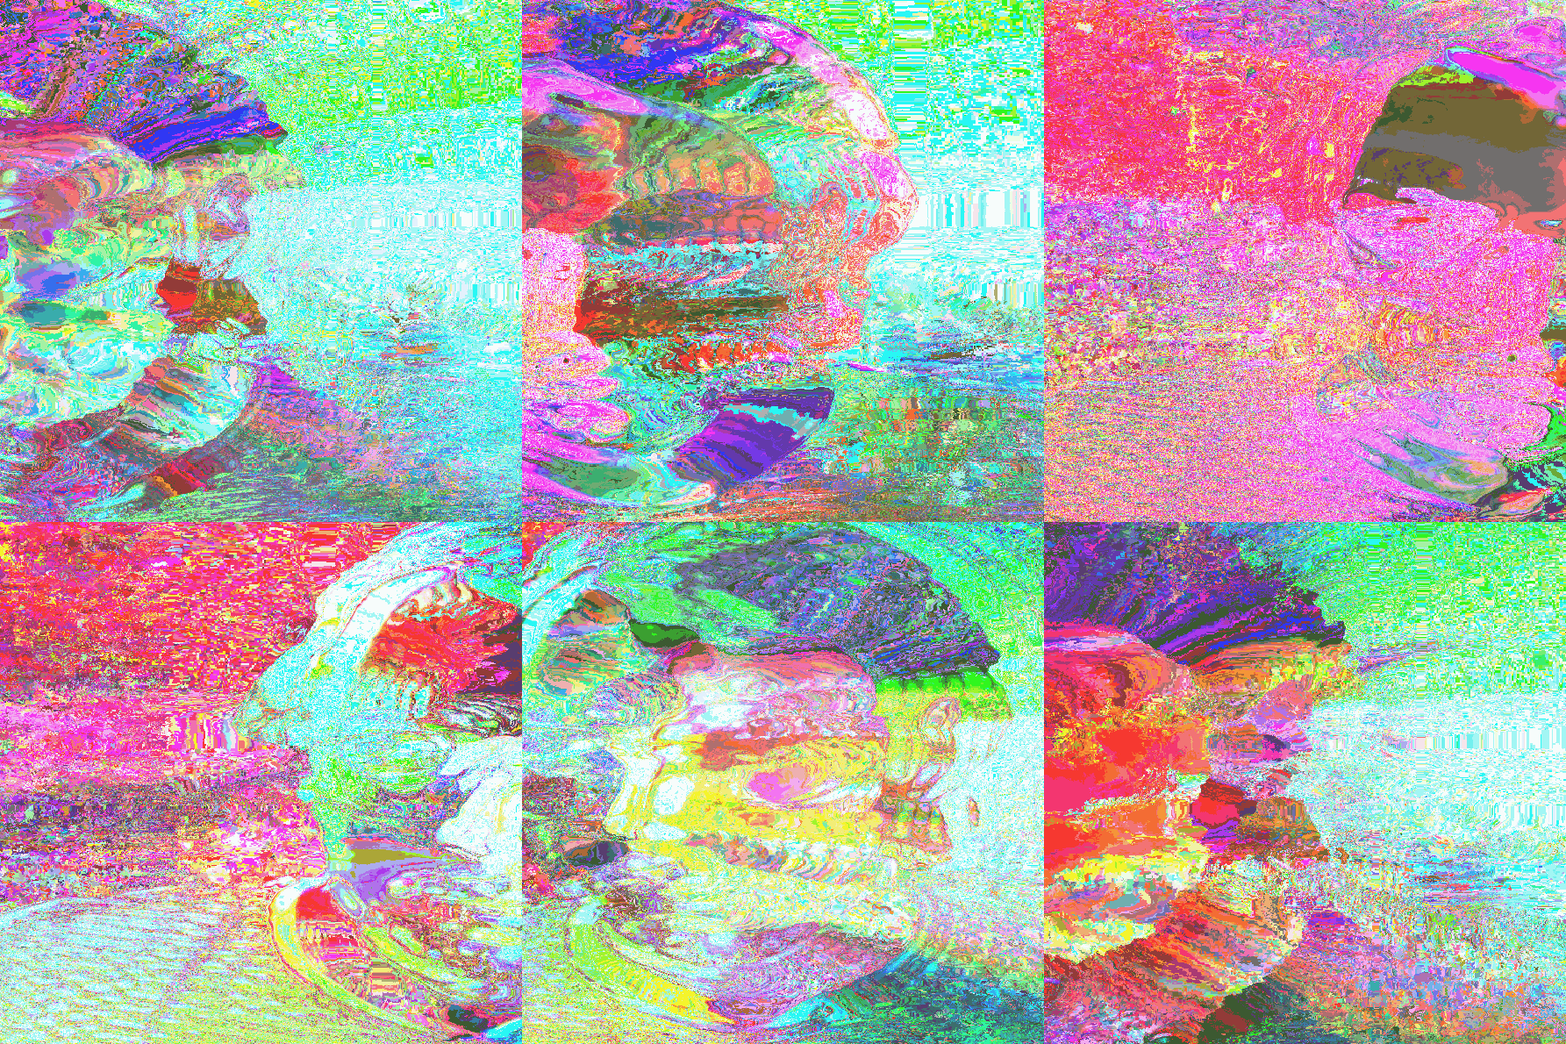
I am inspired by the project, Gush by Adam Ferriss. This piece of digital, algorithmic art is created by the random noise function called Perlin noise. The noise is a pseudo-random function for generating values, which are deterministic sequences and reproducible. The function adds realistic randomness to the color and composition of the piece. Ferriss still has control over some parameters such as the speed of the color change, allowing him to generate images with gradual gradients and in turn, create crazy psychedelic transitions. What I admire about this project is that the piece is not entirely automated, while image-making itself is. Ferriss’s artistic sensibilities could be still manifested in the final piece as he adjusts the parameter’s values until he gets an aesthetically satisfying and completely new type of work.