Looking Outwards 08: The Creative Practice of an Individual

Hyphen-Labs is an international community of women of color who are involved in the fields of design, art, and technology to produce works together. The interdisciplinary nature of the group allows them to focus on design processes through evolving discussions and the collective consciousness of social challenges in the community. 

Work title: Prismatic_NYC

Link: http://hyphen-labs.com/prismatic.html

The Prismatic project is a kinetic sculpture located above the high line in NYC. The sculpture is constructed with 66 individual prisms that have integrated LED lights to create interesting forms of light beams. The rotation and translation of the prisms ‘design’ the behavior of lightning through space. I am amazed by this project because the designers are able to handle each prism’s rotation/speed/form differently to create a cohesive artwork. This requires meticulous planning beforehand in determining the algorithm of each prism, the direction of their rotations, and the interaction between every prism altogether. The team reimagined a new system to create this unique experience: tapering each prism and alternating their orientation. This strategy lets them control the visual vertices of one pair of prisms. The final product is an animated undulating wave of light concurrently achieving lateral translations of the 2D curve, which flows volumetrically through the space.

anabelle’s blog 08

Jake Barton is the Founder and Chief Creative Officer at Local Projects (I’m a local projects fan, so I was pleasantly surprised to see him on the index of speakers). He received his Bachelor’s from Northwestern University for Performance Studies and his Masters’ from New York University in Interactive Technology. Barton has been a pioneer in immersive experience and HCI/UX since 2000. His firm, Local Projects, is a media design studio responsible for award winning projects like the 9/11 Memorial and Museum and the Eisenhower Presidential Memorial. One work that I particularly admire is Greenwood Rising, which is an exhibit on the 1921 Tulsa Race Massacre. It’s one of Local Project’s more recent works, so it’s cool to see how his 2015 lecture content has remained consistent to his original visions, yet also expanded with the introduction of new technology and tools in the present. In his 2015 Eyeo Festival presentation, he mainly spoke about the 9-11 Memorial Museum and the types of experiences and emotions he wanted to evoke through it. He discussed how to present, hold, and distirbute memories through museums and how he tried to involve the audience in the exhibit as well. You can see this in the Greenwood Rising exhibit, which uses XR technology to force the audience to become physically involved to reveal the story of the Tulsa Massacre. One thing I enjoyed about Barton’s presenting skills is how he manages to fly through numerous projects and concepts while still keeping things clear and linear. Even though he breaks from his lecture with an aside about memes, I could still tell that there was a purpose to the tangent and did not feel like the lecture’s flow was broken. His charisma and sociability compel the audience to sit through his 50 minute lecture painlessly, and demonstrates the importance of embedding your personality into your work to make others care about it.

Blog 08

Ron Morrison, an interdisciplinary artist with degrees from universities all over the globe including Parsons and University of Ghana-Legon, is currently a PhD fellow at USC and continues to build a body of work that is inherently personal to them. Their pieces seek to understand and represent “residual black data,” meaning the pieces of black history that have been erased through data visualizations that, though correct, do not encapsulate the experience of what is shown. For exmaple, their map piece, which uses glasses you might get at a 3-D movie showing, uses blue and red linework as a way of showing people how information is filtered for data visulization. Their Eyeo 2019 presentation uses 20th century U.S. river cartography to express the difference between viewing a river as a boundary or object used for transportation and using a different visual representation to see it as a meaningful form to represent change overtime. I thought this was especially effective in getting their point across that, depending on how you view things, you might see them entirely differently, and I will certainly use this to guide my work in architecture. Morrison’s work, especially their pieces focusing on redlining and slow violence in black communities are incredibly powerful and show new ways that we can view information with the tenderness that is necessary when dealing with difficult issues.

Ron Morrison

LookingOutward-08 Adam Harvey

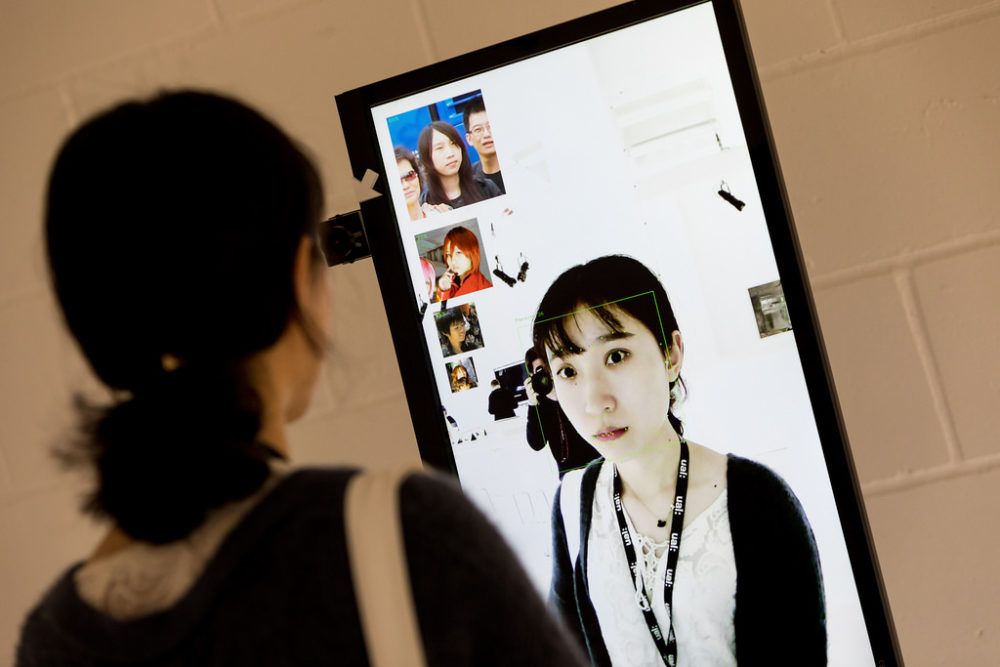
Link to his Website (MegaPixel): https://ahprojects.com/megapixels-glassroom/
Link to his Lecture: https://vimeo.com/354276111?embedded=false&source=video_title&owner=8053320

I investigated the lecture by Adam Harvey, an American artist based in Germany.
His research focuses on computer vision, privacy, and surveillance
technologies. After finishing his Bachelor of Mechanical Engineering at Penn
State, Harvey then pursued a master’s in interactive telecommunications at NYU.

Adam Harvey’s current works include MegaPixel, a facial recognition software
that compares the user’s facial qualities with a database and returns a face
from the database that has the highest similarities. This project mainly
creates awareness of the normalization of databasing people’s faces without
regulation. In many of his other works, such as DFACE, a face

recognition algorithm that redacts faces in images to protect the privacy of
protestors and other individuals. This is especially important in the fast
digitalization society, with more and more algorithms that detect faces and
uploads them to further databases like MegaPixel, it would be crucial for
researchers like Adam Harvey to create apps that help protect people’s privacies.

Harvey’s strategy in his speech is in a continuous fashion, where he starts with
the previous project, explains details that lead to his current assignment, and
then starts giving an overview of his current projects. This gives the
audience a complete understanding of the process that led to the conclusion. He
also does a good job of simplifying the concept of his projects, making
it, making it easier for the audience to understand the final concept.

Looking Outwards 08

Paul Soulellis

An artist and professor at RISD interested in the meaning of crisis and Urgent Craft, as well as permanence, Paul Soulellis introduces himself as a queer artist and educator. As a child and young adult, Soulellis grappled with the self-hatred that came with being gay in the 70s and 80s as the AIDS crisis swept the nation. Since then, his queerness has deeply impacted his artistic practice. Although he recognizes his privileges, the difficult process of becoming secure in his sexuality was deeply entwined with a sense of urgency. Yet, Soulellis argues that slowing down in today’s society is inherently queer because it goes against the cultural fixation with acceleration. In response to this idea, he created the body of work: QUEER.ARCHIVE.WORK (2013-2018), which is a vast series of printed web publications from queer artists, aiming to immortalize the fast-paced culture of internet art. Since this first foray into printing websites, Soulellis has created many collections of printed internet images, published books of redacted tweets from politicians, zines of digital protests, and many other examples of printed literature. Although the digital world is ever-expansive, I greatly admire that Soulellis continues to create physical copies of the art and protest material that is so indicative of our generation. 

Looking Outward – 08

Eyeo Presentation : Refik Anadol
“Archive Dreaming”

Refik Anadol is a Turkish media artist based in LA that creates huge environmental art pieces driven by data. He operates Refik Anadol Studio and RAS LAB which both focus on “discovering and developing trailblazing approaches to data narratives and artificial intelligence”. He has a background in fine art. As an aspiring environmental and experience designer, I really loved being able to see how his work embodies the environments that they are in and connected to. A lot of his pieces are public art which adds another fun layer of defining space and giving people a new experience. He is able to take both architecture and open space and embed more meaning using data. For example, he created an installation in Boston that took data of the ocean breeze to visualize the connection of the city to the sea. Some of his other work utilizes invisible signals like LTE and bluetooth within spaces to create data visualizations and again visualize parts of those spaces that otherwise wouldn’t be seen or recognized. That is so cool! Another amazing project he shared was called “Archive Dreaming” in which archives turned into a data driven, visual experience. The computer almost becomes a living thing that processes your request and shares history in a new, beautiful way. Upon watching Anadol’s presentation, his imagery and videos in general were very successful in capturing your attention, but I also enjoyed how he integrated humor and light-heartedness into his talk, especially when talking about his past and moving forward with his work in cutting edge technology.

Artist: Refik Anadol
Website: https://refikanadol.com
https://vimeo.com/channels/eyeo2019/355843371
“Archive Dreaming” -> https://player.vimeo.com/video/218573298?autoplay=0&color=ffffff&title=0&byline=0&portrait=0&muted=1

LoookingOutwards-08

Alexander Chen works at Google Creative Lab exploring his interest in visualizing and augmenting audio and music from human interaction. His goal is to not only discover different ways music works but to also create playful programs that question what can make music: in his opinion, anything, from instruments to subways maps.  In his presentation for Eyeo (2017), he displays various projects he created that all create sound differently; some respond to voice input and match it to a song pattern, and another visualized temporal lag in music. The one I found most interesting was one program that, linked to a mini keyboard, would display the colored dots with different transparencies and placements that represented the keys and the intensity of key press or volume. Beyond hearing the music, this program allowed people to see the music almost as a story with notes as strings of characters that interact in a complex dance; as the music gets more complex the characters multiply and move faster but in a pattern clear to those listening. This visualization also helps people hear the music better as they can see which sounds are made of multiple notes and where these notes are placed relative to each other. Another program I found very interesting is called Spectrogram, which is on his website, Chrome Music Lab, (which he designed as a playground of audio). Most programs he places on this website lack labels and encourages children to discover and explore how the audio in each program is manipulated. I think his work allows people of all ages to learn not only how sounds work but to think of it in different, unconventional ways.

Mother Cyborg

Mother Cyborg, AKA, Diana Nucera, is an artist, educator and community organizer. She is heavily active in the Detroit Area, and looks to develop technology meant to impact communities that are being left behind in the digital age. In her lecture at Eyeo, she showed data about Detroit residences access to broadband, and how that correlates to people impacted by poverty. She co-founded the Detroit Digital Justice Coalition (DDJC) that works in the Detroit area to make sure that everyone has equal access to technology and media. They also share the tools to do this freely with the public, and organize communities together to generate solutions within the digital landscape. In 2014, she founded the Detroit Community Technology Project (DCTP). Through this program, she has expanded community technology in Detroit through the Equitable Internet Initiative.

Through her Mother Cyborg alter-ego, she has developed music and art that discusses where technology intersects social spaces and relationships. She was a Kresge Literary Arts Fellow in 2019. She recieved her Bachelor of Fine Arts in New Media at San Francisco Art Institute, and her Masters of Fine Arts from the School of the Arts Institute in Chicago. She is now looking into AI and how that with music can advance community digital justice issues.

A body of work of hers that I admire is from her Pressure Systems album from 2017. Her first track, 3souled Women, has a very interesting electronic beat that is catchy and very dance worthy. But what I really like is her lyrics. She talks about a cyborg women’s body and how it experiences pain, but can’t verbalize what it is. It is very other worldly and so very different from music I usually listen to. I enjoyed the whole album, but I do really like the first track.

From her justice initiatives, I really liked the Beat Match Brunch initiative. In her Mother Cyborg persona, she taught women and gender non conforming individuals how to play and scratch records to make their own beats. Her hope is to diversify Detroit’s music scene and creating a network for these musicians to grow into and with. Being a female musician myself, I really resonated with this idea and story.

Diana presented her work by using interesting visuals in a powerpoint presentation that complimented or augmented her speaking. She also connected with her audience by asking for a reaction to her ideas or issues. She had a good and clear tone of her voice to present, and she was very likable.
At the end of her presentation, she sang a song that she sings at the beginning of every show she does. The song is her way of cleansing the palate and opening up the soul to evoke empathy and receive a story. By singing that song at the end, she was really connecting with her audience and providing them an experience that is similar to if they saw her perform a show live. I can use all these techniques, except the singing, to use when I present my own work.

To see more of her work and CV, here is Diana’s website: http://www.mothercyborg.com/

Diana Nucera Eyeo 2019 Presentation entitled:
MOTHER CYBORG IS HERE TO ESCORT YOU INTO THE FUTURE WITH LOVE

Eyeo 2019 – Diana Nucera from Eyeo Festival on Vimeo.

Project 7 Curves

This is my project: the left and right mouse movements change the number of curves and the up and down spins the objects. Clicking the mouse changes the type of circle on the outside of the rose curve.

sketch
//Michael Li
//Section C 

//set variables for points
var points = 100;
//set variable for state machine
var type = 0


function setup() {
    createCanvas(400, 400);
    frameRate(25)
}


function draw() {
    background(50);
    //add text
    text("Click to change shape", 20, 30)
    //move to the center of the canvas
    translate(width/2,  height/2)
    
    //to change the shapes between spiral and flower
    if (type == 0){
    spiral() //spiral function
    } else if(type == 1){
        //repeat the function for flower
        for(var i = 0; i <5; i++){
            //different state
            drawEpitrochoid(i) 
        }
    } 
    //draw center flower
    drawRoseCurve();


}

function drawRoseCurve() {
    // RoseCurve
    //constrain the mouse within the canvas
    var conMX = (constrain(mouseX, 0, width))
    var conMY = (constrain(mouseY, 0, width))
    //map the height of the rosecurve
    var h = map(conMY, 0, width, width*1/5, width*2/5)

    var x;
    var y;
    //map the color to the mouse movement
    var mapColorX = map(mouseX, 0, width, 100, 255)
    var mapColorY = map(mouseY, 0, width, 100, 255)
    //the color of the rosecurve changes depending on the outer elements
    if(type == 0){
        //blue and orange
        var c = color(mapColorX, mapColorX/2+mapColorY/2, mapColorY)
    } else if (type == 1){
        //green and purple
        var c = color(mapColorX/2+mapColorY/2, mapColorY, mapColorX)
    }
    var r; 
    //have the variable n only store odd numbers for better rose curve
    var n = printOdd(int(map(conMX, 0, width, 3, 20)))
    
    noFill()
    strokeWeight(1)
    stroke(255)
    circle(0, 0, h*2)
    fill(c)
    stroke(c);
    //draw rose curve
    beginShape();
        for (var i = 0; i < points; i++) {
            var theta = map(i, 0, points, 0, PI);
        
            r = h*cos(theta*n)
            x = r*cos(theta+conMY)
            y = r*sin(theta+conMY)
            curveVertex(x, y);

        }
    endShape(CLOSE)
}

//draw spiral
function spiral(){
    //constrain mouse within the canvas
    var conMY = (constrain(mouseY, 0, width))
    //map value to mouseY
    var a = map(conMY, 0, width, width*1/5, width*2/5)
    
    var x;
    var y;
    var r;

    noFill()
    push()
    beginShape()
    //map number of points to mouse Y
    //spiral grows as mouseY moves
    var mapYPoints = map(mouseY, 0, height, 25, 100)
        //draw spiral
        for (var u = 0; u < mapYPoints; u++) {
            //theta depend on mouse Y
            //spiral spins
            var theta = map(u, 0, mapYPoints/10, 0, TWO_PI);
            //circle size depend on mouseY
            var mapSize = map(u, 0, mapYPoints, 40, 10)
            r = ((theta)**(1/2))*a/4
            x = r*cos(theta+10)
            y = r*sin(theta+10)

            curveVertex(x, y)
            stroke(255-u*4)
            fill(255-u*4)
            //draw circles on the spiral
            circle (x, y, mapSize/2)
            stroke(200)
            noFill()
        }
    endShape()
}
//draww epitrochoid
function drawEpitrochoid(rot){
    push()
    //constrain mouseX and mouseY
    var conMX = (constrain(mouseX, 0, width))
    var conMY = (constrain(mouseY, 0, width))
    var a = map(conMY, 0, width, width*1/5, width*2/5)
    var b = constrain(a / int(conMX / 30), 0, 20)
print(a)
    var x;
    var y;

    //rotates the shape each loop
    rotate(rot+conMY/10)
    noFill()
    stroke(200)
    push()
    beginShape()
    //fill the shape with lower opacity to create layering effect
    fill(200, 200, 200, 50)
    var mapYPoints = map(mouseY, 0, height, 0, 25)
    //draw epitrochoid
        for (var u = 0; u < 100; u++) {
            var theta = map(u, 0, 100, 0, TWO_PI);

            x = rot/2*(a+b)*cos(theta)-b*cos(((a+b)/b)*theta);
            y = rot/2*(a+b)*sin(theta)-b*sin(((a+b)/b)*theta);
            curveVertex(x, y)

            
        }
    endShape(CLOSE)
    pop()
}
//only store odd numbers in a variable
function printOdd(x){

    if(x%2 == 0){
        return x-1
    } else{
        return x
    }
}
//swtich the type when mouse pressed

function mousePressed() {
    type += 1
    if(type > 1){
        type = 0
    }
}

Dynamic Snowflakes

For this project I used the rose curves and epicycloid functions to create this composition. The rose curve (white) resembles a snow flake and as the mouse moves the it changes but still looks like a snow flake. When mouse is at zero, the middle of the composition, 480 or off the canvas it creates a circle. The epicycloid changes in complexity and in color as the mouse moves.

sketch
//Nakshatra Menon
//Section C

var nPoints = 240;


function setup() {
    createCanvas(480, 480);
    background(246, 242, 240);
    colorMode(HSB);
}


function draw() {
    background("black");
    translate (width/2, height/2); // origin is middle of canvas 
    noFill();
    epicycloid(0, 0);             // shape 1
    roseCurve(0,0);               // shape 2 
}

function roseCurve(){  // draw rose curve from https://mathworld.wolfram.com/RoseCurve.html
    var g = constrain(mouseY/32, 5, 15);      // g is based on mouse Y
    var n = constrain(int(mouseX), 0, 480);   // n is based on mouse X
    strokeWeight(.5);
    stroke("white");
    beginShape();
    for (var i = 0; i < nPoints; i++) {
        var t = map(i, 0, nPoints, 0, TWO_PI);
        var radius = 10 * cos(n * t);    // function 

        // first set of values 
        var x = g*radius * cos(t);       // function 
        var y = g*radius * sin(t);       // function 

        // second set of values 
        var x1 = 2*g*radius * cos(t);    // function 
        var y1 = 2*g*radius * sin(t);    // function 

        vertex(x, y);                    // vertex for shape
        vertex(x1, y1);                  // vertex 2 for shape 
    }
    endShape(CLOSE);
}  

function epicycloid (){    // draw the epicycloid from https://mathworld.wolfram.com/Epicycloid.html
    var f = constrain(int(mouseY/20), 2, 48);        // output of number based on mouse Y
    strokeWeight(1);
    stroke(332,mouseX/5, 20);                        // color changes based on mouse X position 
    for (var a = 10; a <240; a = a+10){              // how many epicycloids are drawn 
        var b = a/f                                  // b is related to mouse Y
        beginShape();
        for (var i = 0; i < nPoints; i++) {
            var t = map(i, 0, nPoints, 0, TWO_PI);  // remaps 

            var x = (a+b)*cos(t) - b*cos(((a+b)/b)*t); // function 
            var y = (a+b)*sin(t) - b*sin(((a+b)/b)*t); // function 

            vertex(x, y);                              // vertex for points 
        }

    endShape(CLOSE); 
    }  
}