lo: information visualization

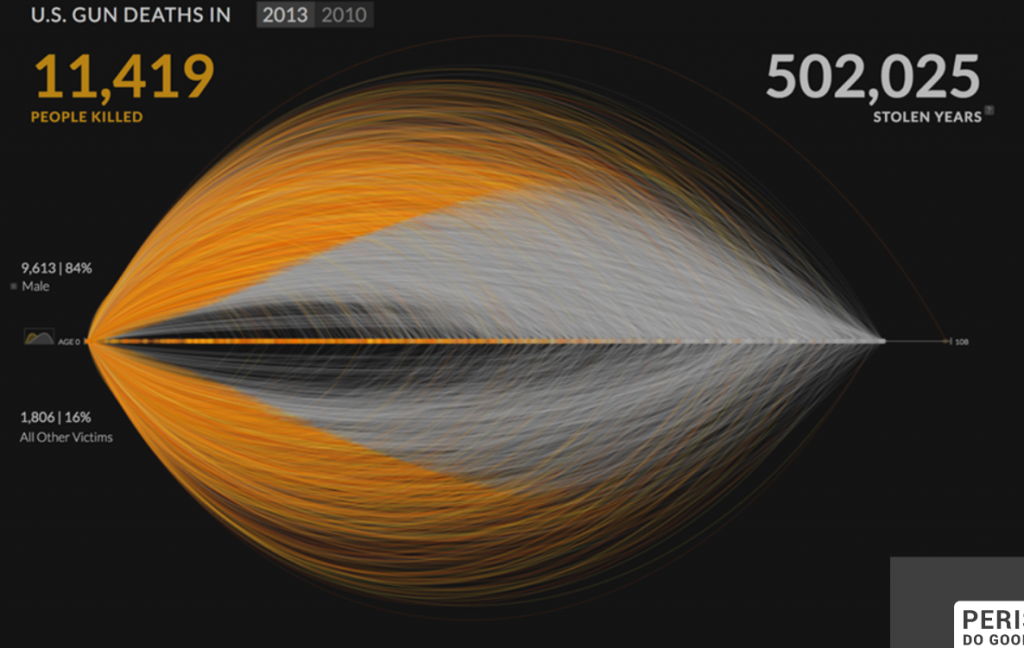
Gun Deaths in U.S visualization (Periscopic 2013)

Seeing this prompt for this week, I immediately thought of the firm that made the visualization above years ago about gun violence. Periscopic is a data viz firm that emphasizes their artistic foundation in every project. Their website showcases a lot of their hand drawn process behind every final piece, and each project is developed and computed in a unique way for the cause. As a design student, I really appreciate not only their technical and artistic attention to detail, but their cultural awareness and ability to place their work in context of human lives, which often gets lost when talking about statistics and computer generated pieces.

Looking Outwards 07: Computational Information Visualization

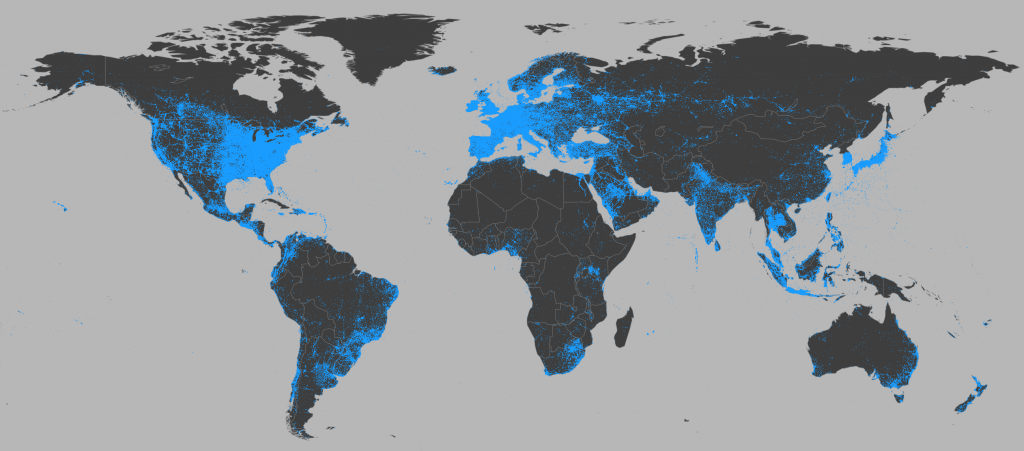
To better understand Computational Information Visualization, I looked into the Visual Earth project led by Dr. Lev Manovich. It’s a really cool project that compiles data about images and photographs on the internet on a visual map of the earth in order to understand global growth trends better, and how our visually heavy spaces online vary geographically in relation to various factors like economic and cultural differences. They compute this by using images from Twitter that have the locations tagged. However, they mention only processing a part of the total data set they collect (100 out of 270 million) which is done through a random process much like the ‘random’ function in p5.js. The visual form of processing and communicating this massive amount of information is really useful in allowing people to visually process different rates of image sharing as they are influenced by things like income or even geographical landscape.

https://visual-earth.net/

LO 7: Visualizing Information

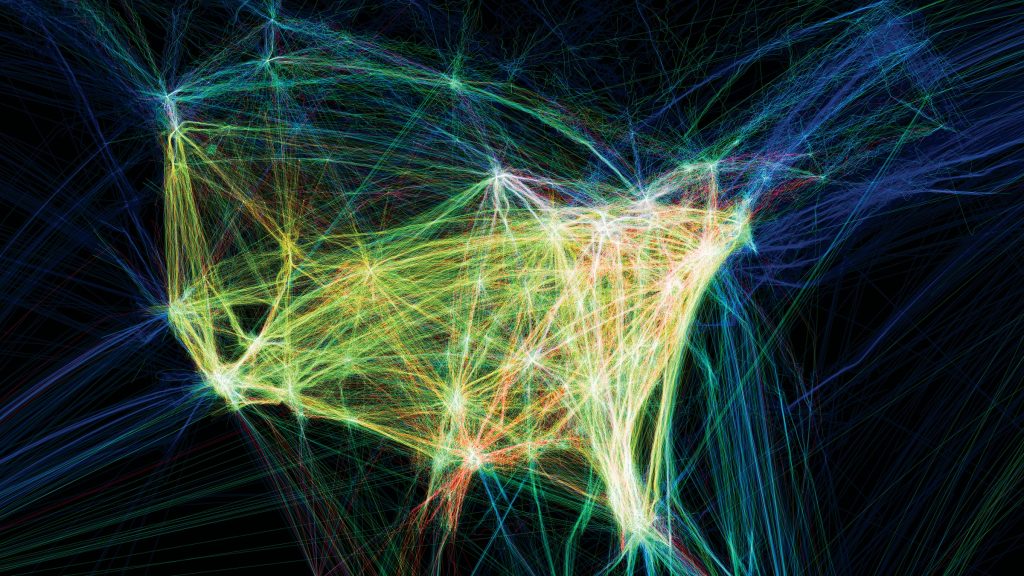
I looked at the project about Flight Patterns that represent visual information. This project plots flight patterns throughout the US visually using colors and lines. It was created as an experimental project for “Celestial Mechanics” by Scott Hessles and Gabriel Dunne at UCLA. I find this visual data intriguing because flight patterns are not something explicitly visual so it’s interesting to see what areas and cities have the most air traffic which is visually represented in this project as varying colors of lines with lighter lines as more trafficked areas. when zooming into a specific city the data is detailed enough to see the specific flight patterns within the city itself. The algorithm was developed with data that is processed through the Processing program which plots out the lines visually.

website link

Looking Outwards 07: Information Visualization

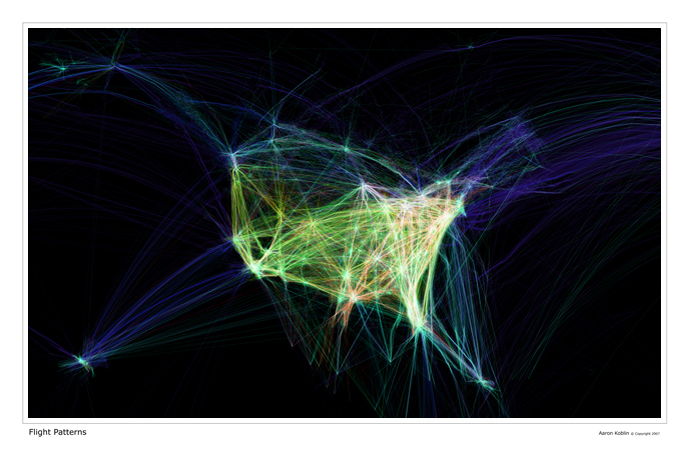
I chose to look at Flight Patterns by Aaron Koblin. This visualization of the flight data over North America was interesting to me because of how non-geometric it is. The closer you zoom into the maps, the more mycelial the shape of the flight paths become. I think we commonly believe that planes move from point A to point B along a straight line, but as we look at this map, it’s clear that that image is incorrect. I think for me it’s the mycelial nature of these flight paths, having nexuses and crisscrossing to create this intricate web that I find really intriguing. Such nonlinear patterns replete with random elements always fascinate me. The algorithms seem fairly simple and easy to understand. A flight path is charted from its beginning to its end, its x and y coordinates (latitude and longitude) mapped out using point based lines. It’s just an interesting exploration of randomness to me.

Flight Patterns (in color) by Aaron Koblin

Project-07: Composition with Curves

sketch curveDownload
/*
Sandy Youssef; 
section D; 
syoussef@andrew.cmu.edu;
Project-07;
*/

function setup() {
    createCanvas(480, 480);
    frameRate(6);
    
}

function draw() {
    // Epicloid Curve
    //https://mathworld.wolfram.com/Epicycloid.html
    background(255);
    drawEpicloid1();
    drawEpicloid2();
    drawEpicloid3(); 
    drawEpicloid4();
    drawEpicloid5();
    drawEpicloid6();
    drawEpicloid7();
    drawEpicloid8();


}

function drawEpicloid1() {
//curve located at the top right that moves according to mouse Y 
push();
    translate( width/2-100, height/2-100);
    var x; 
    var y; 

    var a = 20;; // radius of smaller circle that moves around bigger circle to create points
    var b = a * 3;  // radius
    var theta = 30;
    var move = mouseY/50
    fill(255, 0, 0, 50); // transparent pink
    beginShape();
    for (var i = 0; i < 100; i ++) {
        var theta = map ( i , 0, 100, 0, TWO_PI);
        x = (a + b) * cos(theta) - b * cos (theta * (a + b) /b * move);  // mathematical formula for the curve
        y = (a + b) * sin (theta) - b * sin (theta * (a + b) /b * move);
        vertex(x,y);
    }
    endShape(CLOSE);
    pop();

}

function drawEpicloid2() {
// same curve as drawEpicloid1 but moves in opposite direction
push();
    translate( width/2-100, height/2-100);
    var x; 
    var y; 

    var a = 20;; // radius of smaller circle 
    var b = a * 3;  // radius
    var theta = 30;
    var move = mouseY/50
    fill(200, 210, 0,50); //transparent yellow
    beginShape();
    for (var i = 0; i < 100; i ++) {
        var theta = map ( i , 0, 100, 0, TWO_PI);
        x = (a + b) * cos(-theta) - b * cos (-theta * (a + b) /b * move);  // mathematical formula for the curve
        y = (a + b) * sin (-theta) - b * sin (-theta * (a + b) /b * move);
        vertex(x,y);
    
    }
    endShape(CLOSE);
    pop();

}
function drawEpicloid3() {
// curve located at top right that moves according to mouse X
push();
    translate( width/2+100, height/2-100);
    var x; 
    var y; 

    var a = 20;; // radius of smaller circle 
    var b = a * 3;  // radius
    var theta = 30;
    var move = mouseX/50
    fill(200, 210, 0,50); // transparent yellow
    beginShape();
    for (var i = 0; i < 100; i ++) {
        var theta = map ( i , 0, 100, 0, TWO_PI);
        x = (a + b) * cos(theta) - b * cos (theta * (a + b) /b * move);  // mathematical formula for the curve
        y = (a + b) * sin (theta) - b * sin (theta * (a + b) /b * move);
        vertex(x,y);
    }
    endShape(CLOSE);
    pop();

}

function drawEpicloid4() {
// same curve as drawEpicloid3 but moves in opposite direction according to mouse X
push();
    translate( width/2+100, height/2-100);
    var x; 
    var y; 

    var a = 20;; // radius of smaller circle 
    var b = a * 3;  // radius
    var theta = 30;
    var move = mouseX/50
    fill(200, 0, 0,100); // brighter pink
    beginShape();
    for (var i = 0; i < 100; i ++) {
        var theta = map ( i , 0, 100, 0, TWO_PI);
        x = (a + b) * cos(-theta) - b * cos (-theta * (a + b) /b * move);  // mathematical formula for the curve
        y = (a + b) * sin (-theta) - b * sin (-theta * (a + b) /b * move);
        vertex(x,y);
    }
    endShape(CLOSE);
    pop();

}

function drawEpicloid5() {
// curve located in bottom right corner that moves according to mouse Y
push();
    translate( width/2+100, height/2+100);
    var x; 
    var y; 

    var a = 20;; // radius of smaller circle 
    var b = a * 3;  // radius
    var theta = 30;
    var move = mouseY/50
    fill(200, 210, 0,50); // transparent yellow
    beginShape();
    for (var i = 0; i < 100; i ++) {
        var theta = map ( i , 0, 100, 0, TWO_PI);
        x = (a + b) * cos(theta) - b * cos (theta * (a + b) /b * move);  // mathematical formula for the curve
        y = (a + b) * sin (theta) - b * sin (theta * (a + b) /b * move);
        vertex(x,y);
    }
    endShape(CLOSE);
    pop();

}

function drawEpicloid6() {
// same curve as drawEpicloid5 but moves in opposite direction according to mouse Y
push();
    translate( width/2+100, height/2+100);
    var x; 
    var y; 

    var a = 20;; // radius of smaller circle 
    var b = a * 3;  // radius
    var theta = 30;
    var move = mouseY/50
    fill(0, 210, 0,50); // transparent green
    beginShape();
    for (var i = 0; i < 100; i ++) {
        var theta = map ( i , 0, 100, 0, TWO_PI);
        x = (a + b) * cos(-theta) - b * cos (-theta * (a + b) /b * move);  // mathematical formula for the curve
        y = (a + b) * sin (-theta) - b * sin (-theta * (a + b) /b * move);
        vertex(x,y);
    }
    endShape(CLOSE);
    pop();
}

function drawEpicloid7() {
// curve located in bottom left corner that moves according to mouse X
push();
    translate( width/2-100, height/2+100);
    var x; 
    var y; 

    var a = 20;; // radius of smaller circle 
    var b = a * 3;  // radius
    var theta = 30;
    var move = mouseX/50
    fill(0, 250, 0,130); // brighter transparent green
    beginShape();
    for (var i = 0; i < 100; i ++) {
        var theta = map ( i , 0, 100, 0, TWO_PI);
        x = (a + b) * cos(theta) - b * cos (theta * (a + b) /b * move);  // mathematical formula for the curve
        y = (a + b) * sin (theta) - b * sin (theta * (a + b) /b * move);
        vertex(x,y);
    }
    endShape(CLOSE);
    pop();

}

function drawEpicloid8() {
// same curve as drawEpicloid7 but moves in opposite direction according to mouse X
push();
    translate( width/2-100, height/2+100);
    var x; 
    var y; 

    var a = 20;; // radius of smaller circle 
    var b = a * 3;  // radius
    var theta = 30;
    var move = mouseX/50
    fill(200, 210, 0,50); //transparent yellow
    beginShape();
    for (var i = 0; i < 100; i ++) {
        var theta = map ( i , 0, 100, 0, TWO_PI);
        x = (a + b) * cos(-theta) - b * cos (-theta * (a + b) /b * move);  // mathematical formula for the curve
        y = (a + b) * sin (-theta) - b * sin (-theta * (a + b) /b * move);
        vertex(x,y);
    }
    endShape(CLOSE);
    pop();
}

Looking Outwards 07: Information Visualization

Creator’s name: Stamen
Title of work: SFMoMA Artscope
Year of Creation: 2020

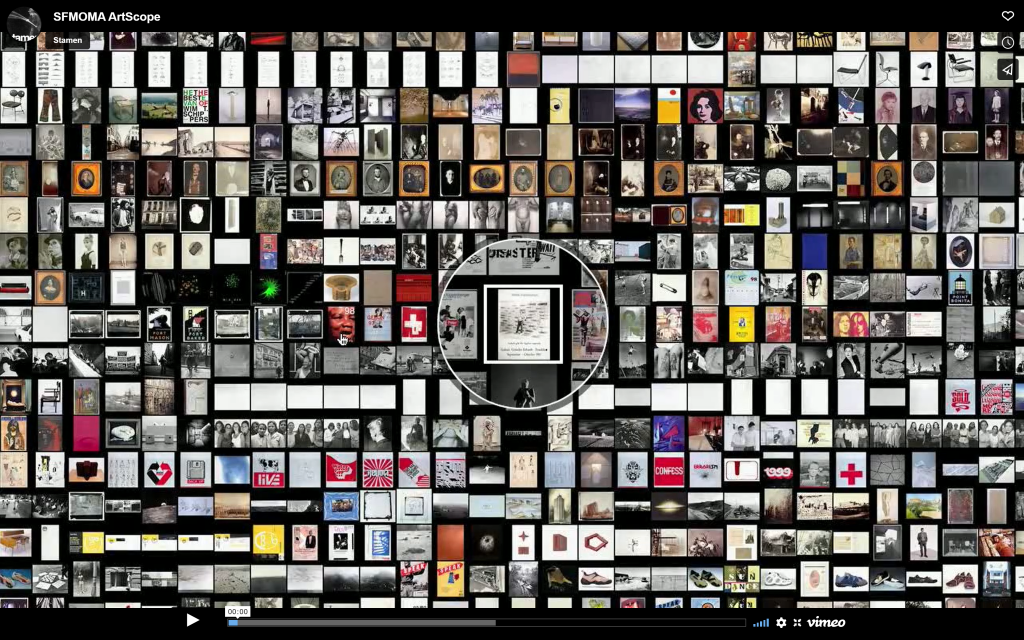
This project by Stamen is an interesting take on a museum map. It maps everything in the San Francisco Museum of Modern Art’s collection through images of the displays that are currently in the museum. Using an interactive mapping technology known as “Modest Maps ”, this software creates a virtual environment where individuals can zoom and pan through artworks that are arranged depending on when and where they were bought to be displayed in the museum. I find this design to be quite a unique way of displaying information organized chronologically. As opposed to a website where the user scrolls down, this format instead creates a much more interactive and easy-to-understand approach. I would assume that the algorithm used to generate this work involves arrays that organize the works by date of purchase. In addition, I would assume that there is another array that considers where the artworks were bought since there must be a way to store such a large amount of information in order to organize it. The designer’s artistic sensibilities are present in this work since it complements their other work to create a cohesive style and approach to visual communication. This style is even present in the design of the website itself.

https://stamen.com/work/sfmoma-artscope/

Screenshot of the map

Looking Outwards 07 – Data Visualization

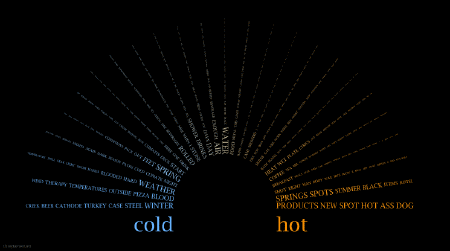
One data visualization project that really impressed me is the work of Chris Harrison piece Word Associations Visualizing Google Bi-Gram Data. The piece portrays words on a spectrum based on a frequency. It definitely relates to the notion of arrays and traversing through different groups of data and finding different calculations (namely average and mode I’m assuming). This piece really stuck to me because it touches on a cultural/linguistic phenomenon of word association, and how the frequency of words contribute to its societal perception/usage (a feedback loop that directly influences how much a word is used).

What I especially appreciate about this piece is how natural the integration with technology and graphics was undertaken. The whole point of data visualization is to present information in a more impactful and comprehensible way. While there are many ways the idea of frequency of a list can be pretty standard, the way they organize the words in a curved composition with focal points towards the edges of the canvas really draws your eyes to see all the words and the transition between them.


https://www.chrisharrison.net/index.php/Visualizations/WordAssociations

Project 07 – Composition with Curves

Inspiration by Epicycloid Function

sketch
//Aarnav Patel
//aarnavp@andrew.cmu.edu
//Section D
//Project

var n = 1000;
var c;

function setup() {
    createCanvas(480, 480);
    c = color(random(255), random(255), random(255));

}

function draw() {
	background(0);
	for (var i = 0; i < 3; i++) {
		drawSpiral(i * width / 2);			//draws three times
	}

}

function mousePressed() {
	c = color(random(255), random(255), random(255));
}

function drawSpiral(w) {
	stroke(c);
	push();
	translate(w, height / 2);	//Setting the origin
	noFill();
	var x;
	var y;
    var a = constrain(mouseX, 0, width);		
    var b = constrain(mouseY, 0, height);		//Constrains aim to keep proportional when mouse is in Canvas

	
	strokeCap(ROUND);
    strokeJoin(ROUND);
    var t = 0;

    beginShape();					//Starting shape before vertices inputted
	for (var i = 0; i < n; i++) {							
		var t = map(i, 0, n, 0, TWO_PI);
		x = (a + b) * cos(t) - b * cos((a + b / b) * t);		//Using the elipcycloid function for the x and y (cos and sin)
		y = (a + b) * sin(t) - b * sin((a + b / b) * t);
		vertex(x, y);

	}
	endShape();					//ending the shape
	pop();						//resetting for the next time its called

}


/*

function drawSpiral() {
	//x	=	(a+b)cosphi-bcos((a+b)/bphi)

	//=	a^2[cos(2theta)+/-sqrt((b/a)^4-sin^2(2theta))].

	noStroke();
	var a = mouseX / 4;
	var b = 50;

	strokeCap(ROUND);
	strokeJoin(ROUND);
	var t = 0;
	push();
	translate(width / 2, height / 2);
	if (a > b) {
		//push();
		beginShape();
		for (var i = 0; i < n; i++) {
			t = map(i, 0, n, 0, TWO_PI);
			var r = sqrt(a * a * ( cos(t) + sqrt(pow((b / a), 4) - pow(sin(2 * t), 2))));

			var x = r * cos(t);
			var y = r * sin(t);
			console.log(x + ", " + y)

			vertex (-x, y);
		}
		endShape();
		//pop();
	}
		
	//push();
	beginShape();
	for (var i = 0; i < n; i++) {
		t = map(i, 0, n, 0, TWO_PI);
		var r = sqrt(a * a * ( cos(t) + sqrt(pow((b / a), 4) - pow(sin(2 * t), 2))));

		var x = r * cos(t);
		var y = r * sin(t);
		console.log(x + ", " + y)

		vertex(x, y);
	}
	endShape();
	pop();
}
*/

07 Project

sketch
//Evette LaComb 
//section D 
//deliverable 7 project

var Cardioid= 0; // Astroid Inovulte oarametric 
var nPoints = 100; // points manipulted on the shape 


function setup() {
    frameRate(5);
    createCanvas(400, 400);
    background(220);
}

function draw() {
    background("lightBLue")
    // if mouse is above or below the monster backgrounf red:
    if (dist(width/2, mouseY, width/2, height/2) > 100) {
        background("red");
    } 
    //Draw the astroid monster
    fill("white"); 
    draw_cardioid(width/2, 150);
    }

    function draw_cardioid(x, y) {
        // transformations for esthetics
        push();
        translate(x, y);
        rotate(radians(90));
        // set variables
        var x;
        var y;
        //set esthetics
        stroke("red");
        fill("blue");
        //draw monster occording to the cardioid equations 
        beginShape();
    for (var i = 0; i < nPoints; i++) {
        var manipulate = mouseX/20;
        var t = map(i, 0, nPoints, 0, TWO_PI);
        var a = mouseX/8 +50;
        var p = random(mouseY/350, .5);
        var q = random(mouseY/350, .5);


        x = a *(1+ cos(t)) *(cos(t) * 1.5 * p);
        y = a *(1+ cos(t)) *(sin(t)* 1.5 *q);
        vertex(x, y);
        } 
        endShape(CLOSE);
        pop();
     
    }

Looking Outwards 07

For this week’s Looking Outwards, I looked at the works of Stephanie Posavec. I was intrigued by her works simply by the color visuals I saw when first opening up her website. Her goals are set around visualizing and communicating data in new ways. The project of hers I chose to focus on was Data Murmurations: Points in flight. This project visualized data samples, but connected them back to the people who actually donated samples. The title murmuration comes from a group of birds in the sky following a path. They converge and diverge in their journey. One thing lacking from Posavec’s description of her work is a description of the more technical tools she used to create her work. She uses sorting algorithms to sort all of her data and then visualize it, but I am not too sure about the specifics. I could assume there are some simple if statements about the data, such as if it is one thing it goes somewhere and if it is another it goes somewhere else.