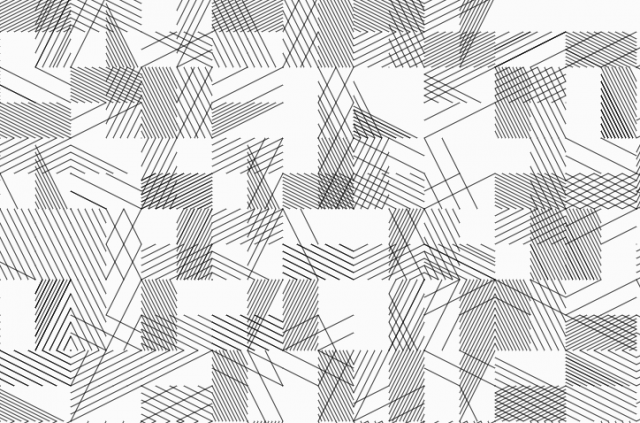
- the piece is composed mostly of diagonals across rectangles
- the rectangles are 1:2
- there are no squares
- most diagonal sections are parallel lines spaced equally apart
- here are some exceptions


- (I was lazy and did not implement these)
- As seen in image one the middle line is thicker than the neighbouring ones in part probably due to rounding errors
- Some of the diagonals across rectangles fill up to the half the space
- the space between the lines selected per rectangle
- The code was potentially run twice as the rectangles overlap
- there are multiple orientations for the lines. They either run left top to right bottom or right top corner to left bottom corner
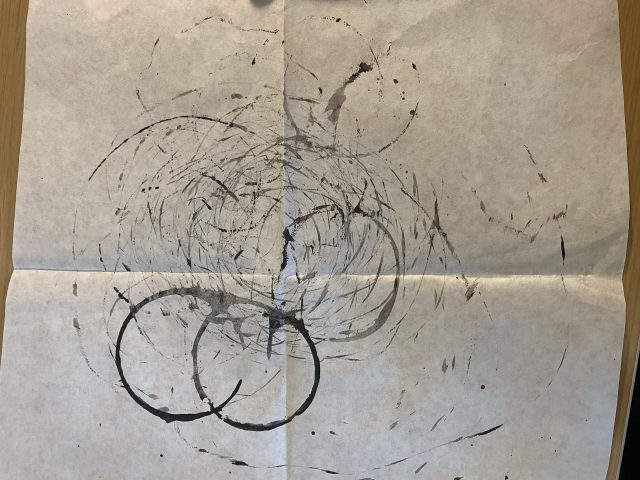
here’s what I generated

My work I feel is sort of close to the artists. However, I didn’t implement those small exceptions because I was lazy and tired. This work was hard to make because it took me a while just to generate the individual component of a random rectangle section and on top of that the math to produce the diagonals within it. Easily took me 5 hours because of that.
My code
https://editor.p5js.org/miniverse/sketches/gV2HWWueA
/* export SVG
DDF 2019
need to have p5.svg.js in project and in index.html
see -https://github.com/zenozeng/p5.js-svg
this will save an SVG file in your download folder
*/

function setup() {
  createCanvas(800, 800, SVG);
  strokeWeight(1); // do 0.1 for laser
  stroke(0, 0, 0); // red is good for laser
  nSquares = 20;
  strokeWeight(0.4)
  noFill(); // better not to have a fill for laser
}


function distance(x1, y1, x2, y2){
  return (y1 - y2)*(y1 - y2) + (x1 - x2)*(x1 - x2)
}

function fillSquare(squareW, startX,startY,  box1, box2, percentOptions){
  orientation = random([0, 1])
  percent = random(percentOptions)
  threshold = squareW * 7 * percent;
  if(orientation){
    point1 = [(box1[0] * squareW) + startX, (box1[1] * squareW) +startY]
    point2 = [(box2[0] * squareW) + startX, (box2[1] * squareW) +startY]

    spacingX = abs(point1[0] - point2[0]) * percent;
    spacingY = abs(point1[1] - point2[1]) * percent;
    if(random() < 0.7){ while(distance(point1[0], point1[1], point2[0], point2[1]) > threshold ){
        line( point1[0], point1[1], point2[0], point2[1]);
        point1 = [point1[0] + spacingX, point1[1]]
        point2 = [point2[0], point2[1] - spacingY]
      }
    }
    point1 = [(box1[0] * squareW) + startX, (box1[1] * squareW) +startY]
    point2 = [(box2[0] * squareW) + startX, (box2[1] * squareW) +startY]
    if(random() < 0.9){ while(distance(point1[0], point1[1], point2[0], point2[1]) > threshold ){
        point1 = [point1[0], point1[1] + spacingY]
        point2 = [point2[0] - spacingX, point2[1]]
        line( point1[0], point1[1], point2[0], point2[1]);
      }
    }
    return;
  }

  point1 = [(box2[0] * squareW) + startX, (box1[1] * squareW) +startY]
  point2 = [(box1[0] * squareW) + startX, (box2[1] * squareW) +startY]

  spacingX = abs(point1[0] - point2[0]) * percent;
  spacingY = abs(point1[1] - point2[1]) * percent;

  while(distance(point1[0], point1[1], point2[0], point2[1]) > threshold ){
    line( point1[0], point1[1], point2[0], point2[1]);
    point1 = [point1[0] - spacingX, point1[1]]
    point2 = [point2[0], point2[1] - spacingY]

  }
  point1 = [(box2[0] * squareW) + startX, (box1[1] * squareW) +startY]
  point2 = [(box1[0] * squareW) + startX, (box2[1] * squareW) +startY]
  if(random() < 0.7){ while(distance(point1[0], point1[1], point2[0], point2[1]) > threshold ){

      point1 = [point1[0], point1[1] + spacingY]
      point2 = [point2[0] + spacingX, point2[1]]
      line( point1[0], point1[1], point2[0], point2[1]);
    }
  }
}
function makeGrid(percentOptions){
  squareW = width / nSquares;
  for (var r = 0; r < nSquares; r++ ) {
    for (var c = 0; c < nSquares; c++) {
      box1 = random([[0, 0.0, 0.0], [1, 0.5, 0.0], [2, 0, 0.5]])
      if(box1[0] == 0){
        box2 = random([[ 1.0, 0.5], [0.5, 1.0]])
      }
      if(box1[0] == 1 || box1[0] == 2){
        box2 = [1.0, 1.0]
      }
      box1 = [box1[1], box1[2]]
      fillSquare(squareW, r * squareW, c * squareW, box1, box2, percentOptions);
    }
  }
}
function draw() {
  makeGrid([0.1, 0.2, 0.5]);
  makeGrid([0.1, 0.2, 0.5]);
  makeGrid([ 0.2, 0.5]);
  save("mySVG.svg"); // give file name
  print("saved svg");
  noLoop(); // we just want to export once
}
